Attached files
| file | filename |
|---|---|
| EX-99.1 - EXHIBIT 99.1 - FireEye, Inc. | tm2118082d1_ex99-1.htm |
| EX-2.1 - EXHIBIT 2.1 - FireEye, Inc. | tm2118082d1_ex2-1.htm |
| 8-K - FORM 8-K - FireEye, Inc. | tm2118082d1_8k.htm |
Exhibit 99.2
June 2, 2021 Kevin Mandia , CEO John Watters, President and COO Frank Verdecanna, EVP, CFO and CAO Announcing Sale of FireEye Products Business to Symphony Technology Group

Safe Harbor 2 ©2021 FireEye | Mandiant This presentation contains forward - looking statements within the meaning of Section 27A of the Securities Act of 1933, as amende d, and Section 21E of the Securities Exchange Act of 1934, as amended. These forward - looking statements are based on management’s beliefs and assumptions and on info rmation currently available to management. Forward - looking statements include information concerning: the timing of the completion of the transaction for the sale of the FireEye Products business (the “transaction”); the amount of cash proceeds and the use thereof; the effects of the transaction on FireEye’s remaining c ust omers and Mandiant’s controls - agnostic software and services; the company’s ability to accelerate growth investments, pursue new go - to - market pathways, and focus innov ation on its solutions; its expectations around the certainty of and timing of closing of the transaction; expectations regarding the stock repurchase program; any ot her statements of expectation or belief; and any statements of assumptions underlying any of the foregoing, as well as statements regarding plans and opportunities. Forward - looking statements include all statements that are not historical facts and can be identified by terms such as “anticipa tes,” “believes,” “could,” “seeks,” “estimates,” “intends,” “may,” “plans,” “potential,” “predicts,” “projects,” “should,” “will,” “would” or similar expressions an d the negatives of those terms. Forward - looking statements involve known and unknown risks, uncertainties and other factors that may cause our actual results, performance or ac hievements to be materially different from any future results, performance or achievements expressed or implied by the forward - looking statements. Forward - looking sta tements represent our management’s beliefs and assumptions only as of the date of this presentation. You should read our filings with the SEC, including the Ris k F actors set forth therein, completely and with the understanding that our actual future results may be materially different from what we expect. Except as required by law w e a ssume no obligation to update these forward - looking statements publicly, or to update the reasons why actual results could differ materially from those anticipated in the forward - looking statements, even if new information becomes available in the future. Any future offering, feature, or related specification that may be referenced in this presentation is for information purpose s o nly and is not a commitment to deliver any offering, technology or enhancement. We reserve the right to modify future product and service plans at any time. This presentation includes certain non - GAAP financial measures as defined by the SEC rules. As required by Regulation G, we have provided a reconciliation of those measures to the most directly comparable GAAP measures, which is available in the appendix.

3 ©2021 Mandiant Financial Overview Frank Verdecanna, EVP, CFO and CAO

4 ©2021 FireEye | Mandiant Financial Rationale Accelerate ARR Growth Drive to “Rule of 40” Growth and Margin Profile Share Repurchase Program
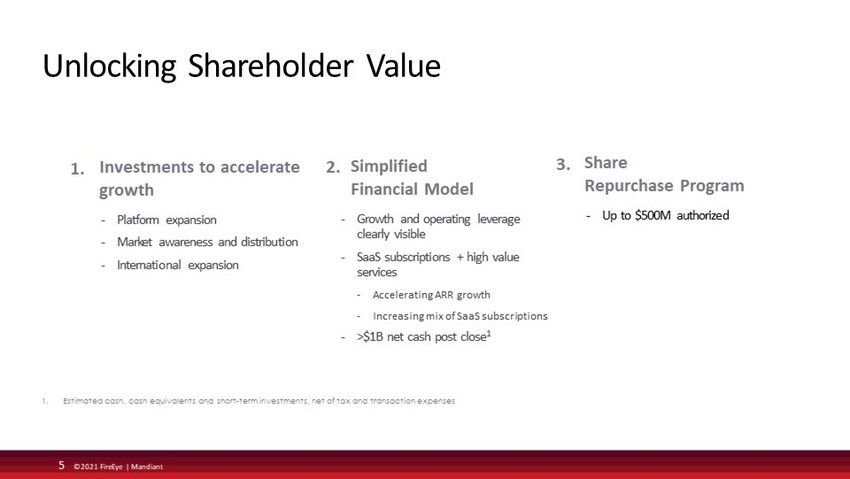
5 ©2021 FireEye | Mandiant Unlocking Shareholder Value Share Repurchase Program - Up to $500M authorized Simplified Financial Model - Growth and operating leverage clearly visible - SaaS subscriptions + high value services - Accelerating ARR growth - Increasing mix of SaaS subscriptions - >$1B net cash post close 1 2. Investments to accelerate growth - Platform expansion - Market awareness and distribution - International expansion 1. 3. 1. Estimated cash, cash equivalents and short - term investments, net of tax and transaction expenses

$148 $196 $227 2018 2019 2020 6 ©2021 FireEye | Mandiant Accelerate Mandiant ARR Growth New Logo Growth Net Expansion Multiple sales motions New modules Mandiant Annual Recurring Revenue ($M) Cross - sell / Up - sell Maintain high retention rates Global Customer Opportunity 2021 and beyond 2018 - 2020 CAGR 24%

7 ©2021 FireEye | Mandiant Sustained Contribution from Services $33.6 $35.3 $36.0 $38.7 $40.6 $43.5 $46.1 $50.1 $50.6 $52.6 $54.6 $57.8 $63.3 Q1'18 Q2'18 Q3'18 Q4'18 Q1'19 Q2'19 Q3'19 Q4'19 Q1'20 Q2'20 Q3'20 Q4'20 Q1'21 Consensus 3 - Yr CAGR ‘19 - ’22 2 Gross Margin % 3 (non - GAAP) Enterprise Value / 2021 Rev FireEye | Mandiant Services 19% 55% 3 Public Consulting Companies 4 13% 35% 2 5x Top 3 Public Consulting 5 19% 36% 2 9x Professional Services 1 Quarterly Revenue ($M) Q1’18 – Q1’21 Industry - leading Growth and Margins 1. Includes Mandiant Consulting Services, product training, deployment and integration 2. FactSet consensus estimates as of 6/1/21 3. FireEye |Mandiant Professional Services 2020 gross margin (including Mandiant Consulting Services, product training, deployme nt and integration) Non - GAAP, reconciliations to the nearest GAAP financial metric available in the Appendix. Reconciliations are not available for forward looking metrics 4. Accenture, Infosys Ltd, Cognizant, Wipro Ltd, Capgemini, EPAM Systems, Globant SA, Genpact Ltd, Exponent, ExlService Holdings, Grid Dynamics, and Endava 5. Top 3 EV/2021 Revenue publicly traded consulting companies: Expo, Globant , and EPAM

- 17% - 9% 10 - 15% 8 ©2021 FireEye | Mandiant Mandiant “Rule of 40” Growth & Margin $265 $331 $400 >$1B 2018 2019 2020 2025 5 Year CAGR >20% SaaS >60% Services <40% Revenue ($M) Non - GAAP Operating Margin (% of revenue) High Value Services SaaS 2020 Revenue $ 199 M Future revenue growth targets 20 - 25 % CAGR Future revenue growth targets 15 - 20 % CAGR 2020 Revenue $ 201 M 2018 - 2020 23% CAGR 2018 - 2020 23 % CAGR 1. Non - GAAP, reconciliations to the nearest GAAP financial metric available in the Appendix. Reconciliations are not available for forward looking metrics.
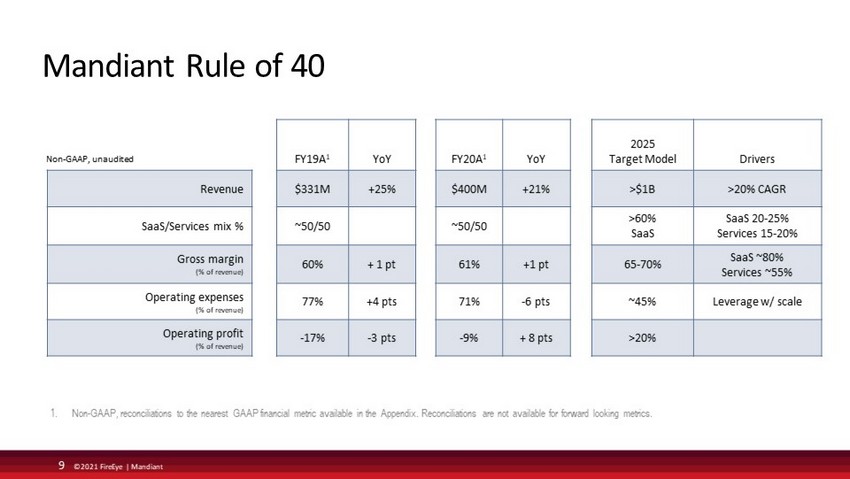
9 ©2021 FireEye | Mandiant Mandiant Rule of 40 FY19A 1 YoY FY20A 1 YoY 2025 Target Model Drivers Revenue $331M +25% $400M +21% >$1B >20% CAGR SaaS/Services mix % ~50/50 ~50/50 >60% SaaS SaaS 20 - 25% Services 15 - 20% Gross margin (% of revenue) 60% + 1 pt 61% +1 pt 65 - 70% SaaS ~80% Services ~55% Operating expenses (% of revenue) 77% +4 pts 71% - 6 pts ~45% Leverage w/ scale Operating profit (% of revenue) - 17% - 3 pts - 9% + 8 pts >20% Non - GAAP, unaudited 1. Non - GAAP, reconciliations to the nearest GAAP financial metric available in the Appendix. Reconciliations are not available for forward looking metrics.

10 ©2021 FireEye | Mandiant ▪ Annual standalone financials (revenue through operating income) included in the Appendix ▪ Quarterly results for 1H 2020 and 1H 2021 standalone financial results will be included with Q2 earnings release ▪ Reporting for FireEye Products business for Q2’21 and Q3’21 – Assets and liabilities of FireEye Products business will be classified as “held for sale” in the assets and liabilities sections of the balance sheet – Results of Operations consolidated into a single “Discontinued Operations” line below Net Income from Continuing Operations Financial Disclosures

Appendix
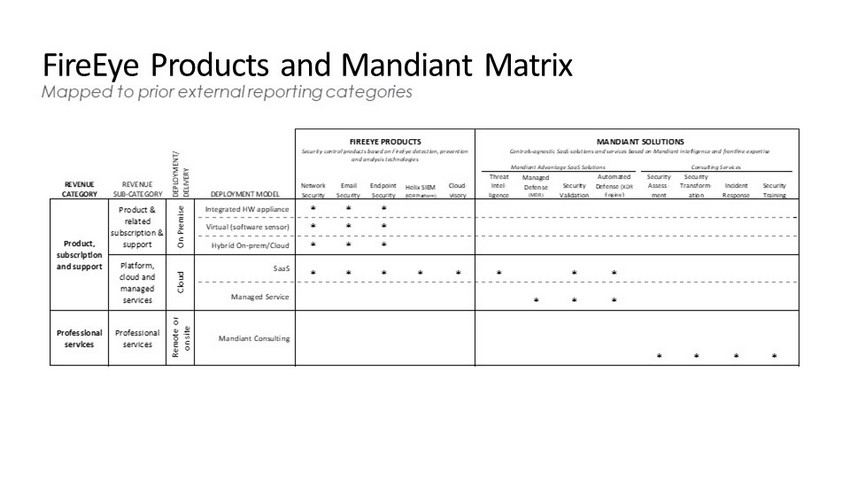
FireEye Products and Mandiant Matrix Mapped to prior external reporting categories REVENUE CATEGORY DEPLOYMENT MODEL Integrated HW appliance * * * Virtual (software sensor) * * * Hybrid On-prem/Cloud * * * SaaS * * * * * * * * Managed Service * * * Professional services Professional services Remote or on site Mandiant Consulting * * * * 2020 Revenue 2020 Billings ARR (3/31/21) $541M, (3)% YoY $400M, +21% YoY $407M, +3% YoY $236M, +20% YoY Cloud- visory FIREEYE PRODUCTS MANDIANT SOLUTIONS DEPLOYMENT/ DELIVERY Security control products based on FireEye detection, prevention and analysis technologies Controls-agnostic SaaS solutions and services based on Mandiant intelligence and frontline expertise Mandiant Advantage SaaS Solutions Consulting Services Threat Intel- ligence Managed Defense (MDR) Security Validation REVENUE SUB-CATEGORY Network Security Email Security Endpoint Security Helix SIEM (XDR Platform) Product, subscription and support Product & related subscription & support On Premise Platform, cloud and managed services Cloud Automated Defense (XDR Engine) Security Assess- ment Security Transform- ation Incident Response Security Training
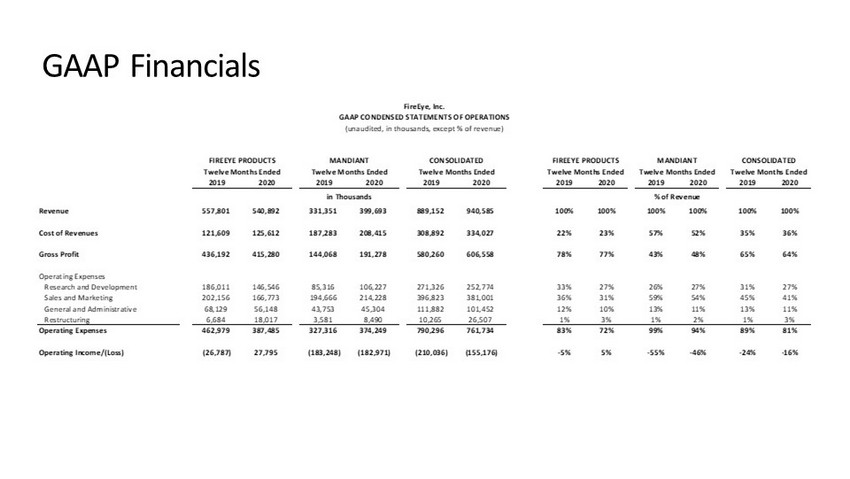
GAAP Financials 2019 2020 2019 2020 2019 2020 2019 2020 2019 2020 2019 2020 Revenue 557,801 540,892 331,351 399,693 889,152 940,585 100% 100% 100% 100% 100% 100% Cost of Revenues 121,609 125,612 187,283 208,415 308,892 334,027 22% 23% 57% 52% 35% 36% Gross Profit 436,192 415,280 144,068 191,278 580,260 606,558 78% 77% 43% 48% 65% 64% Operating Expenses Research and Development 186,011 146,546 85,316 106,227 271,326 252,774 33% 27% 26% 27% 31% 27% Sales and Marketing 202,156 166,773 194,666 214,228 396,823 381,001 36% 31% 59% 54% 45% 41% General and Administrative 68,129 56,148 43,753 45,304 111,882 101,452 12% 10% 13% 11% 13% 11% Restructuring 6,684 18,017 3,581 8,490 10,265 26,507 1% 3% 1% 2% 1% 3% Operating Expenses 462,979 387,485 327,316 374,249 790,296 761,734 83% 72% 99% 94% 89% 81% Operating Income/(Loss) (26,787) 27,795 (183,248) (182,971) (210,036) (155,176) -5% 5% -55% -46% -24% -16% FireEye, Inc. GAAP CONDENSED STATEMENTS OF OPERATIONS (unaudited, in thousands, except % of revenue) Twelve Months Ended Twelve Months Ended Twelve Months Ended CONSOLIDATED % of Revenuein Thousands FIREEYE PRODUCTS MANDIANT Twelve Months Ended Twelve Months Ended Twelve Months Ended FIREEYE PRODUCTS MANDIANT CONSOLIDATED

Non - GAAP Financials 2019 2020 YoY 2019 2020 YoY 2019 2020 YoY 2019 2020 2019 2020 2019 2020 Revenue 557,801 540,892 -3% 331,351 399,693 21% 889,152 940,585 6% 100% 100% 100% 100% 100% 100% Cost of revenues 110,267 115,566 130,932 154,333 241,199 269,899 20% 21% 40% 39% 27% 29% Gross profit 447,534 425,326 200,419 245,359 647,953 670,686 80% 79% 60% 61% 73% 71% Gross Profit % 80% 79% 60% 61% 73% 71% Operating expenses Research and development 153,306 120,818 69,749 81,909 223,055 202,727 27% 22% 21% 20% 25% 22% Sales and marketing 176,765 146,652 155,004 167,891 331,769 314,543 32% 27% 47% 42% 37% 33% General and administrative 50,421 42,927 30,898 32,925 81,319 75,852 9% 8% 9% 8% 9% 8% Operating expenses 380,491 310,396 255,650 282,725 636,142 593,121 68% 57% 77% 71% 72% 63% Operating income/(loss) 67,042 114,930 (55,231) (37,366) 11,811 77,565 12% 21% -17% -9% 1% 8% Operating margin % 12% 21% -17% -9% 1% 8% % of Revenuein Thousands FIREEYE PRODUCTS MANDIANTFIREEYE PRODUCTS Twelve Months Ended MANDIANT Twelve Months Ended CONSOLIDATED Twelve Months Ended Twelve Months Ended Twelve Months EndedTwelve Months Ended FireEye, Inc. NON-GAAP CONDENSED STATEMENTS OF OPERATIONS (unaudited, in thousands, except % of revenue) CONSOLIDATED

GAAP to non - GAAP Reconciliations 2019 2020 2019 2020 2019 2020 2019 2020 2019 2020 2019 2020 Revenue 557,801 540,892 331,351 399,693 889,152 940,585 100% 100% 100% 100% 100% 100% GAAP cost of revenue 121,609 125,612 187,283 208,415 308,892 334,027 22% 23% 57% 52% 35% 36% Less: Stock based compensation 6,659 7,062 22,218 28,027 28,877 35,089 1% 1% 7% 7% 3% 4% Amortization of intangible assets 3,508 2,684 34,134 26,055 37,642 28,739 1% 0% 10% 7% 4% 3% Capitalized stock based compensation 1,174 300 0 0 1,174 300 0% 0% 0% 0% 0% 0% Non-GAAP cost of revenue 110,267 115,566 130,932 154,333 241,199 269,899 20% 21% 40% 39% 27% 29% GAAP Research and Development 186,011 146,546 85,316 106,227 271,326 252,771 33% 27% 26% 27% 31% 27% Less: Stock based compensation 30,815 23,638 14,662 22,229 45,476 45,867 6% 4% 4% 6% 5% 5% Amortization of intangible assets 445 352 0 0 445 349 0% 0% 0% 0% 0% 0% Capitalized stock based compensation 1,445 1,739 905 2,089 2,350 3,828 0% 0% 0% 1% 0% 0% Non-GAAP Research and Development 153,306 120,818 69,749 81,909 223,055 202,727 27% 22% 21% 20% 25% 22% GAAP Sales and Marketing 202,156 166,773 194,666 214,228 396,822 380,998 36% 31% 59% 54% 45% 41% Less: Stock based compensation 23,881 18,551 25,317 31,110 49,198 49,662 4% 3% 8% 8% 6% 5% Amortization of intangible assets 1,510 1,570 14,346 15,226 15,855 16,794 0% 0% 4% 4% 2% 2% Non-GAAP Sales and Marketing 176,765 146,652 155,004 167,891 331,769 314,543 32% 27% 47% 42% 37% 33% GAAP General and Administrative 68,129 56,148 43,753 45,304 111,881 101,452 12% 10% 13% 11% 13% 11% Less: Stock based compensation 17,708 13,222 12,258 11,954 29,966 25,176 3% 2% 4% 3% 3% 3% Acquisition related expenses 0 0 597 425 597 425 0% 0% 0% 0% 0% 0% Non-GAAP General and Administrative 50,421 42,927 30,898 32,925 81,318 75,852 9% 8% 9% 8% 9% 8% Restructuring charges 6,684 18,017 3,581 8,490 10,265 26,507 1% 3% 1% 2% 1% 3% GAAP operating income/(loss) (26,787) 27,795 (183,248) (182,971) (210,036) (155,176) -5% 5% -55% -46% -24% -16% Plus: Stock based compensation 79,063 62,472 74,455 93,320 153,517 155,793 14% 12% 22% 23% 17% 17% Amortization of intangible assets 5,463 4,606 48,480 41,281 53,942 45,883 1% 1% 15% 10% 6% 5% Capitalized stock based compensation 2,619 2,040 905 2,089 3,524 4,129 0% 0% 0% 1% 0% 0% Acquisition related expenses 0 0 597 425 597 425 0% 0% 0% 0% 0% 0% Restructuring charges 6,684 18,017 3,581 8,490 10,265 26,507 1% 3% 1% 2% 1% 3% Non-GAAP operating income/(loss) 67,042 114,930 (55,231) (37,366) 11,809 77,559 12% 21% -17% -9% 1% 8% in Thousands % of Revenue Twelve Months Ended Twelve Months Ended Twelve Months Ended Twelve Months Ended Twelve Months Ended Twelve Months Ended FireEye, Inc. RECONCILIATION OF NON-GAAP FINANCIAL MEASURES (unaudited, in thousands, except % of revenue) FIREEYE PRODUCTS MANDIANT CONSOLIDATEDFIREEYE PRODUCTS MANDIANT CONSOLIDATED
