Attached files
| file | filename |
|---|---|
| EX-99.1 - EX-99.1 - HORIZON BANCORP INC /IN/ | d155585dex991.htm |
| 8-K - 8-K - HORIZON BANCORP INC /IN/ | d155585d8k.htm |

Exhibit 99.2 Extension of Low-Cost Deposit Franchise with Acquisition of 14 Michigan Branches INVESTOR PRESENTATION | MAY 2021 ® E X C E P T I O N A L S E R V I C E • S E N S I B L E A D V I C E Exhibit 99.2 Extension of Low-Cost Deposit Franchise with Acquisition of 14 Michigan Branches INVESTOR PRESENTATION | MAY 2021 ® E X C E P T I O N A L S E R V I C E • S E N S I B L E A D V I C E

Important Information Forward-Looking Statements This presentation may contain forward-looking statements regarding the financial performance, business prospects, growth and operating strategies of Horizon. For these statements, Horizon claims the protections of the safe harbor for forward-looking statements contained in the Private Securities Litigation Reform Act of 1995. Statements in these presentation materials should be considered in conjunction with the other information available about Horizon, including the information in the filings we make with the Securities and Exchange Commission. Forward-looking statements provide current expectations or forecasts of future events and are not guarantees of future performance. The forward-looking statements are based on management’s expectations and are subject to a number of risks and uncertainties. We have tried, wherever possible, to identify such statements by using words such as “anticipate,” “estimate,” “project,” “intend,” “plan,” “believe,” “will” and similar expressions in connection with any discussion of future operating or financial performance. Although management believes that the expectations reflected in such forward-looking statements are reasonable, actual results may differ materially from those expressed or implied in such statements. Risks and uncertainties that could cause actual results to differ materially include risk factors relating to the banking industry and the other factors detailed from time to time in Horizon’s reports filed with the Securities and Exchange Commission, including those described in its most recent annual and quarterly reports on Form 10-K and Form 10-Q and the following: the possibility that the transaction does not close when expected or at all because required regulatory approvals and other conditions to closing are not received or satisfied on a timely basis or at all; the risk that the benefits from the transaction may not be fully realized or may take longer to realize than expected, including as a result of the effects of the COVID-19 pandemic changes in general economic and market conditions, interest and exchange rates, monetary policy, laws and regulations and their enforcement, and the degree of competition in the geographic and business areas in which Horizon currently and intends to operate; the ability to promptly and effectively integrate the acquired branches into the business of Horizon Bank; the reaction of the companies’ customers, employees and counterparties to the transaction; and the diversion of management time on transaction-related issues. Undue reliance should not be placed on the forward-looking statements, which speak only as of the date hereof. Horizon does not undertake, and specifically disclaims any obligation, to publicly release the result of any revisions that may be made to update any forward-looking statement to reflect the events or circumstances after the date on which the forward-looking statement is made, or reflect the occurrence of unanticipated events, except to the extent required by law. Non-GAAP Measures Certain non-GAAP financial measures are presented herein. Horizon believes they are useful to investors and provide a greater understanding of Horizon’s business without giving effect to non-recurring costs and non-core items. For each non-GAAP financial measure, we have presented comparable GAAP measures and reconciliations of the non-GAAP measures to those GAAP measures in the Appendix to this presentation. ® 2 E X C E P T I O N A L S E R V I C E • S E N S I B L E A D V I C E Important Information Forward-Looking Statements This presentation may contain forward-looking statements regarding the financial performance, business prospects, growth and operating strategies of Horizon. For these statements, Horizon claims the protections of the safe harbor for forward-looking statements contained in the Private Securities Litigation Reform Act of 1995. Statements in these presentation materials should be considered in conjunction with the other information available about Horizon, including the information in the filings we make with the Securities and Exchange Commission. Forward-looking statements provide current expectations or forecasts of future events and are not guarantees of future performance. The forward-looking statements are based on management’s expectations and are subject to a number of risks and uncertainties. We have tried, wherever possible, to identify such statements by using words such as “anticipate,” “estimate,” “project,” “intend,” “plan,” “believe,” “will” and similar expressions in connection with any discussion of future operating or financial performance. Although management believes that the expectations reflected in such forward-looking statements are reasonable, actual results may differ materially from those expressed or implied in such statements. Risks and uncertainties that could cause actual results to differ materially include risk factors relating to the banking industry and the other factors detailed from time to time in Horizon’s reports filed with the Securities and Exchange Commission, including those described in its most recent annual and quarterly reports on Form 10-K and Form 10-Q and the following: the possibility that the transaction does not close when expected or at all because required regulatory approvals and other conditions to closing are not received or satisfied on a timely basis or at all; the risk that the benefits from the transaction may not be fully realized or may take longer to realize than expected, including as a result of the effects of the COVID-19 pandemic changes in general economic and market conditions, interest and exchange rates, monetary policy, laws and regulations and their enforcement, and the degree of competition in the geographic and business areas in which Horizon currently and intends to operate; the ability to promptly and effectively integrate the acquired branches into the business of Horizon Bank; the reaction of the companies’ customers, employees and counterparties to the transaction; and the diversion of management time on transaction-related issues. Undue reliance should not be placed on the forward-looking statements, which speak only as of the date hereof. Horizon does not undertake, and specifically disclaims any obligation, to publicly release the result of any revisions that may be made to update any forward-looking statement to reflect the events or circumstances after the date on which the forward-looking statement is made, or reflect the occurrence of unanticipated events, except to the extent required by law. Non-GAAP Measures Certain non-GAAP financial measures are presented herein. Horizon believes they are useful to investors and provide a greater understanding of Horizon’s business without giving effect to non-recurring costs and non-core items. For each non-GAAP financial measure, we have presented comparable GAAP measures and reconciliations of the non-GAAP measures to those GAAP measures in the Appendix to this presentation. ® 2 E X C E P T I O N A L S E R V I C E • S E N S I B L E A D V I C E

Branch Acquisition Summary 14 branches, ~$976M of deposits and ~$278M of loans 1.75% premium on deposits with 14 TCF National Bank branches in Michigan Attractive Pricing 0.08% average cost of deposits, expected to further reduce HBNC’s total deposit cost, which Low-Cost Core Deposits was an average of 0.21% in the first quarter of 2021 compared to a peer median of 0.27%* Low operating cost of 14 branches should reduce HBNC’s already low efficiency ratio of Low-Cost Operations 57.03% and annualized OpEx-to-average-assets ratio of 2.20% Acquiring mortgage, consumer and small business loans at a 3.5% discount Performing Loans Expected to exceed 17% accretion to 2022 EPS Highly Accretive TBV dilution of 5.0% with an earnback of approximately two years Modest TBV Dilution Exceeds HBNC hurdle rates including approximately 21% internal rate of return Strong IRR Very productive deployment of excess holding-company capital and $60.0 million of cash Deploying Capital down-streamed to the bank, with no external capital raise required for this transaction Adds mass and scale in Midland and provides entry to other attractive markets in the Complementary Markets northern and central regions of Michigan’s lower peninsula th th Michigan branch transaction will be HBNC’s 15 acquisition since ‘02 and 5 since ’17, and Proven Integrator the company continues to evaluate additional M&A opportunities Closing by the end of 3Q21, subject to regulatory approval and customary closing conditions and adjustments; conservative attrition assumptions given industry-wide surge in deposits Key Assumptions from federal stimulus funding, in addition to normal runoff; and approximately $2M in pre-tax non-recurring transaction-related expenses * HBNC data as of 1Q21. Peer medians for U.S. commercial banks with $3B-$7B in assets, according to most-recent quarter data available from S&P Global Market Intelligence. ® 3 E X C E P T I O N A L S E R V I C E • S E N S I B L E A D V I C E Branch Acquisition Summary 14 branches, ~$976M of deposits and ~$278M of loans 1.75% premium on deposits with 14 TCF National Bank branches in Michigan Attractive Pricing 0.08% average cost of deposits, expected to further reduce HBNC’s total deposit cost, which Low-Cost Core Deposits was an average of 0.21% in the first quarter of 2021 compared to a peer median of 0.27%* Low operating cost of 14 branches should reduce HBNC’s already low efficiency ratio of Low-Cost Operations 57.03% and annualized OpEx-to-average-assets ratio of 2.20% Acquiring mortgage, consumer and small business loans at a 3.5% discount Performing Loans Expected to exceed 17% accretion to 2022 EPS Highly Accretive TBV dilution of 5.0% with an earnback of approximately two years Modest TBV Dilution Exceeds HBNC hurdle rates including approximately 21% internal rate of return Strong IRR Very productive deployment of excess holding-company capital and $60.0 million of cash Deploying Capital down-streamed to the bank, with no external capital raise required for this transaction Adds mass and scale in Midland and provides entry to other attractive markets in the Complementary Markets northern and central regions of Michigan’s lower peninsula th th Michigan branch transaction will be HBNC’s 15 acquisition since ‘02 and 5 since ’17, and Proven Integrator the company continues to evaluate additional M&A opportunities Closing by the end of 3Q21, subject to regulatory approval and customary closing conditions and adjustments; conservative attrition assumptions given industry-wide surge in deposits Key Assumptions from federal stimulus funding, in addition to normal runoff; and approximately $2M in pre-tax non-recurring transaction-related expenses * HBNC data as of 1Q21. Peer medians for U.S. commercial banks with $3B-$7B in assets, according to most-recent quarter data available from S&P Global Market Intelligence. ® 3 E X C E P T I O N A L S E R V I C E • S E N S I B L E A D V I C E

Logical Market Extension Charlevoix Otsego 14 Branches in 11 Counties WISCONSIN Crawford Logical extension of Horizon’s low-cost core deposit franchise Wexford in Michigan to further enhance already low-cost funding Roscommon Missaukee capability to support overall growth Arenac MICHIGAN Mecosta Arenac County Newaygo County Midland Newaygo Shiawassee Charlevoix County Otsego County Crawford County Roscommon County Current Mecosta County Shiawassee County Footprint Midland County Wexford County Missaukee County OHIO ILLINOIS Branches to be Acquired Current Footprint 0.08% >10 years Av. Deposit Cost Av. Deposit Account Tenure INDIANA Familiar and respected local competitor with culture of commitment to longstanding community banking relationships with their neighbors KENTUCKY ® ® 4 4 E E X X C C E E P P T T II O O N N A A L L S S E E R R V V II C C E E • • S S E E N N S S II B B L L E E A A D D V V II C C E E Logical Market Extension Charlevoix Otsego 14 Branches in 11 Counties WISCONSIN Crawford Logical extension of Horizon’s low-cost core deposit franchise Wexford in Michigan to further enhance already low-cost funding Roscommon Missaukee capability to support overall growth Arenac MICHIGAN Mecosta Arenac County Newaygo County Midland Newaygo Shiawassee Charlevoix County Otsego County Crawford County Roscommon County Current Mecosta County Shiawassee County Footprint Midland County Wexford County Missaukee County OHIO ILLINOIS Branches to be Acquired Current Footprint 0.08% >10 years Av. Deposit Cost Av. Deposit Account Tenure INDIANA Familiar and respected local competitor with culture of commitment to longstanding community banking relationships with their neighbors KENTUCKY ® ® 4 4 E E X X C C E E P P T T II O O N N A A L L S S E E R R V V II C C E E • • S S E E N N S S II B B L L E E A A D D V V II C C E E

Acquiring 14 Branches in 11 Counties Deal takes Michigan up to 35% of deposits and 45% of loans* Average Branch Size of $69 Million Arenac County Newaygo County • 220 S. Main Street, Standish • 211 West Main Street., Fremont • 144 W. Huron Road, Au Gres Otsego County Charlevoix County • 521 W. Main Street, Gaylord • 1425 Bridge Street, Charlevoix Roscommon County Crawford County • 7409 W. Houghton Lake Drive, Houghton Lake • 2500 S I-75 Business Loop, Grayling Shiawassee County Mecosta County • 310 N. Shiawassee Street, Corunna • 125 N. Michigan Ave., Big Rapids • 1345 E. M21, Owosso Midland County Wexford County • 2910 Jefferson Ave., Midland • 1408 N. Mitchell Street, Cadillac • 302 S. Mitchell Street, Cadillac Missaukee County • 101 N. Roland Street, McBain * Pro forma total company deposits and loans based on Michigan balances at HBNC and branches to be acquired on 3/31/2021. ® 5 E X C E P T I O N A L S E R V I C E • S E N S I B L E A D V I C E Acquiring 14 Branches in 11 Counties Deal takes Michigan up to 35% of deposits and 45% of loans* Average Branch Size of $69 Million Arenac County Newaygo County • 220 S. Main Street, Standish • 211 West Main Street., Fremont • 144 W. Huron Road, Au Gres Otsego County Charlevoix County • 521 W. Main Street, Gaylord • 1425 Bridge Street, Charlevoix Roscommon County Crawford County • 7409 W. Houghton Lake Drive, Houghton Lake • 2500 S I-75 Business Loop, Grayling Shiawassee County Mecosta County • 310 N. Shiawassee Street, Corunna • 125 N. Michigan Ave., Big Rapids • 1345 E. M21, Owosso Midland County Wexford County • 2910 Jefferson Ave., Midland • 1408 N. Mitchell Street, Cadillac • 302 S. Mitchell Street, Cadillac Missaukee County • 101 N. Roland Street, McBain * Pro forma total company deposits and loans based on Michigan balances at HBNC and branches to be acquired on 3/31/2021. ® 5 E X C E P T I O N A L S E R V I C E • S E N S I B L E A D V I C E

Experienced and Successful Integrator th Branch transaction will be the bank’s 15 acquisition since ‘02 Experienced internal operations and integration team Three bank owned and operated call centers to be fully staffed and open extended hours to support integration 2014 - 2021 st • 1 Mtg. • Bargersville All 14 acquired branches will open as Horizon Bank locations at • Summit • Lafayette close • Peoples • Wolverine Deposit customers of acquired branches will continue to be served • Farmers • Salin the by same employees they know and trust, with the full workforce offered Horizon Bank positions • LaPorte • 14 MI branches (pending) • CNB Mentors assigned to each office to assist with post data processing $5.9 6.00 80 questions $5.2 70 Treasury management one on one contact with municipalities to 5.00 $68 assist with conversion $67 $4.2 60 $4.0 2008 - 2013 4.00 50 $53 • American Trust $3.1 2002 - 2007 3.00 40 $2.7 • Heartland • Anchor Mortgage Bancshares $2.1 30 $1.8 $33 $1.8 2.00 • Alliance Financial $1.5 $1.4 $1.4 $1.3 $1.3 $1.2 20 $1.1 $24 $0.9 $21 $20 $20 $0.8 1.00 $0.7 $18 10 $13 $10 $9 $9 $8 $5 $7 $7 $7 $7 - - 2002 2003 2004 2005 2006 2007 2008 2009 2010 2011 2012 2013 2014 2015 2016 2017 2018 2019 2020 Total Assets ($B) Net Income ($M) ® 6 E X C E P T I O N A L S E R V I C E • S E N S I B L E A D V I C E Experienced and Successful Integrator th Branch transaction will be the bank’s 15 acquisition since ‘02 Experienced internal operations and integration team Three bank owned and operated call centers to be fully staffed and open extended hours to support integration 2014 - 2021 st • 1 Mtg. • Bargersville All 14 acquired branches will open as Horizon Bank locations at • Summit • Lafayette close • Peoples • Wolverine Deposit customers of acquired branches will continue to be served • Farmers • Salin the by same employees they know and trust, with the full workforce offered Horizon Bank positions • LaPorte • 14 MI branches (pending) • CNB Mentors assigned to each office to assist with post data processing $5.9 6.00 80 questions $5.2 70 Treasury management one on one contact with municipalities to 5.00 $68 assist with conversion $67 $4.2 60 $4.0 2008 - 2013 4.00 50 $53 • American Trust $3.1 2002 - 2007 3.00 40 $2.7 • Heartland • Anchor Mortgage Bancshares $2.1 30 $1.8 $33 $1.8 2.00 • Alliance Financial $1.5 $1.4 $1.4 $1.3 $1.3 $1.2 20 $1.1 $24 $0.9 $21 $20 $20 $0.8 1.00 $0.7 $18 10 $13 $10 $9 $9 $8 $5 $7 $7 $7 $7 - - 2002 2003 2004 2005 2006 2007 2008 2009 2010 2011 2012 2013 2014 2015 2016 2017 2018 2019 2020 Total Assets ($B) Net Income ($M) ® 6 E X C E P T I O N A L S E R V I C E • S E N S I B L E A D V I C E
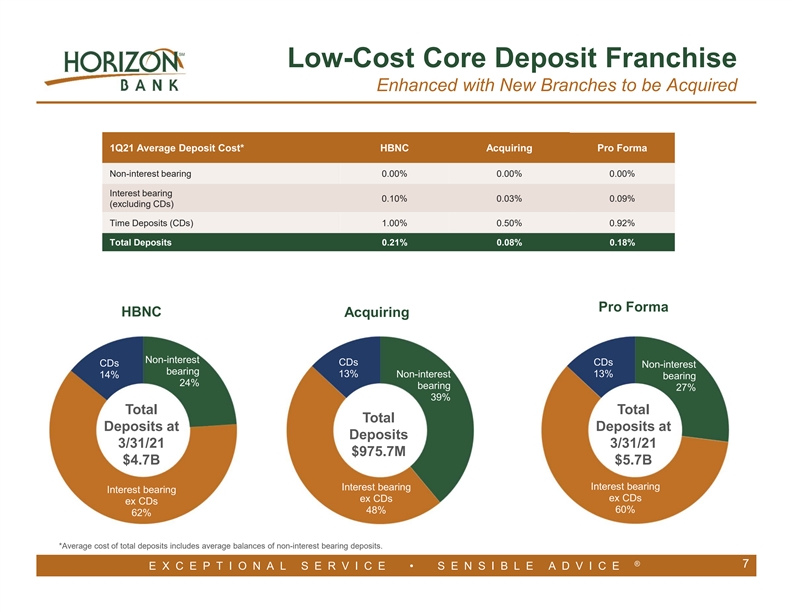
Low-Cost Core Deposit Franchise Enhanced with New Branches to be Acquired 1Q21 Average Deposit Cost* HBNC Acquiring Pro Forma Non-interest bearing 0.00% 0.00% 0.00% Interest bearing 0.10% 0.03% 0.09% (excluding CDs) Time Deposits (CDs) 1.00% 0.50% 0.92% Total Deposits 0.21% 0.08% 0.18% Pro Forma HBNC Acquiring Non-interest CDs CDs CDs Non-interest bearing 13% 13% 14% Non-interest bearing 24% bearing 27% 39% Total Total Total Deposits at Deposits at Deposits 3/31/21 3/31/21 $975.7M $4.7B $5.7B Interest bearing Interest bearing Interest bearing ex CDs ex CDs ex CDs 48% 60% 62% *Average cost of total deposits includes average balances of non-interest bearing deposits. ® 7 E X C E P T I O N A L S E R V I C E • S E N S I B L E A D V I C E Low-Cost Core Deposit Franchise Enhanced with New Branches to be Acquired 1Q21 Average Deposit Cost* HBNC Acquiring Pro Forma Non-interest bearing 0.00% 0.00% 0.00% Interest bearing 0.10% 0.03% 0.09% (excluding CDs) Time Deposits (CDs) 1.00% 0.50% 0.92% Total Deposits 0.21% 0.08% 0.18% Pro Forma HBNC Acquiring Non-interest CDs CDs CDs Non-interest bearing 13% 13% 14% Non-interest bearing 24% bearing 27% 39% Total Total Total Deposits at Deposits at Deposits 3/31/21 3/31/21 $975.7M $4.7B $5.7B Interest bearing Interest bearing Interest bearing ex CDs ex CDs ex CDs 48% 60% 62% *Average cost of total deposits includes average balances of non-interest bearing deposits. ® 7 E X C E P T I O N A L S E R V I C E • S E N S I B L E A D V I C E

Mortgage, Consumer & Small Biz Loans Completed extensive due diligence on performing portfolio 1Q21 Average Yield HBNC Acquiring Pro Forma Total Loans 4.39% 4.22% 4.38% HBNC Pro Forma Mortgage Mortgage Held For Sale, Held For Sale, Warehouse, Warehouse, 0% 0% 7% 7% Acquiring Consumer, Consumer, 18% 18% Mortgage Total Gross Held For Sale, Warehouse, 0% Loans at 0% Loans at 3/31/21 3/31/21 Resi Resi $4.0B $3.7B Mortgage, Mortgage, 16% 17% Consumer, Commercial, Commercial, 26% 58% 59% Total Loans $278.2M Resi Commercial, Mortgage, 46% 28% ® 8 E X C E P T I O N A L S E R V I C E • S E N S I B L E A D V I C E Mortgage, Consumer & Small Biz Loans Completed extensive due diligence on performing portfolio 1Q21 Average Yield HBNC Acquiring Pro Forma Total Loans 4.39% 4.22% 4.38% HBNC Pro Forma Mortgage Mortgage Held For Sale, Held For Sale, Warehouse, Warehouse, 0% 0% 7% 7% Acquiring Consumer, Consumer, 18% 18% Mortgage Total Gross Held For Sale, Warehouse, 0% Loans at 0% Loans at 3/31/21 3/31/21 Resi Resi $4.0B $3.7B Mortgage, Mortgage, 16% 17% Consumer, Commercial, Commercial, 26% 58% 59% Total Loans $278.2M Resi Commercial, Mortgage, 46% 28% ® 8 E X C E P T I O N A L S E R V I C E • S E N S I B L E A D V I C E
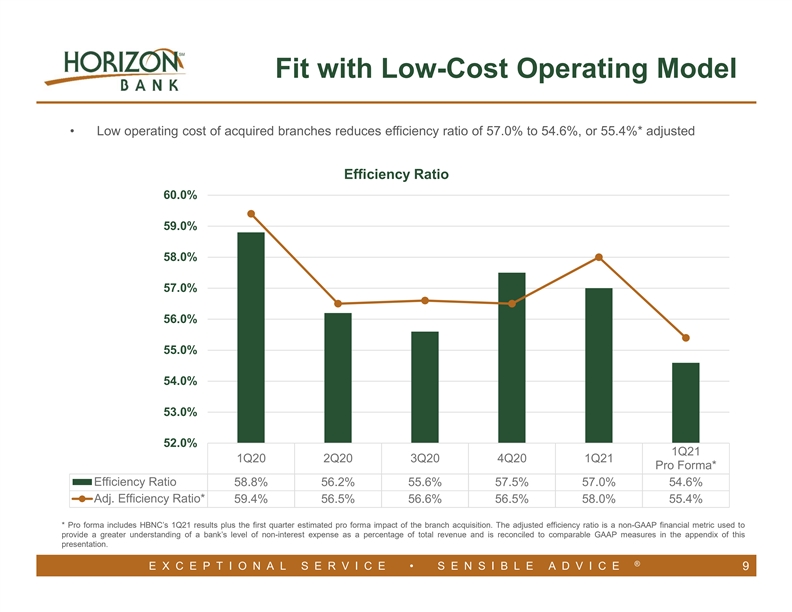
Fit with Low-Cost Operating Model • Low operating cost of acquired branches reduces efficiency ratio of 57.0% to 54.6%, or 55.4%* adjusted Efficiency Ratio 60.0% 59.0% 58.0% 57.0% 56.0% 55.0% 54.0% 53.0% 52.0% 1Q21 1Q20 2Q20 3Q20 4Q20 1Q21 Pro Forma* Efficiency Ratio 58.8% 56.2% 55.6% 57.5% 57.0% 54.6% Adj. Efficiency Ratio* 59.4% 56.5% 56.6% 56.5% 58.0% 55.4% * Pro forma includes HBNC’s 1Q21 results plus the first quarter estimated pro forma impact of the branch acquisition. The adjusted efficiency ratio is a non-GAAP financial metric used to provide a greater understanding of a bank’s level of non-interest expense as a percentage of total revenue and is reconciled to comparable GAAP measures in the appendix of this presentation. ® E X C E P T I O N A L S E R V I C E • S E N S I B L E A D V I C E 9Fit with Low-Cost Operating Model • Low operating cost of acquired branches reduces efficiency ratio of 57.0% to 54.6%, or 55.4%* adjusted Efficiency Ratio 60.0% 59.0% 58.0% 57.0% 56.0% 55.0% 54.0% 53.0% 52.0% 1Q21 1Q20 2Q20 3Q20 4Q20 1Q21 Pro Forma* Efficiency Ratio 58.8% 56.2% 55.6% 57.5% 57.0% 54.6% Adj. Efficiency Ratio* 59.4% 56.5% 56.6% 56.5% 58.0% 55.4% * Pro forma includes HBNC’s 1Q21 results plus the first quarter estimated pro forma impact of the branch acquisition. The adjusted efficiency ratio is a non-GAAP financial metric used to provide a greater understanding of a bank’s level of non-interest expense as a percentage of total revenue and is reconciled to comparable GAAP measures in the appendix of this presentation. ® E X C E P T I O N A L S E R V I C E • S E N S I B L E A D V I C E 9

Bank and Holding Company Capital Impact of Deal • $60.0 million in Holding Company cash down-streamed to the Bank • Projected earnings would increase Holding Company TCE/TA ratio to 8%* by the middle of 2022 Holding Company Capital Ratios Total Capital Ratio (%) TCE / TA (%)* Leverage Ratio (%) Tier 1 Ratio (%) 16.9 15.8 % 14.9 % 13.8 % % 10.8 8.8% % 8.9% 7.3% 1Q21 Pro-Forma 2Q21 1Q21 Pro-Forma 2Q21 1Q21 Pro-Forma 2Q21 1Q21 Pro-Forma 2Q21 Bank Capital Ratios TCE / TA (%)* Total Capital Ratio (%) Leverage Ratio (%) Tier 1 Ratio (%) 13.9 13.5 12.7 12.5 % % % % 8.8% 8.6% 8.0% 8.0% 1Q21 Pro-Forma 2Q21 1Q21 Pro-Forma 2Q21 1Q21 Pro-Forma 2Q21 1Q21 Pro-Forma 2Q21 * The tangible common equity (TCE) ratio is a non-GAAP metric utilized to provide a greater understanding of the capital adequacy of financial services companies and is reconciled to comparable GAAP measures in the appendix of this presentation. ® 10 E X C E P T I O N A L S E R V I C E • S E N S I B L E A D V I C E Bank and Holding Company Capital Impact of Deal • $60.0 million in Holding Company cash down-streamed to the Bank • Projected earnings would increase Holding Company TCE/TA ratio to 8%* by the middle of 2022 Holding Company Capital Ratios Total Capital Ratio (%) TCE / TA (%)* Leverage Ratio (%) Tier 1 Ratio (%) 16.9 15.8 % 14.9 % 13.8 % % 10.8 8.8% % 8.9% 7.3% 1Q21 Pro-Forma 2Q21 1Q21 Pro-Forma 2Q21 1Q21 Pro-Forma 2Q21 1Q21 Pro-Forma 2Q21 Bank Capital Ratios TCE / TA (%)* Total Capital Ratio (%) Leverage Ratio (%) Tier 1 Ratio (%) 13.9 13.5 12.7 12.5 % % % % 8.8% 8.6% 8.0% 8.0% 1Q21 Pro-Forma 2Q21 1Q21 Pro-Forma 2Q21 1Q21 Pro-Forma 2Q21 1Q21 Pro-Forma 2Q21 * The tangible common equity (TCE) ratio is a non-GAAP metric utilized to provide a greater understanding of the capital adequacy of financial services companies and is reconciled to comparable GAAP measures in the appendix of this presentation. ® 10 E X C E P T I O N A L S E R V I C E • S E N S I B L E A D V I C E

Accretion Upside of Liquidity Deployment • Expected to be 17.1% accretive to EPS in 2022, the first full year after closing, with conservative assumptions including ~5.0% loan growth and ~18% deposit runoff/ attrition from close until year end 2022 • Excess liquidity deployed into securities with an average yield of 1.50% • Additional EPS upside potential as securities are redeployed into loans (illustrated below) 38.0% 32.1% 33.0% 28.0% 23.0% 17.1% 18.0% 13.0% Anticipated Future Loan Yield on Securities Production 8.0% 0.00% 0.50% 1.00% 1.50% 2.00% 2.50% 3.00% 3.50% 4.00% Yield on Securities Note: Chart is for illustrative purposes only. Actual accretion will be dependent upon timing of liquidity deployment, loan mix and yields. ® 11 E X C E P T I O N A L S E R V I C E • S E N S I B L E A D V I C E 2022 EPS AccretionAccretion Upside of Liquidity Deployment • Expected to be 17.1% accretive to EPS in 2022, the first full year after closing, with conservative assumptions including ~5.0% loan growth and ~18% deposit runoff/ attrition from close until year end 2022 • Excess liquidity deployed into securities with an average yield of 1.50% • Additional EPS upside potential as securities are redeployed into loans (illustrated below) 38.0% 32.1% 33.0% 28.0% 23.0% 17.1% 18.0% 13.0% Anticipated Future Loan Yield on Securities Production 8.0% 0.00% 0.50% 1.00% 1.50% 2.00% 2.50% 3.00% 3.50% 4.00% Yield on Securities Note: Chart is for illustrative purposes only. Actual accretion will be dependent upon timing of liquidity deployment, loan mix and yields. ® 11 E X C E P T I O N A L S E R V I C E • S E N S I B L E A D V I C E 2022 EPS Accretion
Appendix ® 12 E X C E P T I O N A L S E R V I C E • S E N S I B L E A D V I C E Appendix ® 12 E X C E P T I O N A L S E R V I C E • S E N S I B L E A D V I C E

Footnote Index Slides 14-16 Use of Non-GAAP Financial Measures • Certain information set forth in the presentation materials refers to financial measures determined by methods other than in accordance with GAAP. Horizon believes these non-GAAP financial measures are helpful to investors and provide a greater understanding of our business without giving effect to purchase accounting impacts, one-time acquisition and other non-recurring costs and non-core items. These measures are not necessarily comparable to similar measures that may be presented by other companies and should not be considered in isolation or as a substitute for the related GAAP measure. ® 13 E X C E P T I O N A L S E R V I C E • S E N S I B L E A D V I C E Footnote Index Slides 14-16 Use of Non-GAAP Financial Measures • Certain information set forth in the presentation materials refers to financial measures determined by methods other than in accordance with GAAP. Horizon believes these non-GAAP financial measures are helpful to investors and provide a greater understanding of our business without giving effect to purchase accounting impacts, one-time acquisition and other non-recurring costs and non-core items. These measures are not necessarily comparable to similar measures that may be presented by other companies and should not be considered in isolation or as a substitute for the related GAAP measure. ® 13 E X C E P T I O N A L S E R V I C E • S E N S I B L E A D V I C E

Footnote Index Three Months Ended March 31, December 31, 2021 2020 Total deposit interest expense as reported $ 2,343 $ 2,718 Average interest bearing deposits 3,524,103 3,450,824 Annualized total deposit interest expense as a percentage of average interest bearing deposits ( Cost of Interest Bearing 0.27% 0.31% Deposits ) Average interest bearing deposits 3,524,103 3,450,824 Average non-interest bearing deposits 1,063,268 1,037,232 Average total deposits $ 4,587,371 $ 4,488,056 Annualzied deposit interest expense as a percentage of average 0.21% 0.24% total deposits ( Cost of Total Deposits ) ® 14 E X C E P T I O N A L S E R V I C E • S E N S I B L E A D V I C E Footnote Index Three Months Ended March 31, December 31, 2021 2020 Total deposit interest expense as reported $ 2,343 $ 2,718 Average interest bearing deposits 3,524,103 3,450,824 Annualized total deposit interest expense as a percentage of average interest bearing deposits ( Cost of Interest Bearing 0.27% 0.31% Deposits ) Average interest bearing deposits 3,524,103 3,450,824 Average non-interest bearing deposits 1,063,268 1,037,232 Average total deposits $ 4,587,371 $ 4,488,056 Annualzied deposit interest expense as a percentage of average 0.21% 0.24% total deposits ( Cost of Total Deposits ) ® 14 E X C E P T I O N A L S E R V I C E • S E N S I B L E A D V I C E
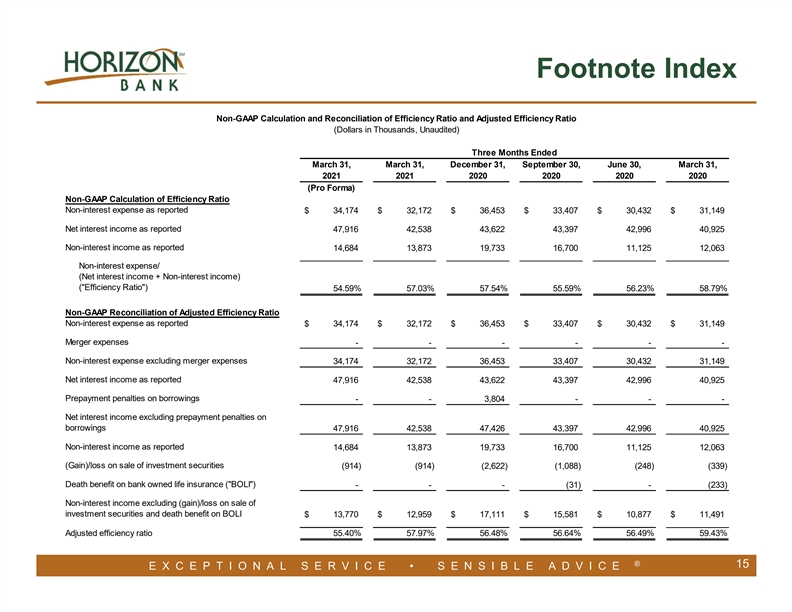
Footnote Index Non-GAAP Calculation and Reconciliation of Efficiency Ratio and Adjusted Efficiency Ratio (Dollars in Thousands, Unaudited) Three Months Ended March 31, March 31, December 31, September 30, June 30, March 31, 2021 2021 2020 2020 2020 2020 (Pro Forma) Non-GAAP Calculation of Efficiency Ratio Non-interest expense as reported $ 34,174 $ 32,172 $ 36,453 $ 33,407 $ 30,432 $ 31,149 Net interest income as reported 47,916 42,538 43,622 43,397 42,996 40,925 Non-interest income as reported 14,684 13,873 19,733 16,700 11,125 12,063 Non-interest expense/ (Net interest income + Non-interest income) ( Efficiency Ratio ) 54.59% 57.03% 57.54% 55.59% 56.23% 58.79% Non-GAAP Reconciliation of Adjusted Efficiency Ratio Non-interest expense as reported $ 34,174 $ 32,172 $ 36,453 $ 33,407 $ 30,432 $ 31,149 Merger expenses - - - - - - Non-interest expense excluding merger expenses 34,174 32,172 36,453 33,407 30,432 31,149 Net interest income as reported 47,916 42,538 43,622 43,397 42,996 40,925 Prepayment penalties on borrowings - - 3,804 - - - Net interest income excluding prepayment penalties on borrowings 47,916 42,538 47,426 43,397 42,996 40,925 Non-interest income as reported 14,684 13,873 19,733 16,700 11,125 12,063 (Gain)/loss on sale of investment securities (914) (914) (2,622) (1,088) (248) (339) Death benefit on bank owned life insurance ( BOLI ) - - - (31) - (233) Non-interest income excluding (gain)/loss on sale of investment securities and death benefit on BOLI $ 13,770 $ 12,959 $ 17,111 $ 15,581 $ 10,877 $ 11,491 Adjusted efficiency ratio 55.40% 57.97% 56.48% 56.64% 56.49% 59.43% ® 15 E X C E P T I O N A L S E R V I C E • S E N S I B L E A D V I C E Footnote Index Non-GAAP Calculation and Reconciliation of Efficiency Ratio and Adjusted Efficiency Ratio (Dollars in Thousands, Unaudited) Three Months Ended March 31, March 31, December 31, September 30, June 30, March 31, 2021 2021 2020 2020 2020 2020 (Pro Forma) Non-GAAP Calculation of Efficiency Ratio Non-interest expense as reported $ 34,174 $ 32,172 $ 36,453 $ 33,407 $ 30,432 $ 31,149 Net interest income as reported 47,916 42,538 43,622 43,397 42,996 40,925 Non-interest income as reported 14,684 13,873 19,733 16,700 11,125 12,063 Non-interest expense/ (Net interest income + Non-interest income) ( Efficiency Ratio ) 54.59% 57.03% 57.54% 55.59% 56.23% 58.79% Non-GAAP Reconciliation of Adjusted Efficiency Ratio Non-interest expense as reported $ 34,174 $ 32,172 $ 36,453 $ 33,407 $ 30,432 $ 31,149 Merger expenses - - - - - - Non-interest expense excluding merger expenses 34,174 32,172 36,453 33,407 30,432 31,149 Net interest income as reported 47,916 42,538 43,622 43,397 42,996 40,925 Prepayment penalties on borrowings - - 3,804 - - - Net interest income excluding prepayment penalties on borrowings 47,916 42,538 47,426 43,397 42,996 40,925 Non-interest income as reported 14,684 13,873 19,733 16,700 11,125 12,063 (Gain)/loss on sale of investment securities (914) (914) (2,622) (1,088) (248) (339) Death benefit on bank owned life insurance ( BOLI ) - - - (31) - (233) Non-interest income excluding (gain)/loss on sale of investment securities and death benefit on BOLI $ 13,770 $ 12,959 $ 17,111 $ 15,581 $ 10,877 $ 11,491 Adjusted efficiency ratio 55.40% 57.97% 56.48% 56.64% 56.49% 59.43% ® 15 E X C E P T I O N A L S E R V I C E • S E N S I B L E A D V I C E

Footnote Index Non-GAAP Reconciliation of Tangible Common Equity to Tangible Assets Ratio (Dollars in Thousands, Unaudited) Holding Company Bank June 30, March 31, June 30, March 31, 2021 2021 2021 2021 (Pro Forma) (Pro Forma) Tangible Common Equity Total stockholders' equity $ 697,946 $ 689,379 $ 746,784 $ 678,217 Less: Intangible assets 196,125 173,296 196,125 173,296 Total tangible common equity 501,821 516,083 550,659 504,921 Tangible Assets Total assets $ 7,066,904 $ 6,055,528 $ 7,046,951 $ 6,035,575 Less: Intangible assets 196,125 173,296 196,125 173,296 Total tangible assets 6,870,779 5,882,232 6,850,826 5,862,279 Tangible Common Equity to Tangible Assets Ratio Tangible common equity / tangible assets 7.3% 8.8% 8.0% 8.6% ® 16 E X C E P T I O N A L S E R V I C E • S E N S I B L E A D V I C E Footnote Index Non-GAAP Reconciliation of Tangible Common Equity to Tangible Assets Ratio (Dollars in Thousands, Unaudited) Holding Company Bank June 30, March 31, June 30, March 31, 2021 2021 2021 2021 (Pro Forma) (Pro Forma) Tangible Common Equity Total stockholders' equity $ 697,946 $ 689,379 $ 746,784 $ 678,217 Less: Intangible assets 196,125 173,296 196,125 173,296 Total tangible common equity 501,821 516,083 550,659 504,921 Tangible Assets Total assets $ 7,066,904 $ 6,055,528 $ 7,046,951 $ 6,035,575 Less: Intangible assets 196,125 173,296 196,125 173,296 Total tangible assets 6,870,779 5,882,232 6,850,826 5,862,279 Tangible Common Equity to Tangible Assets Ratio Tangible common equity / tangible assets 7.3% 8.8% 8.0% 8.6% ® 16 E X C E P T I O N A L S E R V I C E • S E N S I B L E A D V I C E