Attached files
| file | filename |
|---|---|
| 8-K - 8-K - Thryv Holdings, Inc. | brhc10025034_8k.htm |
Exhibit 99.1

Supplemental Presentation May 2021
Safe Harbor Statement 2 This Presentation may include certain forward-looking statements, including,
without limitation, statements concerning the conditions of our industry and our operations, performance, and financial condition, including, in particular, statements relating to our business, growth strategies, product development efforts,
and future expenses. Forward-looking statements can be identified by words such as ‘‘anticipates,’’ ‘‘intends,’’ ‘‘plans,’’ ‘‘seeks,’’ ‘‘believes,’’ ‘‘estimates,’’ ‘‘expects,’’ and similar references to future periods, or by the inclusion of
forecasts or projections. Forward-looking statements are based on our current expectations and assumptions regarding our business, the economy, and other future conditions. Because forward-looking statements relate to the future, by their
nature, they are subject to inherent uncertainties and risks (some of which are beyond our control) and changes in circumstances or other assumptions that may cause actual results or performance to be materially different from those expressed
or implied by these forward-looking statements. As a result, our actual results may differ materially from those contemplated by the forward-looking statements. Except as required by law, we are under no obligation to, and expressly disclaim
any obligation to, update or alter any forward-looking statements whether as a result of any such changes, new information, subsequent events or otherwise.Market data and industry information used throughout this Presentation are based on
management’s knowledge of the industry and the good faith estimates of management. We also relied, to the extent available, upon management’s review of independent industry surveys and publications and other publicly available information
prepared by a number of third party sources. All of the market data and industry information used in this Presentation involves a number of assumptions and limitations, and you are cautioned not to give undue weight to such estimates. Although
we believe that these sources are reliable, we cannot guarantee the accuracy or completeness of this information, and we have not independently verified this information. While we believe the estimated market position, market opportunity and
market size information included in this presentation are generally reliable, such information, which is derived in part from management’s estimates and beliefs, is inherently uncertain and imprecise. Projections, assumptions and estimates of
our future performance and the future performance of the industry in which we operate are necessarily subject to a high degree of uncertainty and risk due to a variety of factors. These factors could cause results to differ materially from
those expressed in our estimates and beliefs and in the estimates prepared by independent parties. You should not construe the contents of this Presentation as legal, tax, accounting or investment advice or a recommendation to take (or refrain
from taking) any particular action. You should consult your own counsel and tax and financial advisors as to legal and related matters concerning the matters described herein.In addition to financial measures prepared in accordance with U.S.
generally accepted accounting principles (“GAAP”), this Presentation contains non-GAAP financial measures. We present non-GAAP measures including: EBITDA, adjusted EBITDA, and adjusted EBITDA margin. The non-GAAP financial information is
presented for supplemental informational purposes only and is not intended to be considered in isolation or as a substitute for, or superior to, financial information prepared and presented in accordance with GAAP. Please refer to the appendix
to this Presentation for reconciliations of the non-GAAP financial measures used in this Presentation to the most comparable GAAP financial measures.We believe that these non-GAAP financial measures provide useful information about our
financial performance, enhance the overall understanding of our past performance and future prospects and allow for greater transparency with respect to important metrics used by our management for financial and operational decision-making. We
believe that these measures provide an additional tool for investors to use in comparing our core financial performance over multiple periods with other companies in our industry. However, it is important to note that the particular items we
exclude from, or include in, our non-GAAP financial measures may differ from the items excluded from, or included in, similar non-GAAP financial measures used by other companies in the same industry.

Today’s Presenters 3 Joe WalshChief Executive Officer Paul RouseChief Financial Officer Proven Track
Record Ryan CantorVice President of Product & Marketing Leadership team with decades of experience working with SMBs and each other Transformed Yellowbook (now Hibu) from a small telephone directory publisher to nation’s premier
provider of SMB solutions Led turn around of Cambium, an educational technology company, increasing share price rising from ~$0.70 to greater than $14.50 Rapidly grew Thryv’s SaaS annual net revenue from inception to ~$130 million in less
than five years Successfully integrated YP Holdings and increased company’s EBITDA margins by ~20 points

Amer Akhtar Bonnie Kintzer Jason Mudrick Ryan O’Hara John Slater Lauren
Vaccarello Joe Walsh Heather Zynczak 4 NextSet Software Board Of Directors New board brings deep expertise in technology and SaaS

Company Overview 5 $364mmLTM Adj. EBITDA1,2,3 ~1,000Sales Related Employees
Globally ~2,700Employees Globally $1.1bnLTM Revenue2,3 $158mmLTM Net Income2,3 400,000+Clients Globally Thryv Snapshot Adjusted EBITDA and Adjusted EBITDA Margin are non-GAAP measures. See reconciliation in the Appendix2. Last
Twelve Months as of March 20213. Includes Sensis contribution subsequent the acquisition date of March 1, 2021 $304Q1-21 ARPU 89%Net DollarRetention Rate $135mmLTM Revenue2 8%LTM SegmentEBITDA Margin1,2 17%Q1-21 YoYRevenue
Growth ~44,500Clients SaaS Snapshot Coast-to-Coast Footprint International ExpansionStarting in
Australia SaaSEnd-to-end
client experience management software Marketing ServicesLead generation tools and portfolio of search-based marketing solutions Leading provider of local SMB management software and marketing services solutions

6 Key Investment Highlights Experienced management team with proven track record of execution
1 Large and growing TAM with favorable tailwinds 2 Complete end-to-end SaaS platform for SMBs 3 SaaS business with tremendous growth opportunities 4 Marketing Services business provides captive customer base and growth capital for
SaaS business 5

Complete Solutions to Address SMB Pain Points 7 Customizable and verticalized CRM, scheduling &
appointments, automated follow-ups & reminders, document sharing & storage, mobile app 1 Stay Organized Stand-alone ThryvPay app, estimates & invoices, credit card & ACH processing, online & mobile payments, scheduled
payments, convenience fees & tipping, real time reporting 2 Get Paid 2-way text from business number, email & text announcements, automated campaigns & campaign analytics, centralized inbox communications 3 Communicate with
Customers Review generation, in-app review response, review acknowledgement service, review monitoring & alerts, competitor watch Generate More Reviews 5 4 Online listing management, professionally designed website, social media
posting & content library, custom videos Build Your Brand 6 24/7 service via phone, chat, email, online learning center, videos & in-app guides Service & Support Piecing together multiple point solutions can be costly and time
consuming
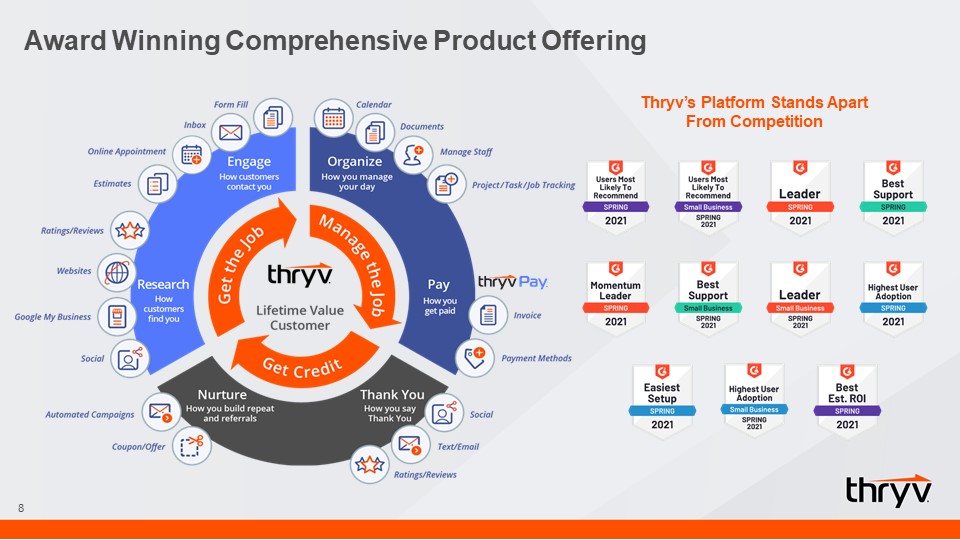
8 Award Winning Comprehensive Product Offering Thryv’s Platform Stands Apart From
Competition https://www.globenewswire.com/news-release/2021/04/06/2204881/0/en/Thryv-Named-G2-Leader-in-14-Categories-for-Spring-2021.html

9 50+ Employees 1 Employee 2-19 Employees 20-50 Employees $199-499/moPlus
add-ons1 Point Solutions And Other Free Apps Target Market (10mm) Enterprise Level SaaS Thryv End-to-End Client ExperienceOther Point & Vertical-Specific Solutions Total U.S. SMB Market: 30MM Note: Average pricing shown based on
Company estimates and pricing on company websites1. Add-ons range from $99 to $10,000+ Category Leader of an Early Stage but Rapidly Developing Market $1K+per month $100-$1,000per month <$100per month
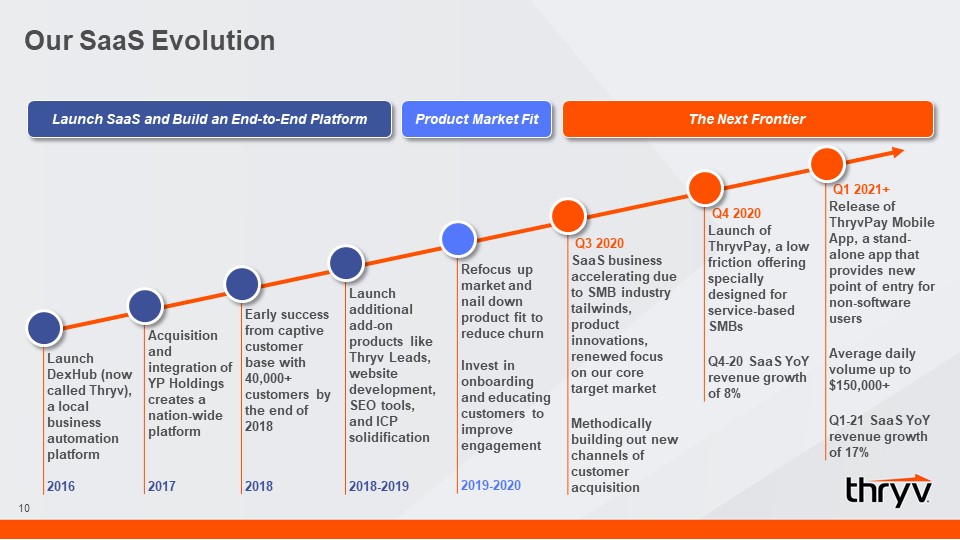
Our SaaS Evolution 10 Launch SaaS and Build an End-to-End Platform Product Market Fit The Next
Frontier Q3 2020SaaS business accelerating due to SMB industry tailwinds, product innovations, renewed focus on our core target marketMethodically building out new channels of customer acquisition Early success from
captive customer base with 40,000+ customers by the end of 20182018 Acquisition and integration of YP Holdings creates a nation-wide platform2017 Launch DexHub (now called Thryv), a local business automation platform2016 Refocus up market
and nail down product fit to reduce churn Invest in onboarding and educating customers to improve engagement2019-2020 Q4 2020Launch of ThryvPay, a low friction offering specially designed for service-based SMBsQ4-20 SaaS YoY revenue growth of
8% Launch additional add-on products like Thryv Leads, website development, SEO tools, and ICP solidification2018-2019 Q1 2021+Release of ThryvPay Mobile App, a stand-alone app that provides new point of entry for
non-software usersAverage daily volume up to $150,000+Q1-21 SaaS YoY revenue growth of 17%

Driving Customer Engagement 11 Quarterly NPS Continued to invest in education and engagement
growth Built and improved onboarding process to clearly identify the client’s purchase intent As a result, tremendous growth in engagement and driving up in app time User Frequency1 Average Time in App (in minutes) 1. Represents percent
of clients logging in at least 1-4 times per month % of clients

Attractive Growth Opportunities 12 ThryvPay and ThryvPay App Launch Broaden Offering to New
Verticals Verticalizing Product Offering Scale New Channels of Customer Acquisition Multiple actionable growth levers will continue to scale SaaS business Strategic M&A and International Expansion

Pandemic Tailwinds Accelerate SMB SaaS Software Adoption 13 30mmTotal U.S. SMB market 10mmThryv
Ideal ClientProfile TAM Ideal Client Profile: Service-based SMBs with 2-50 employees $3.0 billion TAM1 Estimated based on ARPU times 10 million2. Based on 2018 Tech Adoption Index projections

New Customer Acquisition Channels 14 InboundReferrals from existing customers Partner
NetworkMarketing partners, sales partners and resellers Franchise / Multi-LocationLong-term contracts with franchising organizations Medium-term target of 50% of new SaaS customers to come from new channels

Vertical Expansion Opportunity 15 Thryv now enables SMBs of all verticalsto track, and manage their
day-to-day work Integrated Vertical Platform tailors solutions to industry specifications, terminology and workflow Leverage third-party research to cater to the unique needsof its diversified customer base Initial horizontally-focused
platform more easily and effectively builds out enhancements for specific verticals Solutions capture key details: Thryv for Automotive maximizes appointments with side-by-side calendar views of bays and technicians Currently serves more than
20 different industries Enhanced CRM enables more diversified vertical reach Solutions capture key details: Thryv for Health Services tracks patient level information Solutions capture key details: Thryv for Legal can organize multiple cases
for the same client
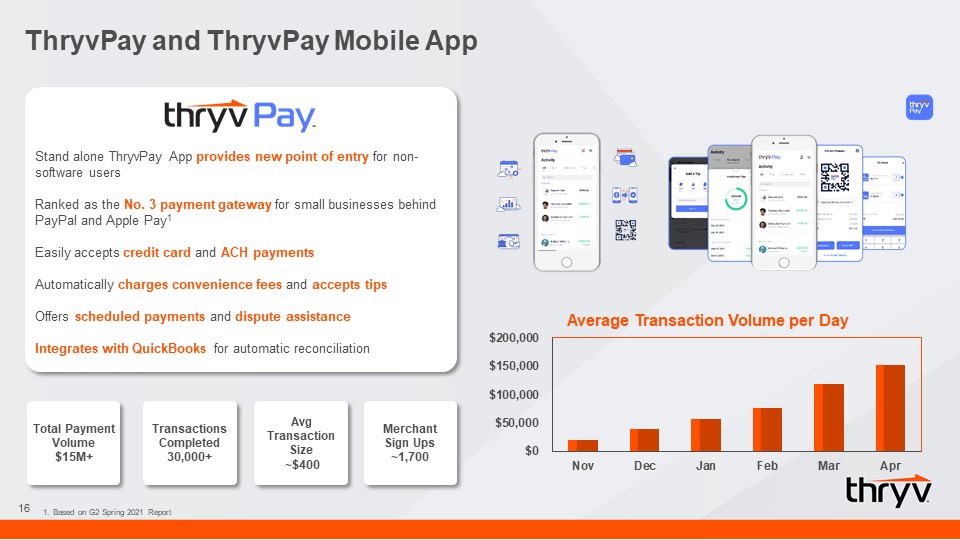
Stand alone ThryvPay App provides new point of entry for non-software usersRanked as the No. 3 payment
gateway for small businesses behind PayPal and Apple Pay1Easily accepts credit card and ACH paymentsAutomatically charges convenience fees and accepts tipsOffers scheduled payments and dispute assistanceIntegrates with QuickBooks for automatic
reconciliation 16 ThryvPay and ThryvPay Mobile App Avg Transaction Size ~$400 Merchant Sign Ups~1,700 Average Transaction Volume per Day Transactions Completed30,000+ Total Payment Volume$15M+ Based on G2 Spring 2021 Report
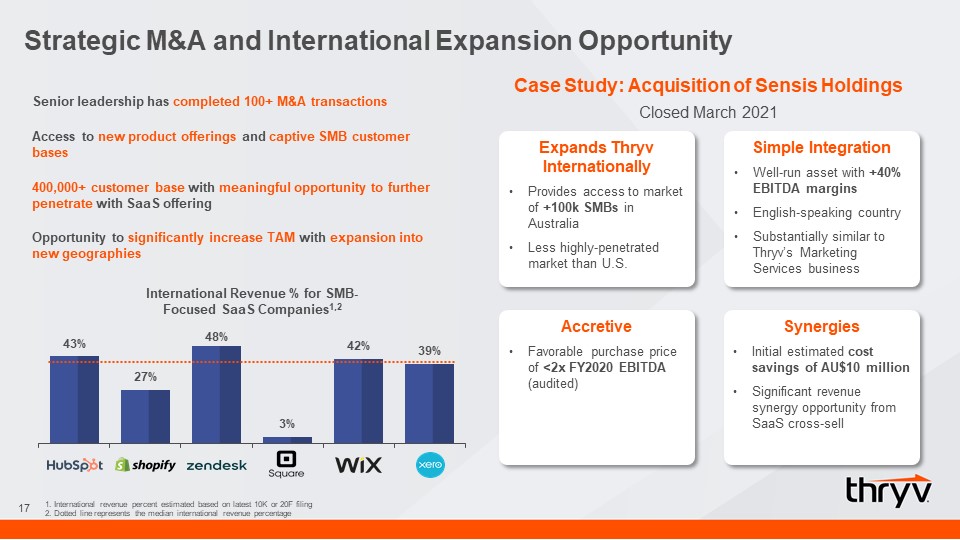
Strategic M&A and International Expansion Opportunity 17 Case Study: Acquisition of Sensis
HoldingsClosed March 2021 Expands Thryv InternationallyProvides access to market of +100k SMBs in AustraliaLess highly-penetrated market than U.S. Simple IntegrationWell-run asset with +40% EBITDA marginsEnglish-speaking
countrySubstantially similar to Thryv’s Marketing Services business AccretiveFavorable purchase price of <2x FY2020 EBITDA (audited) SynergiesInitial estimated cost savings of AU$10 millionSignificant revenue synergy opportunity from
SaaS cross-sell Senior leadership has completed 100+ M&A transactions Access to new product offerings and captive SMB customer bases 400,000+ customer base with meaningful opportunity to further penetrate with SaaS offering
Opportunity to significantly increase TAM with expansion into new geographies International Revenue % for SMB-Focused SaaS Companies1,2 1. International revenue percent estimated based on latest 10K or 20F filing2. Dotted line represents
the median international revenue percentage

High Cash Flow, Resilient Legacy Business 18 2nd COVID Wave 1st COVID Wave Fed Rate Hike / U.S.
China Trade Tension Marketing Services business exhibits predictable decline and is resilient to broader market swings High cash flow business that drives nearly $1 billion in revenue today with high EBITDA margins Note: Results do not
include contribution from Sensis Acquisition
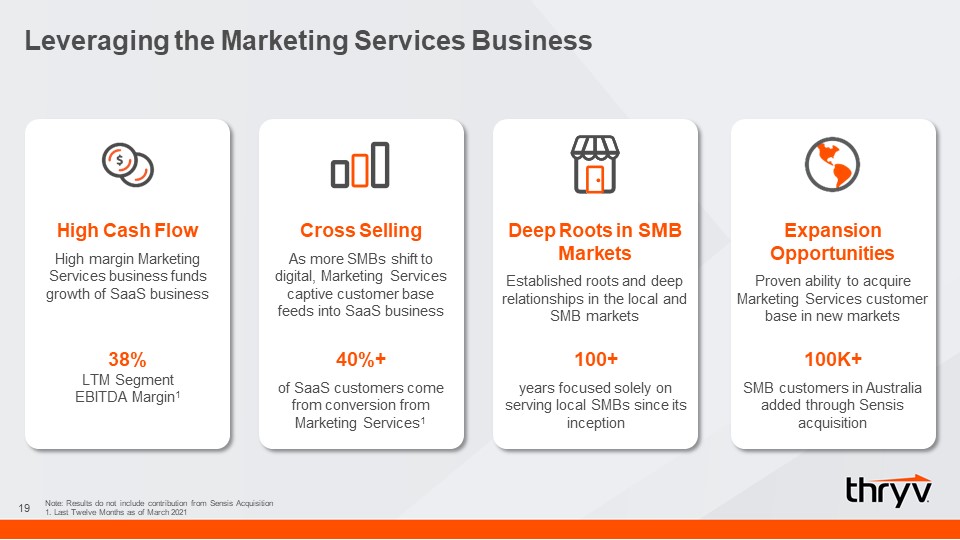
Leveraging the Marketing Services Business 19 High Cash FlowHigh margin Marketing Services business
funds growth of SaaS business Cross SellingAs more SMBs shift to digital, Marketing Services captive customer base feeds into SaaS business Deep Roots in SMB MarketsEstablished roots and deep relationships in the local and SMB
markets Expansion OpportunitiesProven ability to acquire Marketing Services customer base in new markets 38%LTM SegmentEBITDA Margin1 Note: Results do not include contribution from Sensis Acquisition1. Last Twelve Months as of March
2021 40%+of SaaS customers come from conversion from Marketing Services1 100+years focused solely on serving local SMBs since its inception 100K+SMB customers in Australia added through Sensis acquisition

20 EngagementContinue to educate clients on features and how to leverage capabilities within
platformExpand app marketplace and drive time in-app Drive Digital Adoption In SMB MarketAggressively sell Thryv via new channels as business environment recoversConvert “traditional” SMBsEfficiently and effectively onboard clients Sensis
Integration & SaaS LaunchConnect businessesPenetrate existing Sensis clients (on track for 2H 2021)Sign-up new clients (on track for 2H 2021) Capital AllocationAggressively paydown debt 2021 Priority Progress

Financial Highlights

22 SaaS LTM revenue shows continued scaling of the business1 Q1 2021 YoY SaaS revenue growth showing
business return to growth trajectory with renewed focus on core target market SaaS Segment EBITDA margins benefitting from scaling of operations1 Steady Marketing Services Segment EBITDA margins provide capital for accelerating SaaS
business1,3 Additional Marketing Services revenue from Sensis acquisition2 1. Last Twelve Months as of March 20212. Represents Last Twelve Months as of December 2020 (IFRS accounting standard)3. Results do not include contribution from Sensis
Acquisition 17% $200M+ 8% 38% Financial Highlights $135M
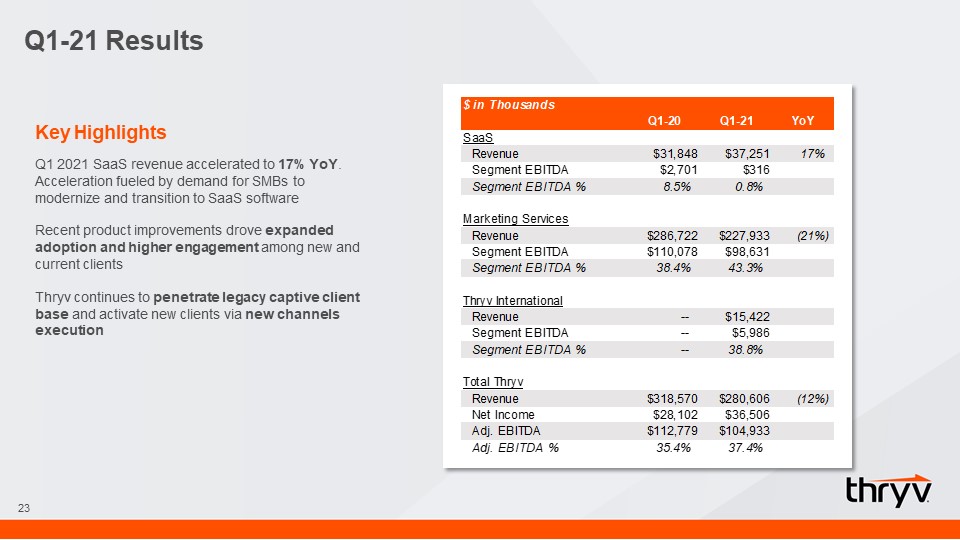
Q1-21 Results 23 Key HighlightsQ1 2021 SaaS revenue accelerated to 17% YoY. Acceleration fueled by
demand for SMBs to modernize and transition to SaaS softwareRecent product improvements drove expanded adoption and higher engagement among new and current clientsThryv continues to penetrate legacy captive client base and activate new clients
via new channels execution
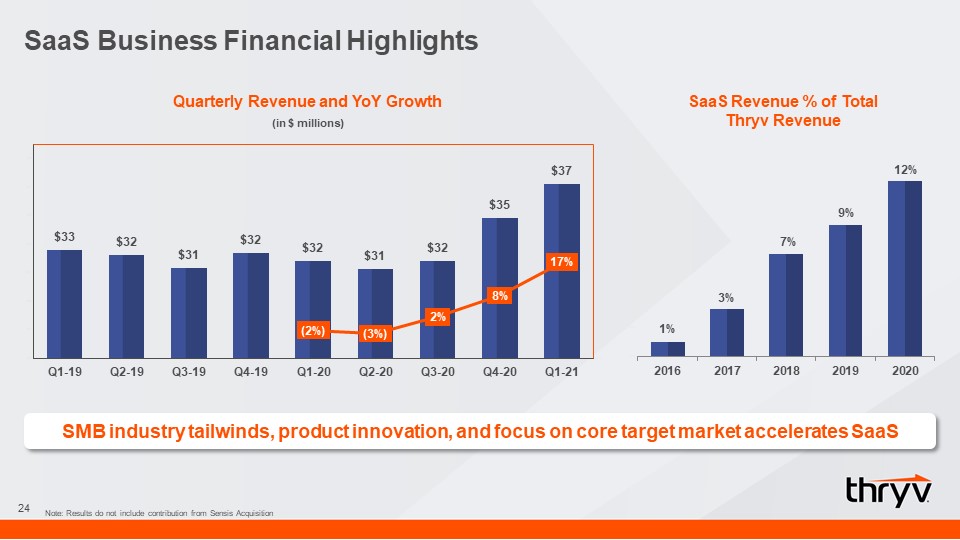
SaaS Business Financial Highlights 24 SaaS Revenue % of Total Thryv Revenue Quarterly Revenue and YoY
Growth SMB industry tailwinds, product innovation, and focus on core target market accelerates SaaS (in $ millions) Note: Results do not include contribution from Sensis Acquisition

Key SaaS Metrics Hitting Inflection Point 25 Net Dollar Retention excludes Setup Fees and Credits &
Adjustments. Uses month 2 revenue for clients that were given the 1st month free

Appendix

27 Marketing Services Overview Directory BusinessSubscription-based display ads, online local
business listings services and paid placement in offline directoriesLTM Revenue: $709mm1,3 SEMPaid placement in search engine resultsLTM Revenue: $157mm1,3 PresenceOnline listings management, Websites, Display ads and Search Engine
Optimization (SEO)LTM Revenue: $82mm1,3 Marketing Services Snapshot Note: Q1-21 includes Sensis contribution subsequent the acquisition date of March 1, 20211. Last Twelve Months as of March 20212. Based on 2021 Local Media Tracking Study
by Localogy3. Excludes certain sales allowances that are included when reporting total Marketing Services ~300,000+U.S. Clients $921mmLTM Revenue1 38%LTM Segment EBITDA Margin1 26+ millionMonthly visits to online directories 7+
billionTotal 2020 directory references made in the U.S.2
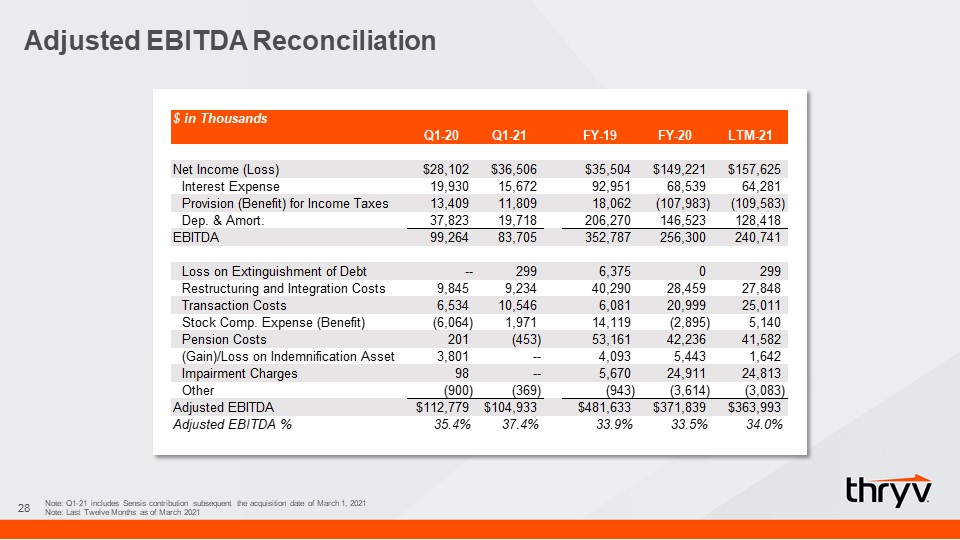
Adjusted EBITDA Reconciliation 28 Note: Q1-21 includes Sensis contribution subsequent the acquisition
date of March 1, 2021Note: Last Twelve Months as of March 2021
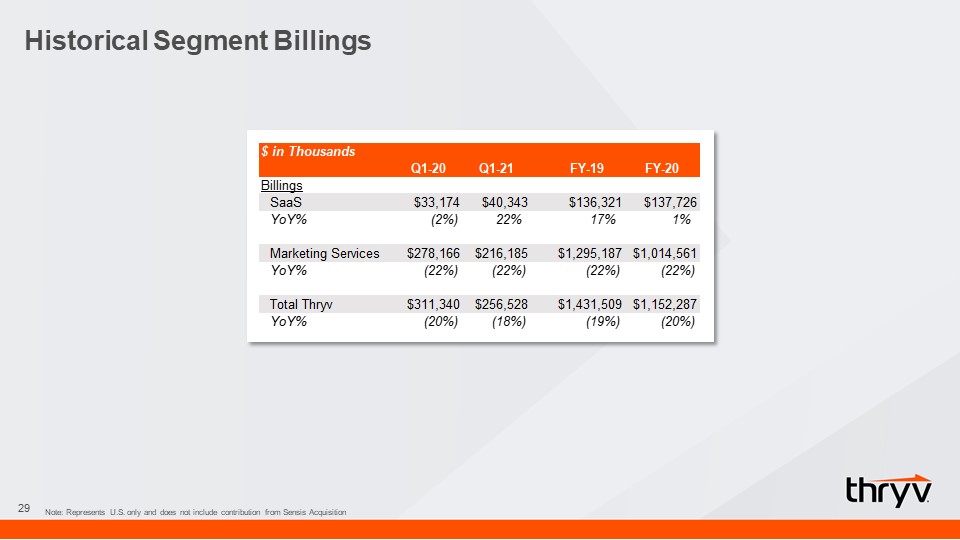
Historical Segment Billings 29 Note: Represents U.S. only and does not include contribution from
Sensis Acquisition

Historical Segment Financials 30 Note: Last Twelve Months as of March 2021Note: Total Thryv includes
certain purchase accounting adjustments not reflected at the business segment level