Attached files
| file | filename |
|---|---|
| EX-99.2 - PRESENTATION MATERIALS - HT-001 TOPICAL GEL - Hoth Therapeutics, Inc. | ea141512ex99-2_hoththerap.htm |
| 8-K - CURRENT REPORT - Hoth Therapeutics, Inc. | ea141512-8k_hoththerapeutics.htm |
Exhibit 99.1

Introduction to HT - KIT an mRNA Frame Shifting Therapeutic Significantly Inhibits Tumor Growth in Mast Cell - Derived Cancers

Safe Harbor Statement This presentation contains "forward - looking statements" within the meaning of the “safe - harbor” provisions of the Private Securities Litigation Reform Act of 1995 . These statements are identified by the use of words “could,” “believe,” “anticipate,” “intend,” “estimate,” “expect,” “may,” “continue,” “predict,” “potential” and similar expressions that are intended to identify forward - looking statements . Such statements involve known and unknown risks, uncertainties and other factors that could cause the actual results of Hoth Therapeutics, Inc . (“Hoth” or the “Company”) to differ materially from the results expressed or implied by such statements . These forward - looking statements are made on the basis of the current beliefs, expectations and assumptions of management, are not guarantees of performance and are subject to significant risks and uncertainty . These forward - looking statements should, therefore, be considered in light of various important factors, including those set forth in Hoth’s reports that it files from time to time with the Securities and Exchange Commission (the “Commission”) and which you should review, including those statements under “Item 1 A – Risk Factors” in Hoth’s Annual Report on Form 10 - K, as amended by its Quarterly Reports on Form 10 - Q and other reports that Hoth files with the Commission . Important factors that could cause actual results to differ materially from those described in forward - looking statements contained in this presentation include, but are not limited to : the adverse impact on economies around the world of the current COVID - 19 pandemic ; changes to our anticipated sources of revenues ; competitive conditions ; difficulties in obtaining regulatory approvals for the Company’s product candidates ; changes in economic and political conditions ; the success of our research and development initiates ; and other factors . These forward - looking statements should not be relied upon as predictions of future events and Hoth cannot assure you that the events or circumstances discussed or reflected in these statements will be achieved or will occur . If such forward - looking statements prove to be inaccurate, the inaccuracy may be material . You should not regard these statements as representation or warranty by Hoth or any other person that we will achieve our objectives and plans in any specified timeframe, or at all . You are cautioned not to place undue reliance on these forward - looking statements, which speak only as of the date of this presentation . The Company disclaims any obligations to publicly update or release any revisions to the forward - looking information contained in this presentation, whether as a result of new information, future events or otherwise, after the date of this presentation or to reflect the occurrence of unanticipated events, except as required by law .

H T - KIT HT - KIT is a novel antisense oligonucleotide under development for the treatment of cancers resulting from aberrant KIT signaling . The HT - KIT drug is designed to more specifically target the receptor tyrosine kinase KIT, which is required for the proliferation, survival and differentiation of bone marrow - derived hematopoietic stem cells . Mutations in the KIT pathway have been associated with several human cancers, such as mast cell - derived cancers (aggressive systemic mastocytosis (ASM), systemic mastocytosis with associated hematological neoplasm (SM - AHN), or mast cell leukemia (MCL)), gastrointestinal stromal tumors, and acute myeloid leukemia . HT - KIT is currently in the pre - clinical stage of development .

Targeting KIT by frameshifting mRNA transcripts as a therapeutic strategy for aggressive mast cell neoplasms Douglas B. Snider 1 , Greer K. Arthur 1 , Guido H. Falduto 2 , Ana Olivera 2 , Lauren C. Ehrhardt - Humbert 1 , Emmaline Smith 1 , Cierra Smith 1 , Dean D. Metcalfe 2 and Glenn Cruse 1 1 Department of Molecular Biomedical Sciences, CVM, NC State University 2 Laboratory of Allergic Diseases, NIAID, NIH Fig . 1 . ESO - mediated alternative splicing of exon 4 in c - KIT pre - mRNA . (A) HT - KIT ESO was designed to target the donor splice site of exon 4 , which led to exclusion of exon 4 by the spliceosome . This is predicted to introduce a premature stop codon due to a frameshift in the open reading frame of the mRNA transcript . Yellow boxes represent exons ; thick black bar rep r ese n ts intron s . F L - c - KIT = full - length c - R T - P CR KI T , t - c - KIT = trun c ated c - KI T . (B) demonstrating splice - switching of c - KIT by HT - KIT ESO in comparison to control oligo in HMC - 1. 2 cel l s. Black arrow = ful l - length c - KI T , orange arrow = alternatively spliced truncated c - KIT mRNA . (C) qRT - PCR of KIT transcripts in HMC - 1 . 2 cells demonstrates a significant reduction in KIT mRNA transcripts with HT - KIT relative to control cells after correction against β - acti n . Figure 1

Fi g . 2. H T - KIT ESO reduc e s KIT e x p r e s s i on a n d in d uces apopt o s i s o f neoplas t ic hu m an ma s t cell s . (A) Mean flow cytometry data for total KIT expression calculated from the geometric MFI. (B) Combined data from flow cytomet r y for Annexin V expre s sed a s the ge o metric MF I . (C) C o m b i n e d geome t ric MFI of HMC - 1.2 cells in culture. LIVE/DEAD staining in HMC - 1.2 cells at each time point. (D) Viable cell counts of Data are the mean “ SEM from 3 independent experiments. *p<0.05, **p<0.01, ***p<0.001, ANOVA with Sidak’s post - test. Figure 2

Fig. 4. Systemic delivery of human HT - KIT ESO inhibits tumor growth in a humanized xenograft mast cell neoplasia model . The top schematic representation of the protocol for the xenograft model used . ( A ) Examples of tumors in mice during treatment . The red arrows indicate the tumor and the green arrows show a secondary growth caused by drag of the needle during inoculation . ( B ) Measurements of tumor volume over time during treatment . Arrows indicate days that HT - KIT or vehicle control was administered . ( C ) Photograph of tumors after mice were euthanized at day 14 . Measurements are in centimeters . ( D ) Weight of excised tumors after mice were euthanized on day 14 . ( E ) Spleen weight at the conclusion of the experiment . ( F ) Liver weight at the conclusion of the experiment . ( G ) Mice weight was monitored over the course of the experiment . No significant differences were observed over the course of the experiment . Data are the mean “ SEM from 5 mice per group . *p< 0 . 05 , **p< 0 . 01 , ***p< 0 . 001 . ANOVA with Dunnett’s post - test ( B ), or unpaired t - test ( D & E ) . Figure 3

Fig . 4 . HT - KIT ESOs redu c e liver of ne o plas t ic mast cells i n a infiltration humanized neoplasia. ( A - D) Example li v er sections from xen o graft m odel o f mast ce l l NSG mice showing neoplastic mast cell infiltrates with H & E (A) and IHC for human KIT (B) in the vehicle control liver and almost no infiltrates in the H T - KIT t r eated livers (C Histopathological assessment neoplastic infiltration in l i v e r . & D ) . (E) o f % of (F) Histopatholo g ical assessm e nt of neop l astic foci size i n liver s . Gr a phic a l re p rese n tati o n of data includes box where middle bar plots and whiskers rep r esent represents median m i ni m um and m a xi m u m . determined by Fisher’s LSD The p - value was test with ordinary on e - w a y A N O VA or uncorrecte d Dunn’ s test with Kruskal - Wallis one - way ANOVA. *p≤0.05, **p≤0.01, ***p≤0.001, ****p≤0.0001 Figure 4
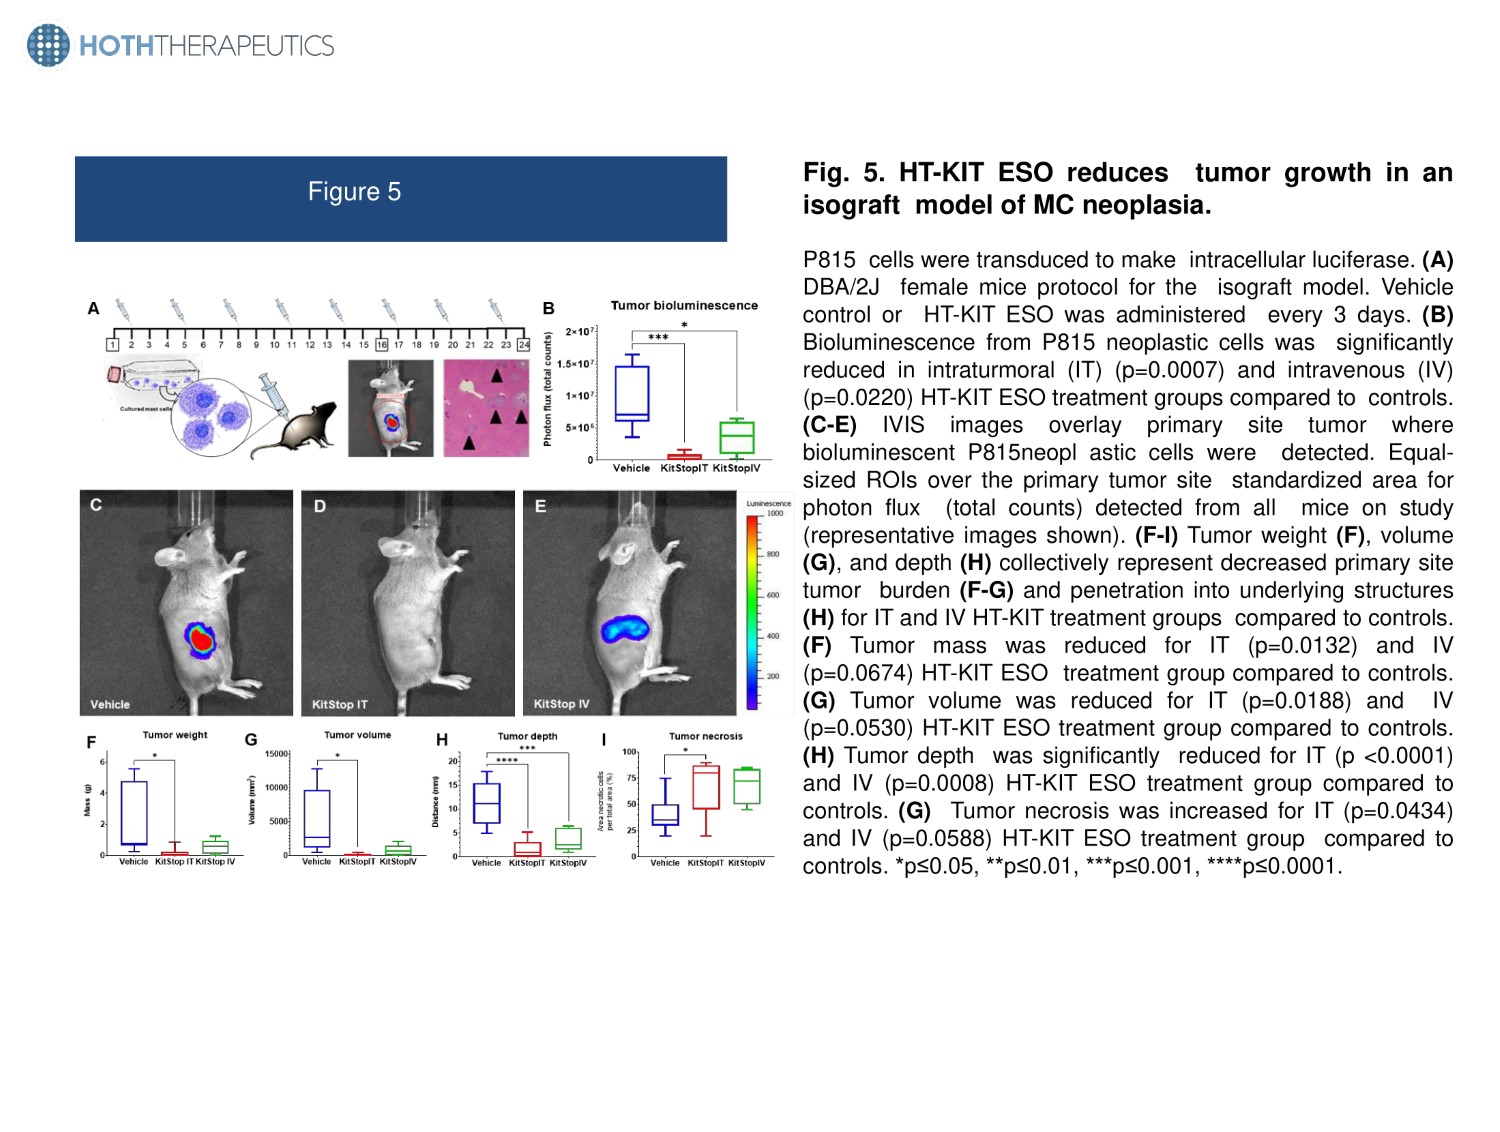
Figure 5 Fi g . 5. H T - KIT E S O reduces tumor g r owth in an isograft model of MC neoplasia. P 815 cells were transduced to make intracellular luciferase . (A) DBA/ 2 J female mice protocol for the isograft model . Vehicle control or HT - KIT ESO was administered every 3 days . (B) Bioluminescence from P 815 neoplastic cells was significantly reduced in intraturmoral (IT) (p= 0 . 0007 ) and intravenous (IV) (p= 0 . 0220 ) HT - KIT ESO treatment groups compared to controls . (C - E) IVIS images overlay primary site tumor where bioluminescent P 815 neopl astic cells were detected . Equal - sized ROIs over the primary tumor site standardized area for photon flux (total counts) detected from all mice on study (representative images shown) . (F - I) Tumor weight (F) , volume (G) , and depth (H) collectively represent decreased primary site tumor burden (F - G) and penetration into underlying structures (H) for IT and IV HT - KIT treatment groups compared to controls. (F) T umor m a ss was r e du c e d for I T (p = 0 .013 2 ) an d IV (p=0.0674) HT - KIT ESO treatment group compared to controls. (G) T umor volume w as reduced for I T (p= 0 .018 8 ) a nd IV (p=0.0530) HT - KIT ESO treatment group compared to controls. (H) Tumor depth was significantly reduced for IT (p <0.0001) a nd I V (p = 0 .000 8 ) H T - KIT ESO tre a tment g ro up compa r ed to controls . (G) Tumor necrosis was increased for IT (p= 0 . 0434 ) and IV (p= 0 . 0588 ) HT - KIT ESO treatment group compared to controls . *p≤ 0 . 05 , **p≤ 0 . 01 , ***p≤ 0 . 001 , ****p≤ 0 . 0001 .

Fig . 6 . HT - KIT ESO reduced cardinal signs of mast cell leukemia in an isograft model of mutant mast cell neoplasia . (A) Percent of m a r r ow i n filtrated by P 8 1 5 ne o pla s tic cell s . bone (B) Re p r e s e n t a t iv e micr o gra p h of bone marrow from vehicle controls (B) compared to IT (C) , and IV (D) HT - KIT ESO . (E) Displacement of hematopoietic bone marrow tissue (myelophthisis) by neoplastic mast cells . (F) Packed red blood cell volume (hematocrit) . (G) Bone marrow hematopoiesis as measured by myeloid progenitor to erythroid progenitor (M : E ratio) . (H) Circulating neoplastic mast cells on differential counts . (I) Blood smear of ne o pla s tic mast cel l s R o m a no w s ky with (representative image shown from vehicle stain cont r ol animal blood). (J) H&E histopathology assessment of ne o pla s tic embo l i an d circu l a t ing neop l a s tic cel l s in or g a ns . ( K - L) E mb o li of neop l astic mast cells in pulmonary vessels from H&E histopathology sections from control (K) and intravenous HT - KIT ESO (L) treatment groups . *p≤ 0 . 05 , **p≤ 0 . 01 , ***p≤ 0 . 001 , ****p≤0.0001. c

Targeting KIT by frameshifting mRNA transcripts as a therapeutic strategy for aggressive mast cell neoplasms Douglas B. Snider 1 , Greer K. Arthur 1 , Guido H. Falduto 2 , Ana Olivera 2 , Lauren C. Ehrhardt - Humbert 1 , Emmaline Smith 1 , Cierra Smith 1 , Dean D. Metcalfe 2 and Glenn Cruse 1 1 Department of Molecular Biomedical Sciences, CVM, NC State University 2 Laboratory of Allergic Diseases, NIAID, NIH Activating mutations in the proto - oncogene c - KIT are associated with the mast cell (MC) clonal disorders cutaneous mastocytosis, systemic mastocytosis and its variants including aggressive systemic mastocytosis and mast cell leukemia, and MC sarcoma . Currently, therapies inhibiting KIT signaling are a leading strategy to treat MC proliferative disorders . However, these approaches may have off - target effects and in some patients, complete remission or improved survival time cannot be achieved . These limitations led us to develop an approach using chemically stable exon skipping oligonucleotides (ESO) that induce exon skipping of pre - mRNA to alter gene splicing and introduce a frameshift into mature KIT mRNA transcripts . Exon - skipping c - KIT to remove exon 4 will force a frameshift in mature mRNA introducing an immediate STOP codon triggering nonsense - mediated mRNA decay . If this pathway is saturated, production of a severely truncated non - functional KIT protein would result . Both of these mechanisms would deplete functional KIT, inhibit proliferation and induce apoptosis of neoplastic MCs . This alternate approach to MC neoplasia results in marked downregulation of KIT expression, diminished KIT signaling, inhibition of MC proliferation and rapid induction of apoptosis in neoplastic HMC - 1 . 2 MCs . This downregulation of KIT expression is achieved by combining two independent mechanisms involving nonsense - mediated mRNA decay and the production of alternatively spliced non - functional proteins . We further demonstrate that in vivo administration of KIT targeting ESOs significantly inhibits tumor growth and systemic organ infiltration using both an allograft mastocytosis model and a humanized xenograft MC tumor model . We propose that our innovative approach, which employs well - tolerated, chemically stable oligonucleotides to target KIT expression through unconventional pathways, has potential as a KIT - targeted therapeutic alone, or in combination with agents that target KIT signaling, in the treatment of KIT - associated malignancies . R a ti ona l e Funding : Department of Molecular Biomedical Sciences, College of Veterinary Medicine, start - up funds (G . C . ), NCSU Center for Human Health and the Environment grant #ES 025128 , NIH T 32 OD 011130 and the Division of Intramural Research of NIAID within the National Institutes of Health . Conflict of Interest disclosure : Dr . Cruse has filed a patent application related to the research reported in this study . Dr . Cruse has research support from Hoth Therapeutics and also serves on their Scientific Advisory Board . The terms of this arrangement have been reviewed and approved by NC State University in accordance with its policy on objectivity in research . Acknowledgements Hy po t he si s Figure 2 Figure 5 Figure 3 Figure 6 Fig . 2 . HT - KIT ESO reduces KIT expression and induces apoptosis of neoplastic human mast cells . (A) Mean flow cytometry data for total KIT expression calculated from the geometric MFI . (B) Combined data from flow cytometry for Annexin V expressed as the geometric MFI . (C) Combined geometric MFI of LIVE/DEAD staining in HMC - 1 . 2 cells at each time point . (D) Viable cell counts of HMC - 1 . 2 cells in culture . Data are the mean “ SEM from 3 independent experiments . *p< 0 . 05 , **p< 0 . 01 , ***p< 0 . 001 , ANOVA with Sidak’s post - test . Fig . 5 . HT - KIT ESO reduces tumor growth in an isograft model of MC neoplasia . P 815 cells were transduced to make intracellular luciferase . (A) DBA/ 2 J pro tocol for the female i so graft HT - KIT mice model. ESO Vehicle control or w a s admi ni ster e d every 3 days. (B) Bioluminescence from P815 neoplastic cells was signi f i c an t ly redu ced in intraturmoral (IT) (p=0.0007) and intravenous (IV) (p=0.0220) HT - KIT ESO treatment groups compared to controls. (C - E) IVIS images overlay prim a ry site bioluminescent t um o r w her e P 81 5 n e op l a stic cells were detected. Equal - sized ROIs over the primary tumor site standardized area for photon flux ( total c o un t s) detected from all mice on study (representative images shown). (F - I) Tumor weight (F) , volume (G) , and depth (H) collectively represent decreased primary site tumor burden (F - G) and penetration into underlying structures (H) for IT and IV HT - KIT treatment groups compared to controls. (F) Tumor mass was reduced for IT (p=0.0132) and IV (p=0.0674) HT - KIT ESO Figure 4 Fig. 6. HT - KIT ESO reduced cardinal signs of mast cell leukemia in an isograft model of mutant mast cell bon e marro w i n fi l trated P815 neopl a stic cel l s. n e o p lasia. (A) Percent of by (B) Representative micrograph of bone marrow from vehicle controls (B) compared to IT (C) , and IV (D) HT - KIT ESO . (E) Dis pla c e ment of hematopoietic bone marrow neopl a stic mast cel l s. tissue (myelop h th i s i s) by (F) Figure 1 Fig . 1 . ESO - mediated alternative splicing of exon 4 in c - KIT pre - mRNA . (A) HT - KIT ESO was designed to target the donor splice site of exon 4 , which led to exclusion of exon 4 by the spliceosome . This is predicted to introduce a premature stop codon due to a frameshift in the open reading frame of the mRNA transcript . Yellow boxes represent exons ; thick black bar represents introns . FL - c - KIT = full - length c - KIT, t - c - KIT = truncated c - KIT . (B) RT - PCR demonstrating splice - switching of c - KIT by HT - KIT ESO in comparison to control oligo in HMC - 1 . 2 cells . Black arrow = full - length c - KIT, orange arrow = alternatively spliced truncated c - KIT mRNA . (C) qRT - PCR of KIT transcripts in HMC - 1 . 2 cells demonstrates a significant reduction in KIT mRNA transcripts with HT - KIT relative to control cells after correction against β - actin . S u mm a r y Fig . 4. S y s t e mic del i ve r y o f hu ma n HT - KIT ESO inhibits tumor growth in a humanized xenograft mast cell neoplasia model. The top schematic representation of the protocol for the xenograft model used. ( A ) Examples of tumors in mice during treatment . The red arrows indicate the tumor and the green arrows show a secondary growth caused by drag of the needle during inoculation . ( B ) Measurements of tumor volume over time during treatment . Arrows indicate days that HT - KIT or vehicle control was administered . ( C ) Photograph of tumors after mice were euthanized at day 14 . Measurements are in centimeters . ( D ) Weight of excised tumors after mice were euthanized on day 14 . ( E ) Spleen weight at the conclusion of the experiment . ( F ) Liver weight at the conclusion of the experiment . ( G ) Mice weight was monitored over the course of the experiment . No significant differences were observed over the course of the experiment. Data are the mean “ SEM from 5 mice per group. *p<0.05, **p<0.01, ***p<0.001. ANOVA with Dunnett’s post - test ( B ), or unpaired t - test ( D & E ). treatment group compared to controls . (G) Tumor volume was reduced for IT (p= 0 . 0188 ) and IV (p= 0 . 0530 ) HT - KIT ESO treatment group compared to controls . (H) Tumor depth was significantly reduced for IT (p < 0 . 0001 ) and IV (p= 0 . 0008 ) HT - KIT ESO treatment group compared to controls . (G) Tumor necrosis was increased for IT (p= 0 . 0434 ) and IV (p= 0 . 0588 ) HT - KIT ESO treatment group compared to controls . *p≤ 0 . 05 , **p≤ 0 . 01 , ***p≤ 0 . 001 , ****p≤ 0 . 0001 . Packed red blood cell volume (hematocrit) . (G) Bone marrow hematopoiesis as measured by myeloid progenitor to erythroid progenitor (M : E ratio) . (H)Circulating neoplastic mast cells on differential counts . (I) Blood smear of neoplastic mast cells with Romanowsky stain (representative image shown from vehicle control animal blood) . (J) H&E histopathology assessment of neoplastic emboli and circulating neoplastic cells in organs . (K - L) Emboli of neoplastic mast cells in pulmonary vessels from H&E histopathology sections from control (K) and intravenous HT - KIT ESO (L) treatment groups . *p≤ 0 . 05 , **p≤ 0 . 01 , ***p≤ 0 . 001 , ****p≤ 0 . 0001 . Fig . 4 . HT - KIT ESOs reduce liver infiltration of neoplastic mast cells in a humanized xenograft model of mast cell neoplasia . (A - D) Example liver sections from NSG mice showing neoplastic mast cell infiltrates with H&E (A) and IHC for human KIT (B) in the vehicle control liver and almost no infiltrates in the HT - KIT treated livers (C & D) . (E) Histopathological assessment of % of neoplastic infiltration in liver . (F) Histopathological assessment of neoplastic foci size in livers . Graphical representation of data includes box plots where middle bar represents median and whiskers represent minimum and maximum . The p - value was determined by Fisher’s LSD test with ordinary one - way ANOVA or uncorrected Dunn’s test with Kruskal - Wallis one - way ANOVA . *p≤ 0 . 05 , **p≤ 0 . 01 , ***p≤ 0 . 001 , ****p≤ 0 . 0001 .