Attached files
| file | filename |
|---|---|
| EX-99.1 - EX-99.1 - Northern Star Investment Corp. II | d298214dex991.htm |
| 8-K - 8-K - Northern Star Investment Corp. II | d298214d8k.htm |
Exhibit 99.2

|
APEX May 2021
|
Disclaimer Basis of Presentation Disclaimer This Presentation (this “Presentation”) is provided for informational purposes only. This Presentation and any oral statements made in connection with this Presentation do not constitute an offer to sell, or a solicitation of an offer to buy, or a recommendation or advice to purchase, any securities in any jurisdiction, or the solicitation of any vote, consent or approval in any jurisdiction in connection with the previously announced potential business combination between Apex Fintech Solutions LLC (“Apex”) and Northern Star Investment Corp. II (“Northern Star”) and related transactions (the “Potential Business Combination”), nor shall there be any sale, issuance or transfer of any securities in any jurisdiction where, or to any person to whom, such offer, solicitation or sale may be unlawful under the laws of such jurisdiction. No representations or warranties, express or implied are given in, or in respect of, this Presentation. Industry and market data used in this Presentation have been obtained from third-party industry publications and sources as well as from research reports prepared for other purposes. Neither Northern Star nor Apex has independently verified the data obtained from these sources and cannot assure you of the data’s accuracy or completeness. This data is subject to change. Recipients of this Presentation are not to construe its contents, or any prior or subsequent communications from or with Northern Star, Apex or their respective representatives as investment, legal or tax advice. Forward Looking Statements Certain statements included in this Presentation are not historical facts but are forward-looking statements for purposes of the safe harbor provisions under the United States Private Securities Litigation Reform Act of 1995. Forward-looking statements generally are accompanied by words such as “believe,” “may,” “will,” “estimate,” “continue,” “anticipate,” “intend,” “expect,” “should,” “would,” “plan,” “predict,” “potential,” “seem,” “seek,” “future,” “outlook,” and similar expressions that predict or indicate future events or trends or that are not statements of historical matters, but the absence of these words does not mean that a statement is not forward-looking. These forward-looking statements include, but are not limited to, (1) statements regarding estimates and forecasts of other financial and performance metrics and projections of market opportunity; (2) references with respect to the anticipated benefits of the Potential Business Combination and the projected future financial performance of Apex and Apex’s operating companies following the Potential Business Combination; (3) changes in the market for Apex’s services, and expansion plans and opportunities; and (4) anticipated client retention.These statements are based on various assumptions, whether or not identified in this Presentation, and on the current expectations of Apex’s management and are not predictions of actual performance. These forward-looking statements are provided for illustrative purposes only and are not intended to serve as, and must not be relied on by any investor as, a guarantee, an assurance, a prediction or a definitive statement of fact or probability. Actual events and circumstances are difficult or impossible to predict and will differ from assumptions. Many actual events and circumstances are beyond the control of Apex. These forward-looking statements are subject to a number of risks and uncertainties, including: changes in domestic and foreign business, market, financial, political, regulatory, and legal conditions; risks relating to the uncertainty of the projected financial information with respect to the Apex; Apex’s ability to successfully expand and/or retain its product and service offerings; competition; the uncertain effects of the COVID-19 pandemic; and those factors discussed in documents of Northern Star filed, or to be filed, with the U.S. Securities and Exchange Commission (the “SEC”). If any of these risks materialize or our assumptions prove incorrect, actual results could differ materially from the results implied by these forward-looking statements. There may be additional risks that neither Northern Star nor Apex presently know or that Northern Star and Apex currently believe are immaterial that could also cause actual results to differ from those contained in the forward-looking statements. In addition, forward looking statements reflect Northern Star’s and Apex’s expectations, plans or forecasts of future events and views as of the date of this Presentation. Northern Star and Apex anticipate that subsequent events and developments will cause Northern Star’s and Apex’s assessments to change. However, while Northern Star and Apex may elect to update these forward-looking statements at some point in the future, Northern Star and Apex specifically disclaim any obligation to do so. These forward-looking statements should not be relied upon as representing Northern Star’s and Apex’s assessments as of any date subsequent to the date of this Presentation. Accordingly, undue reliance should not be placed upon the forward-looking statements. Financial Information; Non-GAAP Financial Measures The Apex financial information and data for the fiscal years ended December 31, 2018, 2019 and 2020 included herein have been audited by RSM US LLP. Some of the financial information and data contained in this Presentation, such as Adjusted EBITDA and Adjusted Net Revenue, have not been prepared in accordance with United States generally accepted accounting principles (“GAAP”). These non-GAAP measures, and other measures that are calculated using such non-GAAP measures, are an addition to, and not a substitute for or superior to, measures of financial performance prepared in accordance with GAAP and should not be considered as an alternative to revenue, operating income, profit before tax, net income or any other performance measures derived in accordance with GAAP. Northern Star and Apex believe these non-GAAP measures of financial results, including on a forward-looking basis, provide useful information to management and investors regarding certain financial and business trends relating to Apex’s financial condition and results of operations. Apex’s management uses these non-GAAP measures for trend analyses, for purposes of determining management incentive compensation, and for budgeting and planning purposes. Northern Star and Apex believe that the use of these non-GAAP financial measures provides an additional tool for investors to use in evaluating projected operating results and trends in and in comparing Apex’s financial measures with other similar companies, many of which present similar non-GAAP financial measures to investors. Management of Northern Star does not consider these non-GAAP measures in isolation or as an alternative to financial measures determined in accordance with GAAP. However, there are a number of limitations related to the use of these non-GAAP measures and their nearest GAAP equivalents. For example, other companies may calculate non-GAAP measures differently, or may use other measures to calculate their financial performance, and therefore Apex’s non-GAAP measures may not be directly comparable to similarly titled measures of other companies. See the footnotes on the slides where these measures are discussed and the Appendix for definitions of these non-GAAP financial measures and reconciliations of these non-GAAP financial measures to the most directly comparable GAAP measures. Important Information for Investors and Stockholders In connection with the Potential Business Combination, Northern Star has filed a registration statement on Form S-4, including a proxy statement and prospectus, with the SEC. Additionally, Northern Star will file other relevant materials with the SEC in connection with the Potential Business Combination. Copies may be obtained free of charge at the SEC’s web site at www.sec.gov or by directing a written request to Northern Star Investment Corp. II, c/o Graubard Miller, 405 Lexington Avenue, 11th Floor, New York, New York 10174. Security holders of Northern Star are urged to read the proxy statement/prospectus and the other relevant materials when they become available before making any voting decision with respect to the Potential Business Combination because they will contain important information about the Potential Business Combination and the parties thereto. Participants in the Solicitation Northern Star and Apex and their respective directors, managers and executive officers, under SEC rules, may be deemed participants in the solicitation of proxies of Northern Star’s stockholders in connection with the Potential Business Combination. Security holders may obtain more detailed information regarding the names, affiliations and interests of certain of Northern Star’s executive officers and directors in the solicitation by reading Northern Star’s filings with the SEC, including its final prospectus dated January 25, 2021 filed with the SEC on January 27, 2021. Information concerning the interests of persons who may, under SEC rules, be deemed participants in the solicitation of proxies to Northern Star’s stockholders in connection with the Potential Business Combination are set forth in the registration statement on Form S-4 for the Potential Business Combination that Northern Star filed with the SEC on April 8, 2021, which includes a proxy statement and prospectus. Stockholders, potential investors and other interested persons should read the proxy statement/prospectus carefully before making any voting or investment decisions. This Presentation is not a substitute for the registration statement or for any other document that Northern Star may file with the SEC in connection with the Potential Business Combination. Trademarks Northern Star and Apex own or have rights to various trademarks, service marks and trade names that they use in connection with the operation of their respective businesses. This Presentation may also contain trademarks, service marks, trade names and copyrights of third parties, which are the property of their respective owners. The use or display of third parties’ trademarks, service marks, trade names or products in this Presentation is not intended to, and does not imply, a relationship with Northern Star or Apex, or an endorsement or sponsorship by or of Northern Star or Apex. Solely for convenience, the trademarks, service marks, trade names and copyrights referred to in this Presentation may appear without the TM, SM, ® or © symbols, but such references are not intended to indicate, in any way, that Northern Star or Apex will not assert, to the fullest extent under applicable law, their rights or the right of the applicable licensor to these trademarks, service marks, trade names and copyrights.
|
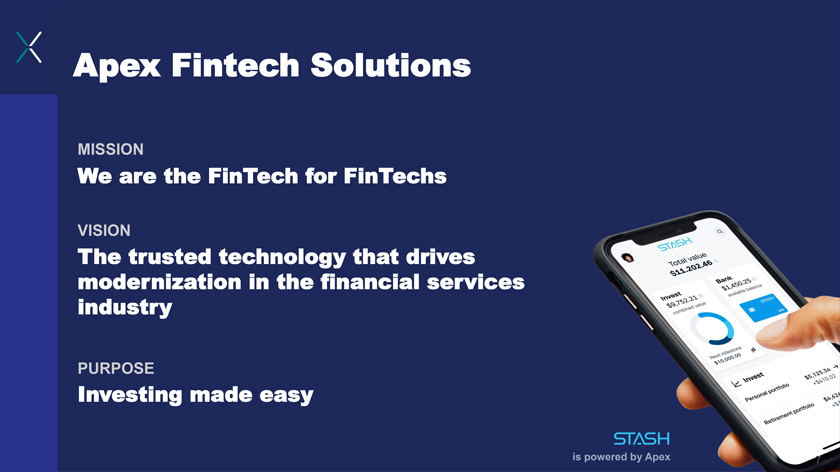
Apex Fintech Solutions MISSION We are the FinTech for FinTechs VISION The trusted technology that drives modernization in the financial services industry PURPOSE Investing made easy STASH is powered by Apex
|
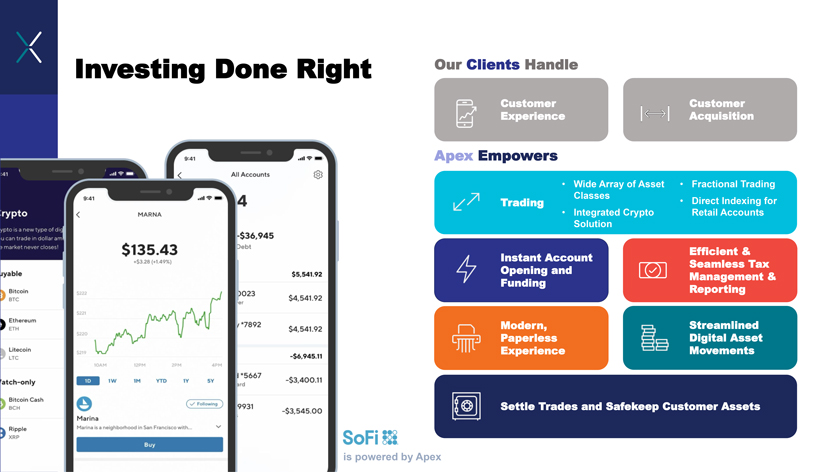
Investing Done Right Our Clients Handle Customer Customer Experience Acquisition Apex Empowers • Wide Array of Asset • Fractional Trading Classes Trading • Direct Indexing for • Integrated Crypto Retail Accounts Solution Efficient & Instant Account Seamless Tax Opening and Management & Funding Reporting Modern, Streamlined Paperless Digital Asset Experience Movements Settle Trades and Safekeep Customer Assets is powered by Apex
|
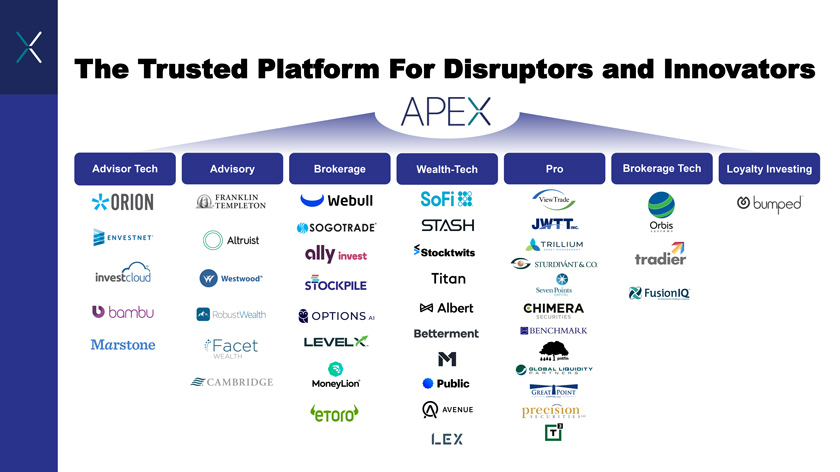
The Trusted Platform For Disruptors and Innovators Advisor Tech Advisory Brokerage Wealth-Tech Pro Brokerage Tech Loyalty Investing
|
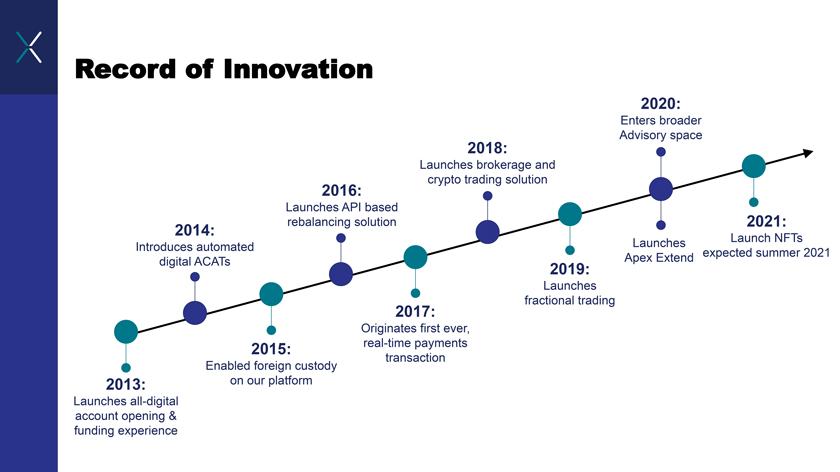
Record of Innovation 2014: Introduces automated digital ACATs 2016: Launches API based rebalancing solution 2018: Launches brokerage and crypto trading solution 2020: Enters broader Advisory space 2021: Launch NFTs expected summer 2021 Launches Apex Extend 2019: Launches fractional trading 2017: Originates first ever, real-time payments transaction 2015: Enabled foreign custody on our platform 2013: Launches all-digital account opening & funding experience
|
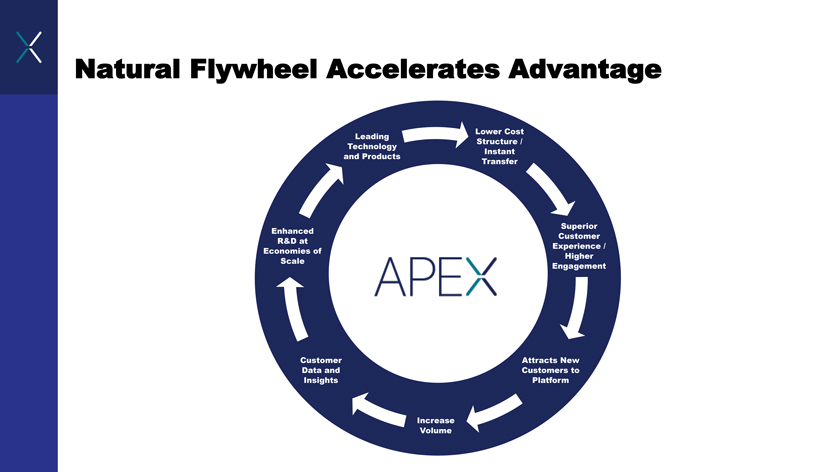
Natural Flywheel Accelerates Advantage Lower Cost Leading Structure / Technology Instant and Products Transfer Superior Enhanced Customer R&D at Experience / Economies of Higher Scale Engagement Customer Attracts New Data and Customers to Insights Platform Increase Volume
|
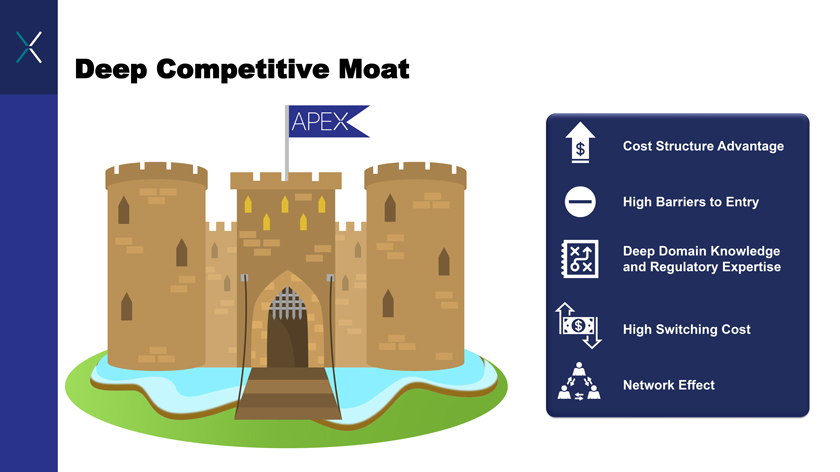
Deep Competitive Moat Cost Structure Advantage High Barriers to Entry Deep Domain Knowledge and Regulatory Expertise High Switching Cost Network Effect
|
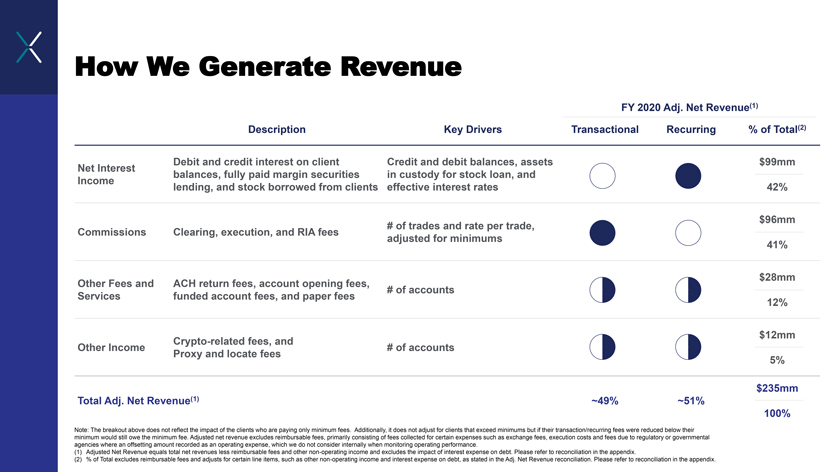
How We Generate Revenue Description Key Drivers Debit and credit interest on client Credit and debit balances, assets Net Interest balances, fully paid margin securities in custody for stock loan, and Income lending, and stock borrowed from clients effective interest rates # of trades and rate per trade, Commissions Clearing, execution, and RIA fees adjusted for minimums Other Fees and ACH return fees, account opening fees, # of accounts Services funded account fees, and paper fees Crypto-related fees, and Other Income # of accounts Proxy and locate fees FY 2020 Adj. Net Revenue(1) Transactional Recurring % of Total(2) $99mm 42% $96mm 41% $28mm 12% $12mm 5% $235mm 100% ~49% ~51% Total Adj. Net Revenue(1) Note: The breakout above does not reflect the impact of the clients who are paying only minimum fees. Additionally, it does not adjust for clients that exceed minimums but if their transaction/recurring fees were reduced below their minimum would still owe the minimum fee. Adjusted net revenue excludes reimbursable fees, primarily consisting of fees collected for certain expenses such as exchange fees, execution costs and fees due to regulatory or governmental agencies where an offsetting amount recorded as an operating expense, which we do not consider internally when monitoring operating performance. (1) Adjusted Net Revenue equals total net revenues less reimbursable fees and other non-operating income and excludes the impact of interest expense on debt. Please refer to reconciliation in the appendix. (2) % of Total excludes reimbursable fees and adjusts for certain line items, such as other non-operating income and interest expense on debt, as stated in the Adj. Net Revenue reconciliation. Please refer to reconciliation in the appendix.
|
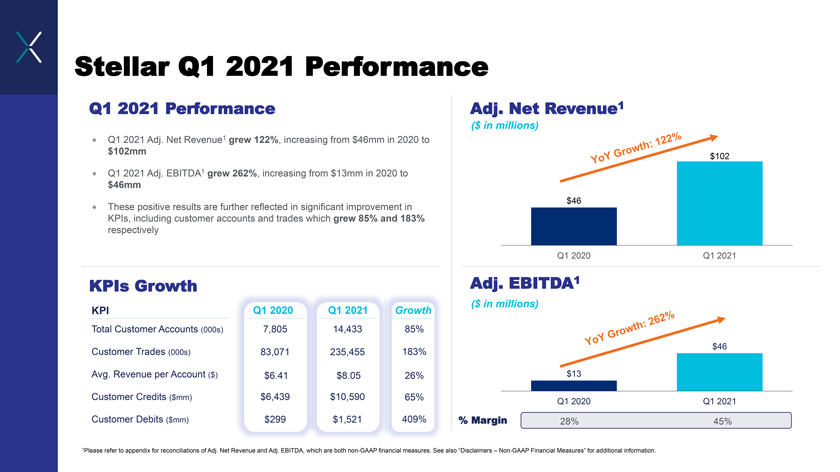
$13 Stellar Q1 2021 Performance Q1 2021 Performance Adj. Net Revenue1 ($ in millions) • Q1 2021 Adj. Net Revenue1 grew 122%, increasing from $46mm in 2020 to $102mm • Q1 2021 Adj. EBITDA1 grew 262%, increasing from $13mm in 2020 to $46mm • These positive results are further reflected in significant improvement in KPIs, including customer accounts and trades which grew 85% and 183% respectively KPIs Growth KPI Q1 2020 Q1 2021 Growth Total Customer Accounts (000s) 7,805 14,433 85% Customer Trades (000s) 83,071 235,455 183% Avg. Revenue per Account ($) $6.41 $8.05 26% Customer Credits ($mm) $6,439 $10,590 65% Customer Debits ($mm) $299 $1,521 409% Adj. EBITDA1 ($ in millions) Q1 2020 Q1 2021 % Margin 28% 45% 1Please refer to appendix for reconciliations of Adj. Net Revenue and Adj. EBITDA, which are both non-GAAP financial measures. See also “Disclaimers – Non-GAAP Financial Measures” for additional information. $46 Q1 2020 $102 Q1 2021 $46 2018 2019 2020 Q1 2021
|
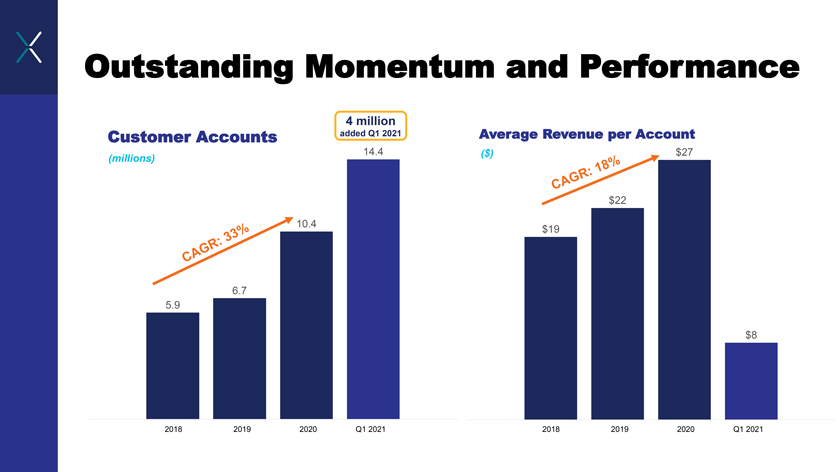
Outstanding Momentum and Performance 4 million Customer Accounts added Q1 2021 14.4 (millions) 10.4 6.7 5.9 2018 2019 2020 Q1 2021 Average Revenue per Account ($) $27 $19 $22 $8

|
Appendix
|
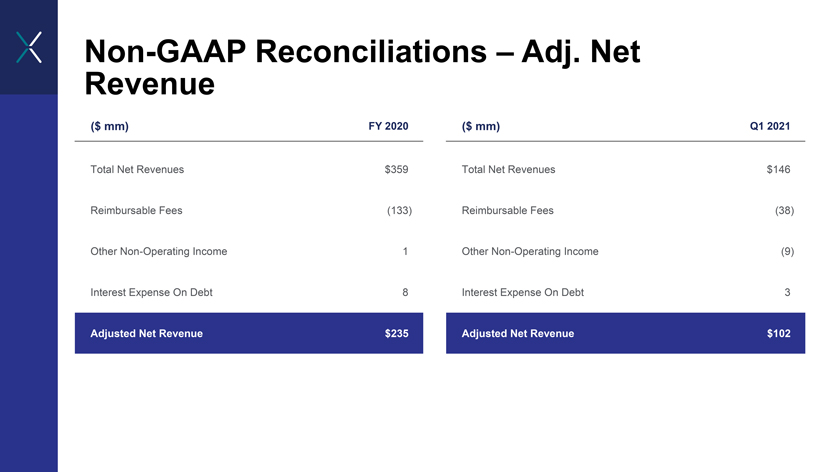
Non-GAAP Reconciliations – Adj. Net Revenue ($ mm) FY 2020 Total Net Revenues $359 Reimbursable Fees (133) Other Non-Operating Income 1 Interest Expense On Debt 8 Adjusted Net Revenue $235 ($ mm) Q1 2021 Total Net Revenues $146 Reimbursable Fees (38) Other Non-Operating Income (9) Interest Expense On Debt 3 Adjusted Net Revenue $102
|
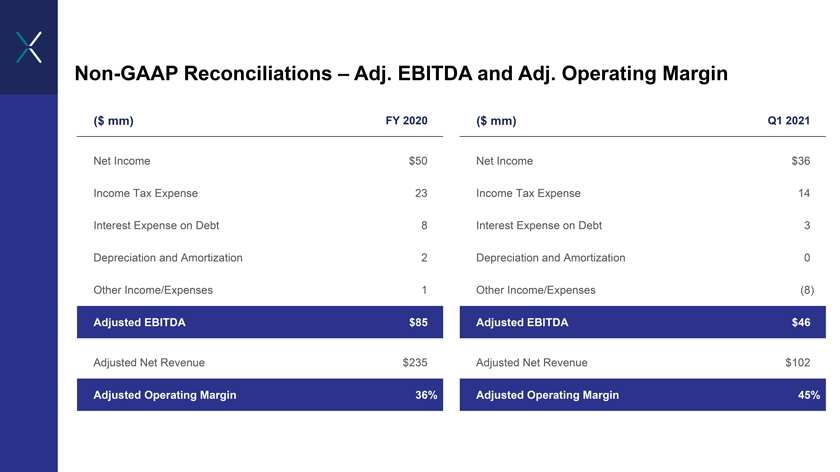
Non-GAAP Reconciliations – Adj. EBITDA and Adj. Operating Margin ($ mm) FY 2020 Net Income $50 Income Tax Expense 23 Interest Expense on Debt 8 Depreciation and Amortization 2 Other Income/Expenses 1 Adjusted EBITDA $85 Adjusted Net Revenue $235 Adjusted Operating Margin 36% ($ mm) Q1 2021 Net Income $36 Income Tax Expense 14 Interest Expense on Debt 3 Depreciation and Amortization 0 Other Income/Expenses (8) Adjusted EBITDA $46 Adjusted Net Revenue $102 Adjusted Operating Margin 45%