Attached files
| file | filename |
|---|---|
| 8-K - FORM 8-K - FIRST UNITED CORP/MD/ | tm2117019d1_8k.htm |
Exhibit 99.1
FIRST UNITED CORPORATION
2021 Annual Meeting of Shareholders’ Presentation
May 20, 2021
CARISSA RODEHEAVER
Slide 2: Management Presentation
Thank you, John. Good morning fellow shareholders, and welcome to First United’s 2021 Shareholders’ Meeting. I appreciate your interest in attending and for your flexibility with the virtual format again this year.
Slide 3: Forward Looking Statements
Before we begin our presentation, I would like to direct your attention to the Forward-Looking Statements Disclosure, which is displayed on the screen for your review.
Slide 4: Delivering for Stakeholders
When we met last year, we were just starting to understand the magnitude of the COVID-19 pandemic that has monopolized our lives and our businesses for over a year. Little did we know then that as 2020 progressed, our economy would come to a virtual standstill with many businesses closed, millions of employees working remotely and our hospitals overflowing with COVID patients. Not only did we experience a healthcare crisis and economic disruption, but we also faced a hugely controversial election cycle and racial and political unrest. Throughout this unprecedented time, I am proud to report that First United stood strong, supporting our associates, customers and communities through implementation of our Business Continuity Plan, participating in government sponsored loan programs, providing altered work environments for our associates and state of the art financial technology that allowed our customers to access their accounts without interruption. All the while, we proactively communicated our safety protocol and the status of our evolving operations while remaining focused on the health, safety and financial well-being of our associates and our customers.
[1]
As discussed last year, our customers and associates are integral to executing on our long-term strategy and in early 2020 your company quickly implemented processes to protect these valuable assets through our participation in the U.S. Government’s Coronavirus Aid, Relief, and Economic Security Act, better known as the CARES Act. Through the Small Business Administration Paycheck Protection Program, better known as the SBA PPP Program, the SBA provides small businesses with resources to maintain payroll, hire back employees who may have been laid off, and cover applicable overhead expenses. Through April 24, 2021, we had provided over $215 million through over 2,000 PPP loans, protecting over 18,000 jobs in our local communities. We are now actively assisting these borrowers as they navigate the forgiveness process.
Throughout 2020, we worked with our commercial and consumer borrowers to waive fees and penalties, modify loans and temporarily cease any foreclosure activity. We modified over 650 loans valued at $260 million. Through April 24, 2021 all but $5 million had returned to full principal and interest payments, a testament to the high quality of our loan portfolio. Many of these borrowers have expressed their sincere appreciation and pledged their ongoing loyalty based on our immediate and thoughtful approach. Many also said the help we provided made a profound difference in their ability to cope with the financial impact of the pandemic, in many cases, saving their businesses, protecting the livelihood of their employees and assisting many in keeping a roof over their families. We also welcomed many new customers based on our willingness to assist when they were not able to access help through their previous bank. The support we provided to customers and the non-profit associations in our markets reinforced the value of our community bank.
I said this last year, and I believe it bears repeating. Our business ties to our customers and communities will withstand the crisis, support our market presence and enhance our competitive positioning long-term. Our customers are not just “stakeholders” but are a key value driver for our shareholders.
While positioning the Company to help our customers, we were also protecting our associates with a Pandemic Pay Policy, comprehensive protocols for cleaning, adjusted lobby access at our branch network and a remote work environment for sales and support associates. We believe that enduring associate engagement will further strengthen our culture and organization well beyond this crisis.
Operating with a remote work force and shifting to many new digital platforms for our customers brought its own risks and challenges. We closely monitored this risk through our cyber security protocol to ensure the safety of our customer information. In addition, we stress tested our capital and liquidity and evaluated the higher risk industries where we have balance sheet exposure. We maintained close communication with our borrowers, monitoring cash flows and their plans to adjust operations under COVID requirements. And, we maintained strong capital and liquidity that provided protection against the uncertainties of the economic environment.
[2]
Slide 5: 2020 Highlights
2020 definitely challenged our nation as our families, friends and neighbors fought to protect their businesses, their finances and above all their health. While experiencing these same challenges, our associates continued to serve our customers, without interruption. These efforts culminated in yet another profitable year for our shareholders, producing a 7% growth in earnings per share, strong returns on average assets and average equity and an increased dividend by 30% year over year while also conservatively setting aside over $5 million in our allowance for loan losses. Pre-provision net revenue for 2020 increased 30% over 2019. Despite the early fears of weakened asset quality due to the stressed economic environment, we continued to report strong asset quality and an impressively low charge-off percentage of only .13%.
Our margin decreased as compared to 2019 due in part to the lower yielding PPP loans, a competitive low interest rate environment and deposit growth of $280 million which resulted in swelling cash balances. Increased fee income from our wealth division, strong gains on sale of mortgages to the secondary market, collection of PPP fees and heightened cost control helped to offset the margin decrease and contributed to our successful year.
Prior to the onset of COVID-19, the Company repurchased 145,219 outstanding shares, or approximately $2.7 million of our common stock, as part of a 500,000 share repurchase plan authorized by the board of directors in late 2019. As the vaccinations became more readily available and the economy showed signs of improvement early in 2021, the Board of Directors authorized a new stock repurchase plan of up to 400,000 outstanding shares of the Company’s common stock.
[3]
Slide 6: First Quarter 2021
Our solid financial performance continued in the first quarter of 2021 as our adjusted pre-provision net revenue increased by 25% to $7.9 million as compared to the fourth quarter of 2020. Income was adjusted by $3.3 million, or $2.6 million net of tax, for a one-time settlement of litigation expenses. Net income, adjusted for the litigation settlement, was $6.0 million, producing an adjusted diluted earnings per share of $.86 and strong annualized return on asset and return on equity ratios.
The continued contraction in our net interest margin to 3.11% was primarily due to the current low-rate environment and our inflated cash balances attributable to strong deposit growth in 2020 and during the first quarter of 2021. Provision expense for the quarter was minimal as our loan growth in the commercial portfolio was offset by forgiven PPP loans and the refinance of mortgage loans to the secondary market. Our wealth management department experienced a strong quarter, contributing to our increased fee income. We also collected insurance proceeds of $.4 million as a partial reimbursement of legal fees and the litigation settlement and booked $.5 million on the sale of mortgages to the secondary market, all contributing to strong fee income for the quarter. Our efficiency ratio improved significantly to 54.9%, exclusive of the one-time settlement expense. Capital and liquidity remain strong and we continue to conservatively maintain a healthy allowance for loan losses as our business customers continue to improve from the global pandemic. Given our increased net income and strong capital levels, your Board of Directors increased the quarterly dividend by 15% for the first quarter of 2021 from $.13 per share to $.15 per share.
Slide 7: Reliable Growth
Over the past five years, compound annual growth of 9.5% and 11.2% on loans and deposits, respectively, along with our robust fee income have been the backbone of our increasing profits and tangible book value per share. We have recognized a 10.5% compound annual growth rate in our pre-provision net revenue and a 6.5% compound annual growth rate in tangible book value per share.
[4]
Slide 8: Improved Profitability
First United has consistently improved its return on average assets and return on tangible common equity over the past five years, producing compound annual growth rates of 11.8% and 14.3% on ROA and ROE, respectively. This reliable growth in profitability has positioned us well to fund our future growth and allowed us to increase our quarterly dividend 66% from $.09 to $.15 per share over the past year and a half. COVID-19 caused a short-term shift in strategy; for the long-term, however, we have set strategic targets and we have plans in place to continue to enhance our growth and to lower expenses over the next several years to position us to achieve these targets.
Slide 9: Total Shareholder Return
Our stock has been somewhat volatile over the past few years, particularly in 2020 following the onset of COVID-19. The price was significantly impacted in March 2020 as the pandemic jolted the economy, the banking industry and the stock market as a whole. Given this short-term volatility, our one-year total return was under the SNL Bank Index and peers as of May 18, 2021, but, First United has outperformed the SNL Bank Index and its peer groups over the last five years, returning a 92% total shareholder return, which includes both share price appreciation and reinvested dividends. This equates to an average annual return of just over 18%.
Slide 10: Strategic and Prudent Management
As a result of and in response to the pandemic, First United quickly adapted and shifted our 2020 strategic focus. As in all economic downturns, strong capital and liquidity, maintaining loan diversification and assisting our customers through the uncertainty became priorities. We implemented strategies to offset margin compression, conservatively set aside capital to protect from potential future loan losses, promoted the expertise of our wealth management professionals, built new relationships with PPP borrowers and continued to control costs and executed on expense reduction strategies. As the economy and our local markets re-open, we are capitalizing on the operating best practices we adopted during the pandemic as we transition to what we intend to be a “new normal” operating environment. One that we believe will allow us to continue to build shareholder value.
[5]
Slide 11: Key Initiatives and Priorities
While the short-term focus shifted in 2020 and we gained valuable insight into a more efficient operating environment, our long-term initiatives and strategic priorities have been enhanced. We are focused on strategic, profitable growth opportunities in existing and new markets, capitalizing on the renewed appreciation for community banking. We will continue to hire banking talent, expand our financial and advisory center model and evaluate acquisition opportunities for both our wealth management and banking operations when appropriate. We are executing on our plans to leverage technology, restructure our operating structure, implement regional and line of business profitability metrics to better align our customer engagement efforts and ultimately enhance our efficiency and operating leverage. We plan to further penetrate our customer base, attracting new customers with our upgraded technology and continuing to expand the productivity and profitability in our branch network through focused marketing plans utilizing data analytics to increase relationship and product profitability. Greater efficiencies and improved technology combined with our uncommon commitment to service and customized approach to providing financial solutions equates to an enhanced customer experience and bottom-line profitability. We are adopting a hybrid work environment to capture efficiencies and attract and retain talent, looking for Fintech partnerships to enhance our digital financial offerings and promoting a diverse workforce and client base.
Slide 12: Risk Management
Our strategy is built on the belief that risk drives strategy. Underlying all of our strategic priorities is strong enterprise risk management. Our Board provides strong oversight in all areas of risk including asset quality, cyber-security, liquidity management, interest sensitivity and liquidity. Strong asset quality is the product of a conservative and proactive credit culture built with a foundation of disciplined loan growth, concentration management, stress testing and a well-defined underwriting structure. Our robust cyber-security and fraud program is designed and monitored to protect our customers from security breaches while still providing the digital experience and technology they desire. Capital and liquidity management are at the core or our plan, driving our strategic plan and providing guardrails for execution.
[6]
Slide 13: Investor Relations
Your senior management team and Board are routinely engaging with shareholders and prospective investors, as well as continuing our involvement in our local communities. These engagements are invaluable to us and we are using the constructive feedback provided to enhance our performance and our governance profile.
Slide 14: Thank You for Your Service
At this time, I want to recognize three of our directors for their dedication and strong commitment to our stakeholders. Ms. Elaine L. McDonald announced her retirement shortly after our annual meeting in 2020 and Mr. Gary R. Ruddell and Ms. M. Kathryn Burkey will retire at the conclusion of today’s meeting. We want to thank them for their contribution to the banking industry and to First United Bank & Trust. Congratulations and thank you for your service. Elaine, Gary and Kathy, we wish you the best in your retirement.
Slide 15: Welcome New Directors
I am also pleased to welcome three new directors who have joined our board over the past year. Ms. Patricia Milon joined the board in July of 2020, bringing expertise in the compliance and regulatory areas. Ms. Sanu Chadha joined the board in January of 2021, bringing expertise in process management, technology and cloud computing. Ms. Christy DiPietro also joined us in January bringing financial expertise in investment and wealth management. We welcome these new directors to our Board and look forward to their contribution to our board oversight of your company. Welcome Patricia, Sanu and Christy.
[7]
Slide 16: Board and Management
I also want to thank our remaining Board members for your guidance and the leadership that you provide to First United Corporation. On behalf of the Board, I would like to thank the management team and all our associates for your dedication and strong commitment to our customers, particularly as you all stood strong and faced the COVID-19 environment together, supporting our customers and communities with an uncommon commitment to service and solutions.
Slide 17: Thank You
At this time, we will address any questions that have been submitted.
Thank you for your attendance today and your investment and confidence in First United Corporation!
[8]
First United Corporation Annual Shareholders’ Meeting May 20, 2021
Carissa Rodeheaver 2 Chief Executive Officer and Chairman of the Board Management Presentation
3 Forward Looking Statements This presentation contains “forward - looking statements” within the meaning of The Private Securities Litigation Reform Act of 1995 relating to, among other things, First United Corporation’s plans, strategies, objectives, expectations, intentions and adequacy of resources. You should be aware of the speculative nature of forward - looking statements. Statements that are not historical in nature, including those that include the words “anticipate”, “estimate”, “will”, “should”, “expect”, “believe”, “intend”, and similar expressions, are based on current expectations, estimates and projections about, among other things, the industry and the markets in which we operate, and they are not guarantees of future performance. Whether actual results will conform to expectations and predictions is subject to known and unknown risks and uncertainties. Actual results could be materially different from management’s expectations. This presentation should be read in conjunction with our Annual Report on Form 10 - K for the year ended December 31, 2020 and our Quarterly Report on Form 10 - Q for the quarter ended March 31, 2021, including the sections of those reports entitled “Risk Factors”, as well as the reports and other documents that we subsequently file with the Securities and Exchange Commission (“SEC”), which are available on the SEC’s website at www.sec.gov or at our website at www.mybank.com . Except as required by law, we do not intend to publish updates or revisions of any forward - looking statements we make to reflect new information, future events or otherwise.
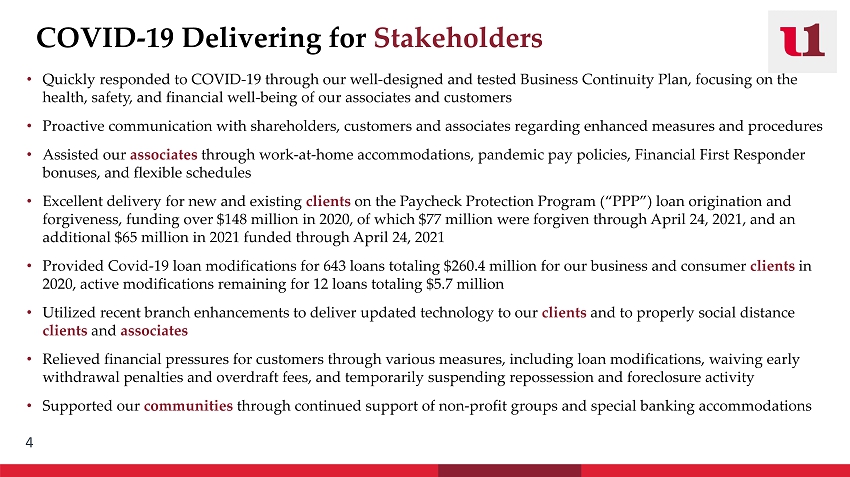
4 COVID - 19 Delivering for Stakeholders • Quickly responded to COVID - 19 through our well - designed and tested Business Continuity Plan, focusing on the health, safety, and financial well - being of our associates and customers • Proactive communication with shareholders, customers and associates regarding enhanced measures and procedures • Assisted our associates through work - at - home accommodations, pandemic pay policies, Financial First Responder bonuses, and flexible schedules • Excellent delivery for new and existing clients on the Paycheck Protection Program (“PPP”) loan origination and forgiveness, funding over $148 million in 2020, of which $77 million were forgiven through April 24, 2021, and an additional $65 million in 2021 funded through April 24, 2021 • Provided Covid - 19 loan modifications for 643 loans totaling $260.4 million for our business and consumer clients in 2020, active modifications remaining for 12 loans totaling $5.7 million • Utilized recent branch enhancements to deliver updated technology to our clients and to properly social distance clients and associates • Relieved financial pressures for customers through various measures, including loan modifications, waiving early withdrawal penalties and overdraft fees, and temporarily suspending repossession and foreclosure activity • Supported our communities through continued support of non - profit groups and special banking accommodations
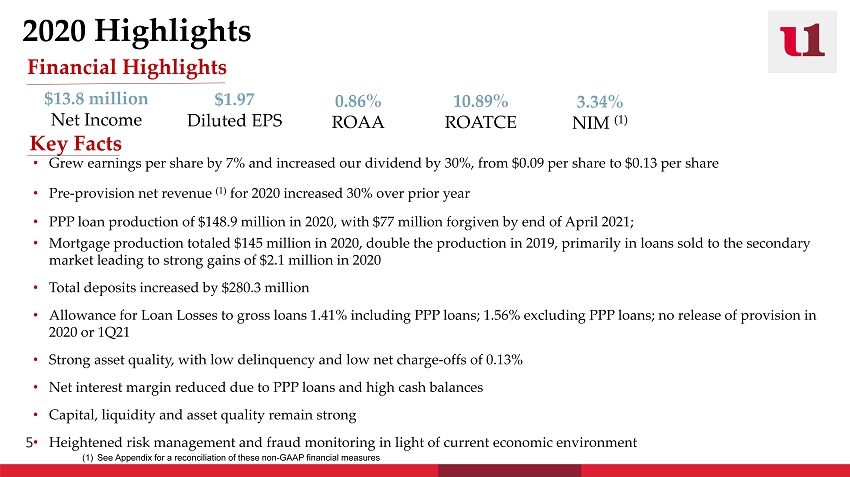
5 Key Facts Financial Highlights $13.8 million Net Income $1.97 Diluted EPS 0.86% ROAA 10.89% ROATCE 2020 Highlights • Grew earnings per share by 7% and increased our dividend by 30%, from $0.09 per share to $0.13 per share • Pre - provision net revenue (1) for 2020 increased 30% over prior year • PPP loan production of $148.9 million in 2020, with $77 million forgiven by end of April 2021; • Mortgage production totaled $145 million in 2020, double the production in 2019, primarily in loans sold to the secondary market leading to strong gains of $2.1 million in 2020 • Total deposits increased by $280.3 million • Allowance for Loan Losses to gross loans 1.41% including PPP loans; 1.56% excluding PPP loans; no release of provision in 2020 or 1Q21 • Strong asset quality, with low delinquency and low net charge - offs of 0.13% • Net interest margin reduced due to PPP loans and high cash balances • Capital, liquidity and asset quality remain strong • Heightened risk management and fraud monitoring in light of current economic environment 3.34% NIM (1) (1) See Appendix for a reconciliation of these non - GAAP financial measures
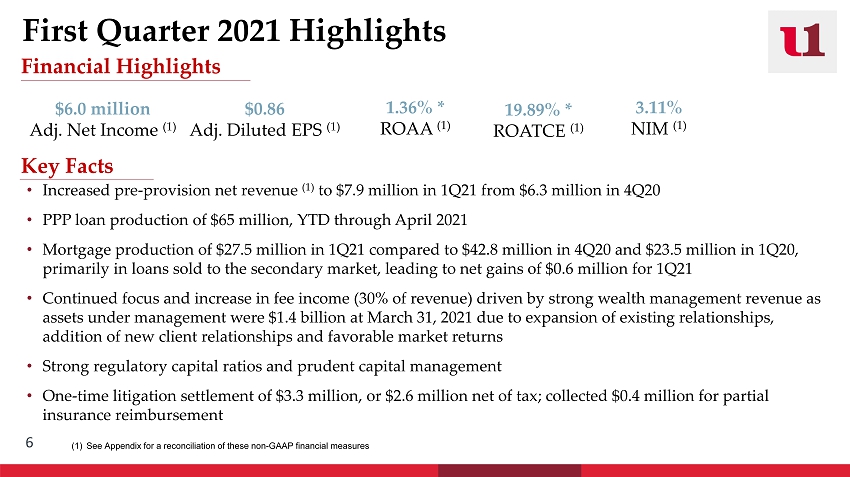
6 Financial Highlights • Increased pre - provision net revenue (1) to $7.9 million in 1Q21 from $6.3 million in 4Q20 • PPP loan production of $65 million, YTD through April 2021 • Mortgage production of $27.5 million in 1Q21 compared to $42.8 million in 4Q20 and $23.5 million in 1Q20, primarily in loans sold to the secondary market, leading to net gains of $0.6 million for 1Q21 • Continued focus and increase in fee income (30% of revenue) driven by strong wealth management revenue as assets under management were $1.4 billion at March 31, 2021 due to expansion of existing relationships, addition of new client relationships and favorable market returns • Strong regulatory capital ratios and prudent capital management • One - time litigation settlement of $3.3 million, or $2.6 million net of tax; collected $0.4 million for partial insurance reimbursement $6.0 million Adj. Net Income (1) $0.86 Adj. Diluted EPS (1) 1.36% * ROAA (1) 3.11% NIM (1) Key Facts First Quarter 2021 Highlights 19.89% * ROATCE (1) (1) See Appendix for a reconciliation of these non - GAAP financial measures
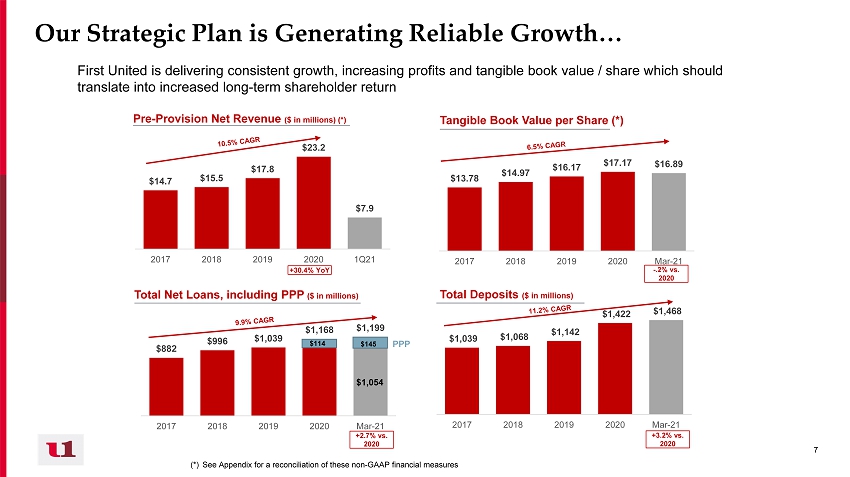
7 7 $14.7 $15.5 $17.8 $23.2 $7.9 2017 2018 2019 2020 1Q21 $1,039 $1,068 $1,142 $1,422 $1,468 2017 2018 2019 2020 Mar-21 $882 $996 $1,039 $1,168 $1,199 2017 2018 2019 2020 Mar-21 $1,054 Our Strategic Plan is Generating Reliable Growth… Pre - Provision Net Revenue ($ in millions) (*) Tangible Book Value per Share (*) Total Deposits ($ in millions) Total Net Loans, including PPP ($ in millions) First United is delivering consistent growth, increasing profits and tangible book value / share which should translate into increased long - term shareholder return $13.78 $14.97 $16.17 $17.17 $16.89 2017 2018 2019 2020 Mar-21 +30.4% YoY - .2% vs. 2020 +2.7% vs. 2020 +3.2% vs. 2020 $145 PPP $114 (*) See Appendix for a reconciliation of these non - GAAP financial measures
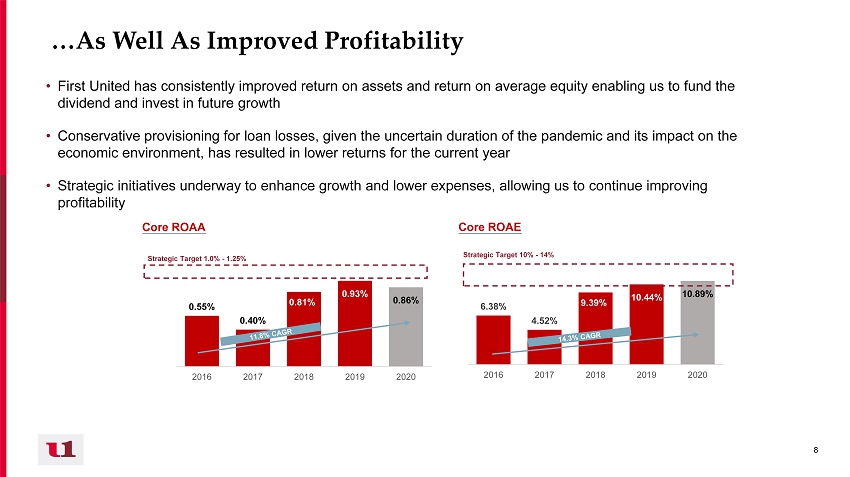
8 8 6.38% 4.52% 9.39% 10.44% 10.89% 2016 2017 2018 2019 2020 0.55% 0.40% 0.81% 0.93% 0.86% 2016 2017 2018 2019 2020 …As Well As Improved Profitability • First United has consistently improved return on assets and return on average equity enabling us to fund the dividend and invest in future growth • Conservative provisioning for loan losses, given the uncertain duration of the pandemic and its impact on the economic environment, has resulted in lower returns for the current year • Strategic initiatives underway to enhance growth and lower expenses, allowing us to continue improving profitability Core ROAE Core ROAA Strategic Target 1.0% - 1.25% Strategic Target 10% - 14%
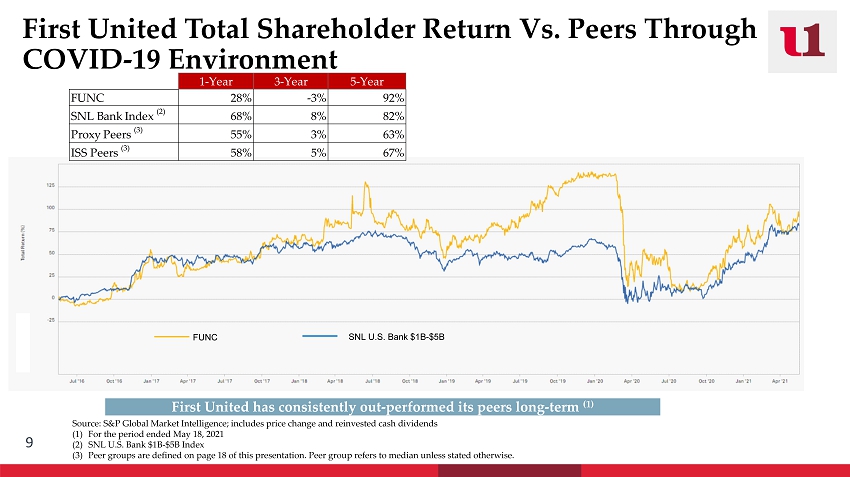
9 First United Total Shareholder Return Vs. Peers Through COVID - 19 Environment First United has consistently out - performed its peers long - term (1) Source: S&P Global Market Intelligence; includes price change and reinvested cash dividends (1) For the period ended May 18, 2021 (2) SNL U.S. Bank $1B - $5B Index (3) Peer groups are defined on page 18 of this presentation. Peer group refers to median unless stated otherwise. FUNC SNL U.S. Bank $1B - $5B 1-Year 3-Year 5-Year FUNC 28% -3% 92% SNL Bank Index (2) 68% 8% 82% Proxy Peers (3) 55% 3% 63% ISS Peers (3) 58% 5% 67%
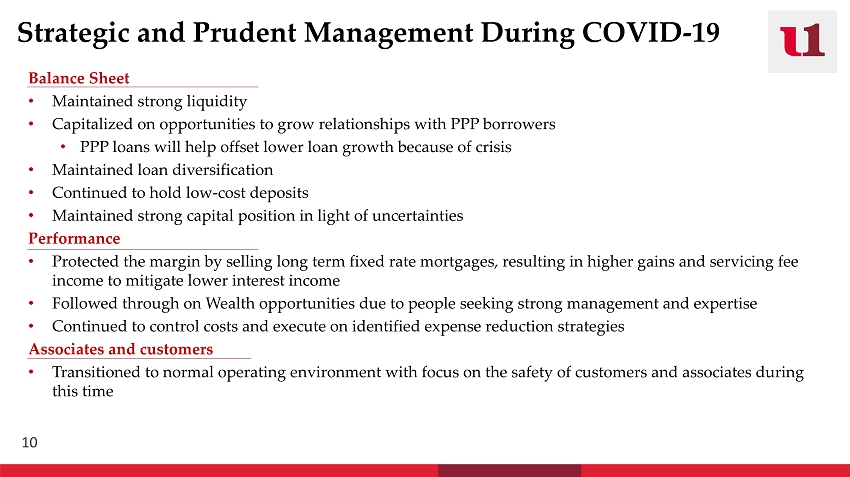
10 Strategic and Prudent Management During COVID - 19 Balance Sheet • Maintained strong liquidity • Capitalized on opportunities to grow relationships with PPP borrowers • PPP loans will help offset lower loan growth because of crisis • Maintained loan diversification • Continued to hold low - cost deposits • Maintained strong capital position in light of uncertainties Performance • Protected the margin by selling long term fixed rate mortgages, resulting in higher gains and servicing fee income to mitigate lower interest income • Followed through on Wealth opportunities due to people seeking strong management and expertise • Continued to control costs and execute on identified expense reduction strategies Associates and customers • Transitioned to normal operating environment with focus on the safety of customers and associates during this time
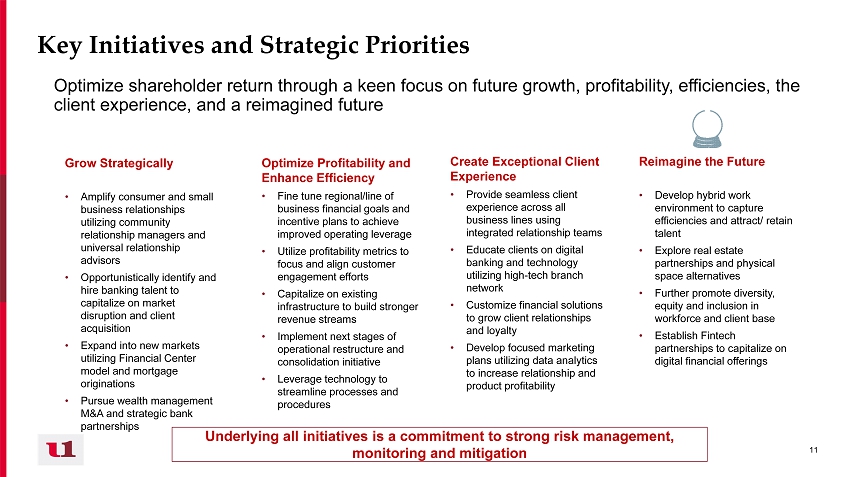
11 11 Key Initiatives and Strategic Priorities Optimize shareholder return through a keen focus on future growth, profitability, efficiencies, the client experience, and a reimagined future Create Exceptional Client Experience • Provide seamless client experience across all business lines using integrated relationship teams • Educate clients on digital banking and technology utilizing high - tech branch network • Customize financial solutions to grow client relationships and loyalty • Develop focused marketing plans utilizing data analytics to increase relationship and product profitability Grow Strategically • Amplify consumer and small business relationships utilizing community relationship managers and universal relationship advisors • Opportunistically identify and hire banking talent to capitalize on market disruption and client acquisition • Expand into new markets utilizing Financial Center model and mortgage originations • Pursue wealth management M&A and strategic bank partnerships Optimize Profitability and Enhance Efficiency • Fine tune regional/line of business financial goals and incentive plans to achieve improved operating leverage • Utilize profitability metrics to focus and align customer engagement efforts • Capitalize on existing infrastructure to build stronger revenue streams • Implement next stages of operational restructure and consolidation initiative • Leverage technology to streamline processes and procedures Underlying all initiatives is a commitment to strong risk management, monitoring and mitigation Reimagine the Future • Develop hybrid work environment to capture efficiencies and attract/ retain talent • Explore real estate partnerships and physical space alternatives • Further promote diversity, equity and inclusion in workforce and client base • Establish Fintech partnerships to capitalize on digital financial offerings
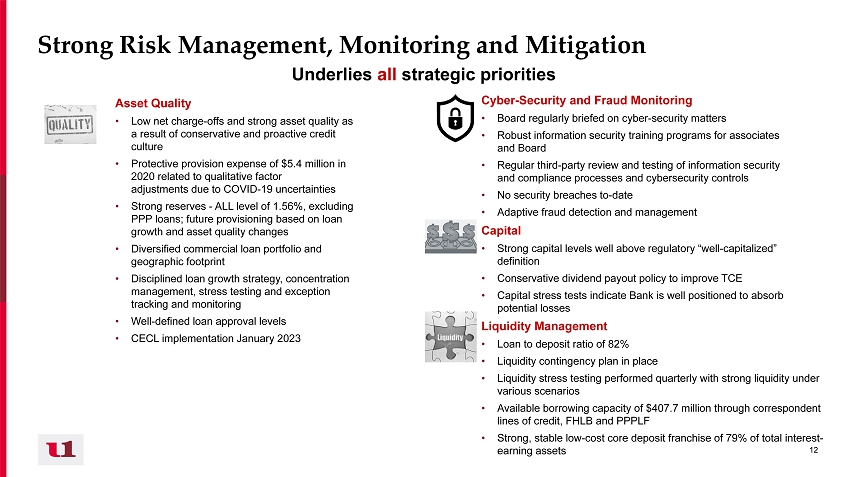
12 12 Strong Risk Management, Monitoring and Mitigation Underlies all strategic priorities Asset Quality • Low net charge - offs and strong asset quality as a result of conservative and proactive credit culture • Protective provision expense of $5.4 million in 2020 related to qualitative factor adjustments due to COVID - 19 uncertainties • Strong reserves - ALL level of 1.56%, excluding PPP loans; future provisioning based on loan growth and asset quality changes • Diversified commercial loan portfolio and geographic footprint • Disciplined loan growth strategy, concentration management, stress testing and exception tracking and monitoring • Well - defined loan approval levels • CECL implementation January 2023 Liquidity Management • Loan to deposit ratio of 82% • Liquidity contingency plan in place • Liquidity stress testing performed quarterly with strong liquidity under various scenarios • Available borrowing capacity of $407.7 million through correspondent lines of credit, FHLB and PPPLF • Strong, stable low - cost core deposit franchise of 79% of total interest - earning assets Capital • Strong capital levels well above regulatory “well - capitalized” definition • Conservative dividend payout policy to improve TCE • Capital stress tests indicate Bank is well positioned to absorb potential losses Cyber - Security and Fraud Monitoring • Board regularly briefed on cyber - security matters • Robust information security training programs for associates and Board • Regular third - party review and testing of information security and compliance processes and cybersecurity controls • No security breaches to - date • Adaptive fraud detection and management
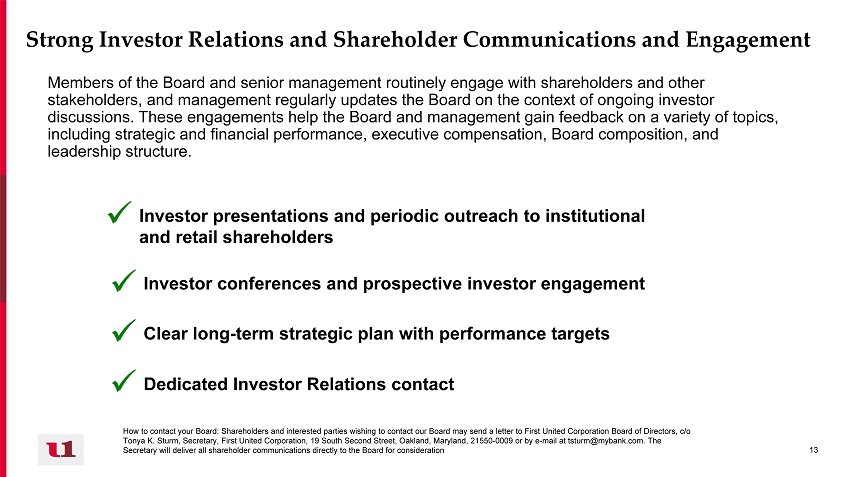
13 13 Strong Investor Relations and Shareholder Communications and Engagement Clear long - term strategic plan with performance targets x Dedicated Investor Relations contact x Investor conferences and prospective investor engagement x Members of the Board and senior management routinely engage with shareholders and other stakeholders, and management regularly updates the Board on the context of ongoing investor discussions. These engagements help the Board and management gain feedback on a variety of topics, including strategic and financial performance, executive compensation, Board composition, and leadership structure. Investor presentations and periodic outreach to institutional and retail shareholders x How to contact your Board: Shareholders and interested parties wishing to contact our Board may send a letter to First United Co rporation Board of Directors, c/o Tonya K. Sturm, Secretary, First United Corporation, 19 South Second Street, Oakland, Maryland, 21550 - 0009 or by e - mail at tstur m@mybank.com. The Secretary will deliver all shareholder communications directly to the Board for consideration

Thank You For Your Service! 14 M. Kathryn Burkey Director Gary R. Ruddell Director Elaine L. McDonald Director

Welcome to Our New Directors! 15 Sanu B. Chadha Director Patricia A. Milon Director Christy M. DiPietro Director
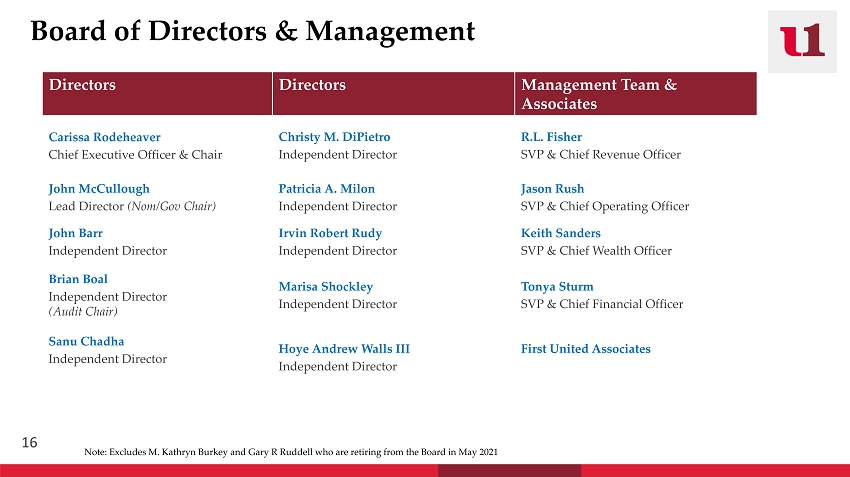
16 Board of Directors & Management Note: Excludes M. Kathryn Burkey and Gary R Ruddell who are retiring from the Board in May 2021 Directors Directors Management Team & Associates Carissa Rodeheaver Chief Executive Officer & Chair Christy M. DiPietro Independent Director R.L. Fisher SVP & Chief Revenue Officer John McCullough Lead Director (Nom/ Gov Chair) Patricia A. Milon Independent Director Jason Rush SVP & Chief Operating Officer John Barr Independent Director Irvin Robert Rudy Independent Director Keith Sanders SVP & Chief Wealth Officer Brian Boal Independent Director (Audit Chair) Marisa Shockley Independent Director Tonya Sturm SVP & Chief Financial Officer Sanu Chadha Independent Director Hoye Andrew Walls III Independent Director First United Associates
“My bank is First United!” 17 Thank You!
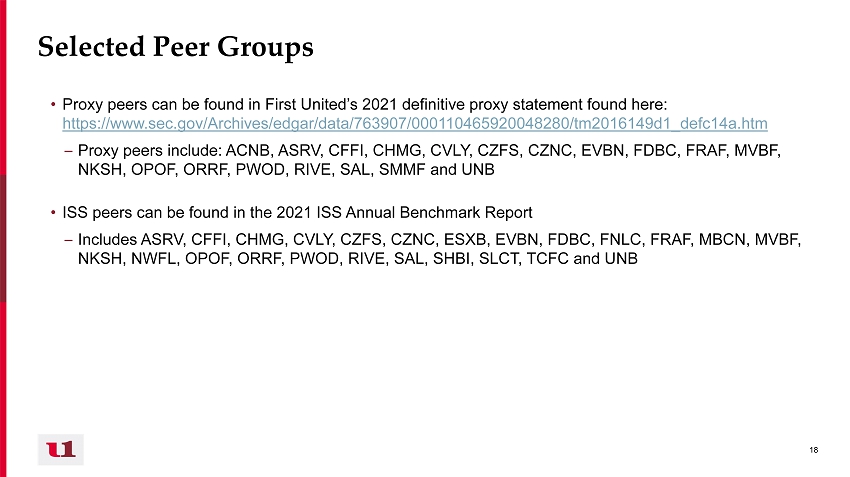
18 18 Selected Peer Groups • Proxy peers can be found in First United’s 2021 definitive proxy statement found here: https://www.sec.gov/Archives/edgar/data/763907/000110465920048280/tm2016149d1_defc14a.htm – Proxy peers include: ACNB, ASRV, CFFI, CHMG, CVLY, CZFS, CZNC, EVBN, FDBC, FRAF, MVBF, NKSH, OPOF, ORRF, PWOD, RIVE, SAL, SMMF and UNB • ISS peers can be found in the 2021 ISS Annual Benchmark Report – Includes ASRV, CFFI, CHMG, CVLY, CZFS, CZNC, ESXB, EVBN, FDBC, FNLC, FRAF, MBCN, MVBF, NKSH, NWFL, OPOF, ORRF, PWOD, RIVE, SAL, SHBI, SLCT, TCFC and UNB
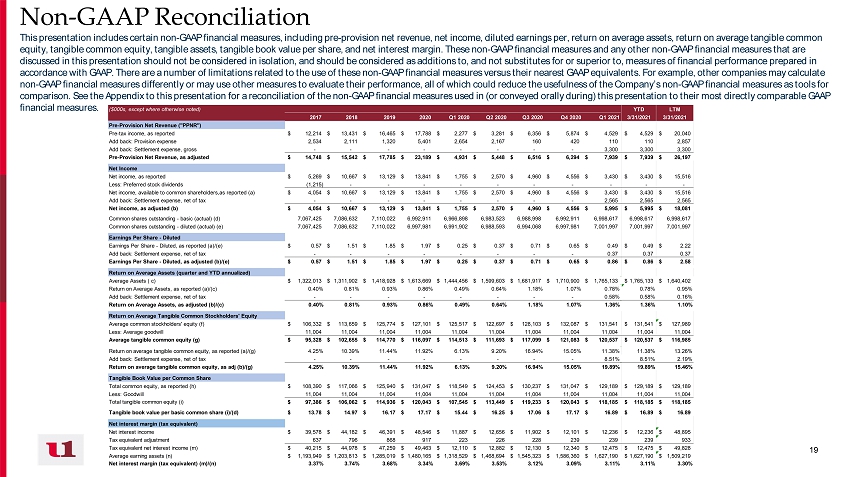
19 19 Non - GAAP Reconciliation This presentation includes certain non - GAAP financial measures, including pre - provision net revenue, net income, diluted earning s per, return on average assets, return on average tangible common equity, tangible common equity, tangible assets, tangible book value per share, and net interest margin. These non - GAAP financia l measures and any other non - GAAP financial measures that are discussed in this presentation should not be considered in isolation, and should be considered as additions to, and not subst itu tes for or superior to, measures of financial performance prepared in accordance with GAAP. There are a number of limitations related to the use of these non - GAAP financial measures versus their nea rest GAAP equivalents. For example, other companies may calculate non - GAAP financial measures differently or may use other measures to evaluate their performance, all of which could reduce the u sefulness of the Company’s non - GAAP financial measures as tools for comparison. See the Appendix to this presentation for a reconciliation of the non - GAAP financial measures used in (or conveyed o rally during) this presentation to their most directly comparable GAAP financial measures. ($000s, except where otherwise noted) YTD LTM 2017 2018 2019 2020 Q1 2020 Q2 2020 Q3 2020 Q4 2020 Q1 2021 3/31/2021 3/31/2021 Pre-Provision Net Revenue ("PPNR") Pre-tax income, as reported 12,214$ 13,431$ 16,465$ 17,788$ 2,277$ 3,281$ 6,356$ 5,874$ 4,529$ 4,529$ 20,040$ Add back: Provision expense 2,534 2,111 1,320 5,401 2,654 2,167 160 420 110 110 2,857 Add back: Settlement expense, gross - - - - - - - - 3,300 3,300 3,300 Pre-Provision Net Revenue, as adjusted 14,748$ 15,542$ 17,785$ 23,189$ 4,931$ 5,448$ 6,516$ 6,294$ 7,939$ 7,939$ 26,197$ Net Income Net income, as reported 5,269$ 10,667$ 13,129$ 13,841$ 1,755$ 2,570$ 4,960$ 4,556$ 3,430$ 3,430$ 15,516$ Less: Preferred stock dividends (1,215) - - - - - - - - - - Net income, available to common shareholders,as reported (a) 4,054$ 10,667$ 13,129$ 13,841$ 1,755$ 2,570$ 4,960$ 4,556$ 3,430$ 3,430$ 15,516$ Add back: Settlement expense, net of tax - - - - - - - - 2,565 2,565 2,565 Net income, as adjusted (b) 4,054$ 10,667$ 13,129$ 13,841$ 1,755$ 2,570$ 4,960$ 4,556$ 5,995$ 5,995$ 18,081$ Common shares outstanding - basic (actual) (d) 7,067,425 7,086,632 7,110,022 6,992,911 6,966,898 6,983,523 6,988,998 6,992,911 6,998,617 6,998,617 6,998,617 Common shares outstanding - diluted (actual) (e) 7,067,425 7,086,632 7,110,022 6,997,981 6,991,902 6,988,593 6,994,068 6,997,981 7,001,997 7,001,997 7,001,997 Earnings Per Share - Diluted Earnings Per Share - Diluted, as reported (a)/(e) 0.57$ 1.51$ 1.85$ 1.97$ 0.25$ 0.37$ 0.71$ 0.65$ 0.49$ 0.49$ 2.22$ Add back: Settlement expense, net of tax - - - - - - - - 0.37 0.37 0.37 Earnings Per Share - Diluted, as adjusted (b)/(e) 0.57$ 1.51$ 1.85$ 1.97$ 0.25$ 0.37$ 0.71$ 0.65$ 0.86$ 0.86$ 2.58$ Return on Average Assets (quarter and YTD annualized) Average Assets ( c) 1,322,013$ 1,311,902$ 1,418,928$ 1,613,669$ 1,444,456$ 1,599,603$ 1,681,917$ 1,710,900$ 1,765,133$ 1,765,133$ 1,640,402$ Return on Average Assets, as reported (a)/(c) 0.40% 0.81% 0.93% 0.86% 0.49% 0.64% 1.18% 1.07% 0.78% 0.78% 0.95% Add back: Settlement expense, net of tax - - - - - - - - 0.58% 0.58% 0.16% Return on Average Assets, as adjusted (b)/(c) 0.40% 0.81% 0.93% 0.86% 0.49% 0.64% 1.18% 1.07% 1.36% 1.36% 1.10% Return on Average Tangible Common Stockholders' Equity Average common stockholders' equity (f) 106,332$ 113,659$ 125,774$ 127,101$ 125,517$ 122,697$ 128,103$ 132,087$ 131,541$ 131,541$ 127,989$ Less: Average goodwill 11,004 11,004 11,004 11,004 11,004 11,004 11,004 11,004 11,004 11,004 11,004 Average tangible common equity (g) 95,328$ 102,655$ 114,770$ 116,097$ 114,513$ 111,693$ 117,099$ 121,083$ 120,537$ 120,537$ 116,985$ Return on average tangible common equity, as reported (a)/(g) 4.25% 10.39% 11.44% 11.92% 6.13% 9.20% 16.94% 15.05% 11.38% 11.38% 13.26% Add back: Settlement expense, net of tax - - - - - - - - 8.51% 8.51% 2.19% Return on average tangible common equity, as adj (b)/(g) 4.25% 10.39% 11.44% 11.92% 6.13% 9.20% 16.94% 15.05% 19.89% 19.89% 15.46% Tangible Book Value per Common Share Total common equity, as reported (h) 108,390$ 117,066$ 125,940$ 131,047$ 118,549$ 124,453$ 130,237$ 131,047$ 129,189$ 129,189$ 129,189$ Less: Goodwill 11,004 11,004 11,004 11,004 11,004 11,004 11,004 11,004 11,004 11,004 11,004 Total tangible common equity (i) 97,386$ 106,062$ 114,936$ 120,043$ 107,545$ 113,449$ 119,233$ 120,043$ 118,185$ 118,185$ 118,185$ Tangible book value per basic common share (i)/(d) 13.78$ 14.97$ 16.17$ 17.17$ 15.44$ 16.25$ 17.06$ 17.17$ 16.89$ 16.89$ 16.89$ Net interest margin (tax equivalent) Net interest income 39,578$ 44,182$ 46,391$ 48,546$ 11,887$ 12,656$ 11,902$ 12,101$ 12,236$ 12,236$ 48,895$ Tax equivalent adjustment 637 796 868 917 223 226 228 239 239 239 933 Tax equivalent net interest income (m) 40,215$ 44,978$ 47,259$ 49,463$ 12,110$ 12,882$ 12,130$ 12,340$ 12,475$ 12,475$ 49,828$ Average earning assets (n) 1,193,949$ 1,203,813$ 1,285,019$ 1,480,165$ 1,318,529$ 1,468,694$ 1,545,323$ 1,586,360$ 1,627,190$ 1,627,190$ 1,509,219$ Net interest margin (tax equivalent) (m)/(n) 3.37% 3.74% 3.68% 3.34% 3.69% 3.53% 3.12% 3.09% 3.11% 3.11% 3.30%