Attached files
| file | filename |
|---|---|
| 8-K - FORM 8-K - FVCBankcorp, Inc. | tm2116514d1_8k.htm |
Exhibit 99.1
 |
NASDAQ: FVCB 2021 Annual Shareholders’ Meeting May 19, 2021 |
 |
Forward-Looking Statements; Non-GAAP Information This presentation contains forward-looking statements within the meaning of Section 27A of the Securities Act of 1933, as amended, and Section 21E of the Securities Exchange Act of 1934, as amended, including statements of goals, intentions, and expectations as to future trends, plans, events or the results of operations and policies of FVCBankcorp, Inc. (“FVCB”) and regarding general economic conditions. These forward-looking statements include, but are not limited to, statements about (i) FVCB’s plans, obligations, expectations and intentions and (ii) other statements that are not historical facts. In some cases, forward-looking statements can be identified by use of words such as “may,” “will,” “anticipates,” “believes,” “expects,” “plans,” “estimates,” “potential,” “continue,” “should,” and similar words or phrases. These statements are based upon the expectations, beliefs and assumptions of the management of FVCB as to the expected outcomes of future events, current and anticipated economic conditions, nationally and in FVCB’s markets, and their impact on the operations and assets of FVCB, interest rates and interest rate policy, competitive factors and other conditions which by their nature, are not susceptible to accurate forecast and are subject to significant risks and uncertainties. Factors that could cause results and outcomes to differ materially include, among others, expected growth opportunities; changes in FVCB’s operating or expansion strategy; availability of and costs associated with obtaining timely sources of liquidity, the ability to maintain credit quality, possible adverse rulings, judgments, settlements and other outcomes of pending litigation, the ability of FVCB to collect amounts due under loan agreements, changes in consumer preferences, effectiveness of FVCB’s interest rate risk management strategies, laws and regulations affecting financial institutions in general or relating to taxes, the effect of pending or future legislation, changes in interest rates and capital markets, inflation, customer borrowing, repayment, investment and deposit practices; customer disintermediation; the introduction, withdrawal, success and timing of business initiatives; competitive conditions and other risk factors described in FVCB’s filings with the SEC. For a discussion of these and other factors, please review the “Cautionary Note Regarding Forward-Looking Statements” and “Risk Factors” in FVCB’s Annual Report on Form 10-K for the year ended December 31, 2020. Because of these uncertainties and the assumptions on which this discussion and the forward-looking statements are based, actual future operations and results in the future may differ materially from those indicated herein. Readers are cautioned against placing undue reliance on such forward-looking statements. Past results are not necessarily indicative of future performance. FVCB assumes no obligation to revise, update, or clarify forward-looking statements to reflect events or conditions after the date of this release. Use of Non-GAAP Financial Measures This presentation includes certain financial information that is calculated and presented on the basis of methodologies that are not in accordance with U.S. Generally Accepted Accounting Principles (“GAAP”). These non-GAAP financial measures include pre-tax pre-provision return on average assets, pre-tax pre-provision return on average equity, tangible book value, tangible common equity, tangible assets and efficiency ratio. The non-GAAP financial measures included in this presentation do not replace the presentation of FVCB’s GAAP financial results, should not be considered as a substitute for operating results determined in accordance with GAAP and may not be comparable to other similarly titled measures of other companies. These measurements provide supplemental information to assist management, as well as certain investors, in analyzing FVCB’s core business, capital position and results of operations. FVCB has chosen to provide this additional information to investors because it believes that these measures are meaningful in assisting investors to evaluate FVCB’s core ongoing operations, results and financial condition. Reconciliations of the non-GAAP financial measures provided in this presentation to the most directly comparable GAAP measures can be found in the appendix of this presentation. |
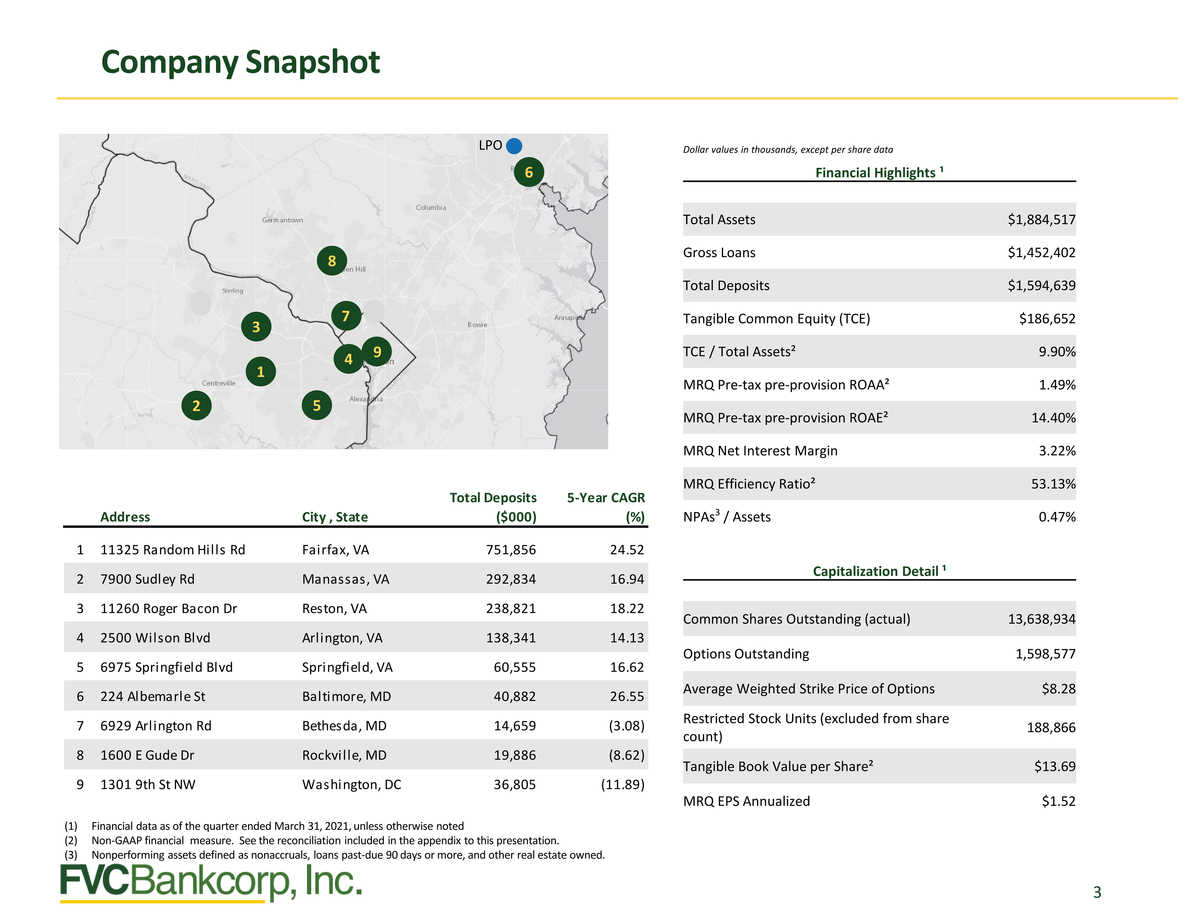 |
LPO 6 8 3 7 9 1 4 2 5 Financial Highlights ¹ Total Assets $1,884,517 Gross Loans$1,452,402 Total Deposits$1,594,639 Tangible Common Equity (TCE)$186,652 TCE / Total Assets²9.90% MRQ Pre-tax pre-provision ROAA²1.49% MRQ Pre-tax pre-provision ROAE²14.40% MRQ Efficiency Ratio²53.13% AddressCity , State Total Deposits ($000) Year CAGR (%) NPAs3 / Assets0.47% 2 7900 Sudley Rd Manassas, VA 292,834 16.94 Capitalization Detail ¹ Common Shares Outstanding (actual)13,638,934 Options Outstanding1,598,577 Average Weighted Strike Price of Options$8.28 3 11260 Roger Bacon Dr Reston, VA 238,821 18.22 4 2500 Wilson Blvd Arlington, VA 138,341 14.13 5 6975 Springfield Blvd Springfield, VA 60,555 16.62 6 224 Albemarle St Baltimore, MD 40,882 26.55 7 6929 Arlington Rd Bethesda, MD 14,659 (3.08) Restricted Stock Units (excluded from share count)188,866 81600 E Gude DrRockville, MD19,886(8.62) 91301 9th St NWWashington, DC36,805(11.89) Tangible Book Value per Share²$13.69 MRQ EPS Annualized$1.52 |
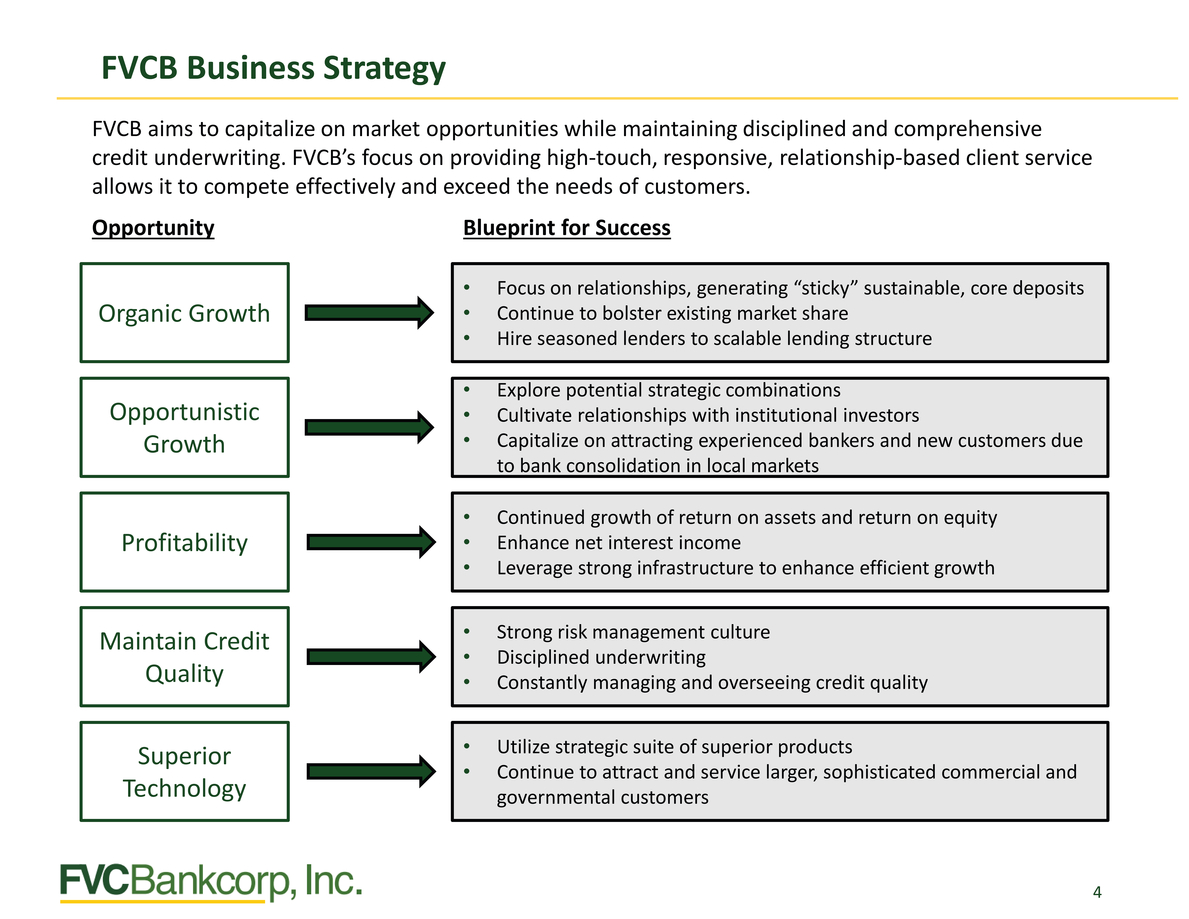 |
FVCB aims to capitalize on market opportunities while maintaining disciplined and comprehensive credit underwriting. FVCB’s focus on providing high-touch, responsive, relationship-based client service allows it to compete effectively and exceed the needs of customers. OpportunityBlueprint for Success Organic Growth Focus on relationships, generating “sticky” sustainable, core deposits Continue to bolster existing market share Hire seasoned lenders to scalable lending structure Opportunistic Growth Explore potential strategic combinations Cultivate relationships with institutional investors Capitalize on attracting experienced bankers and new customers due to bank consolidation in local markets Profitability Continued growth of return on assets and return on equity Enhance net interest income Leverage strong infrastructure to enhance efficient growth Maintain Credit Quality Strong risk management culture Disciplined underwriting Constantly managing and overseeing credit quality Superior Technology Utilize strategic suite of superior products Continue to attract and service larger, sophisticated commercial and governmental customers |
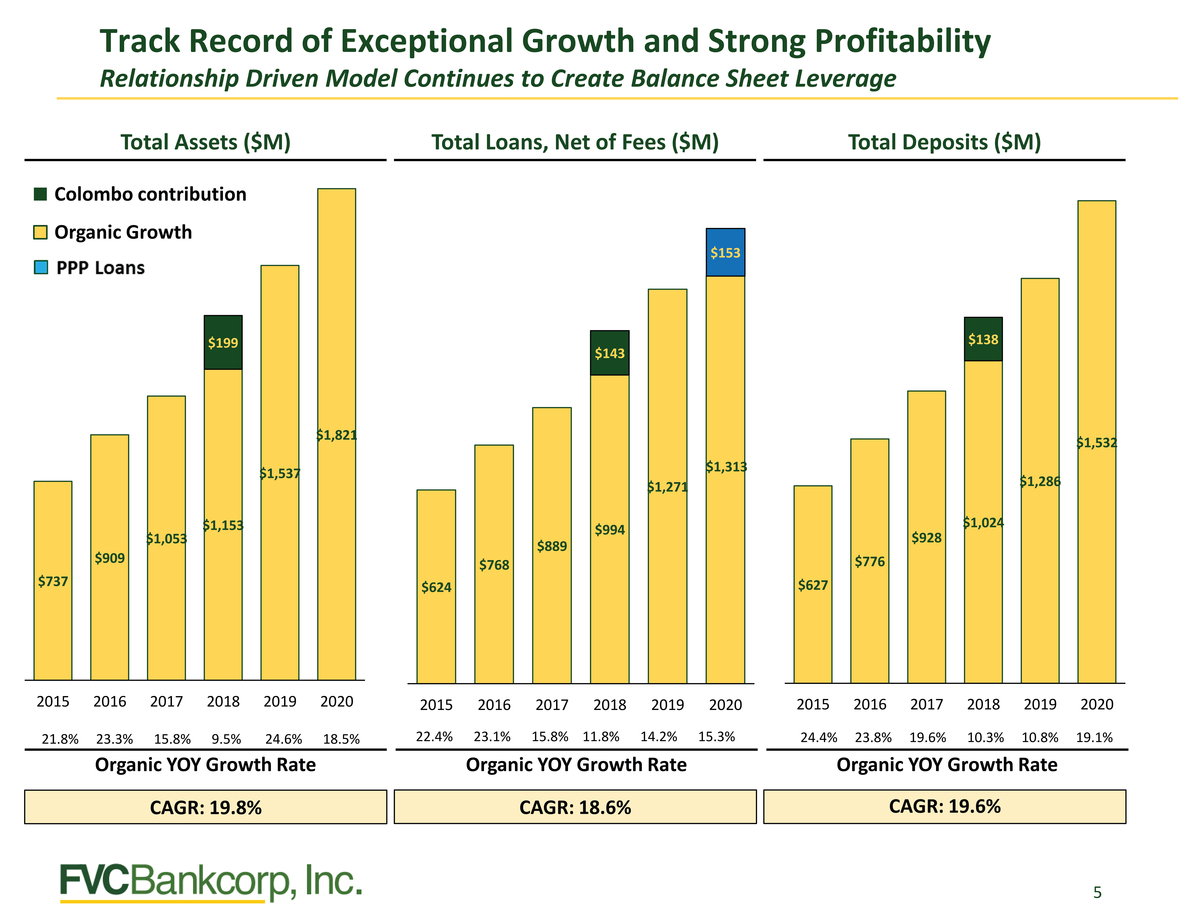 |
$1,821 $1,537 $199 $1,153 $1,053 $909 $737 Colombo contribution Organic Growth $1,532 $1,286 $138 $1,024 $928 $776 $627 $153 $1,271 $143 $994 $889 $768 $624 |
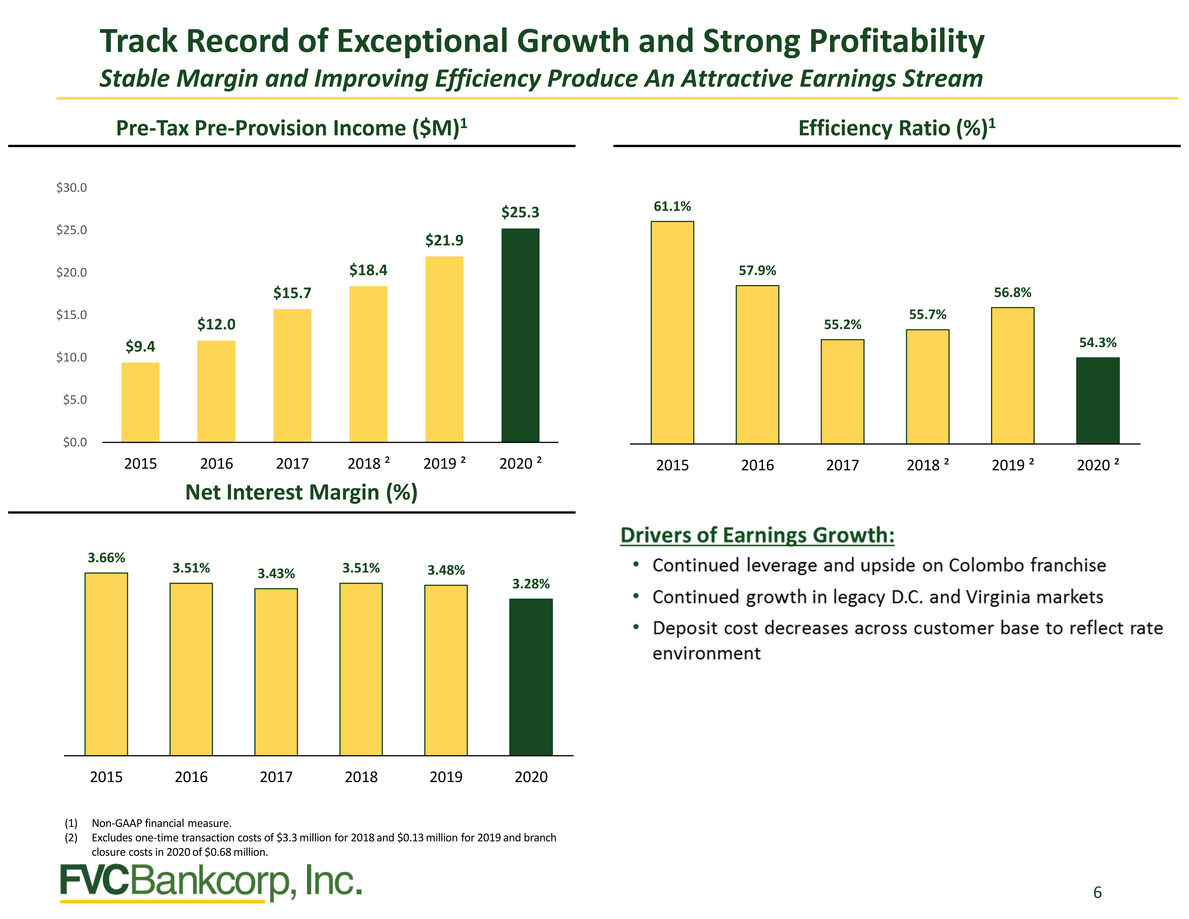 |
Pre-Tax Pre-Provision Income ($M)1Efficiency Ratio (%)1 $30.0 61.1% 57.9% 56.8% 55.2% 55.7% 54.3% $21.9 $18.4 $15.7 $12.0 $9.4 $15.0 $10.0 $5.0 $0.0 2015201620172018 ²2019 ²2020 ² 3.51% 3.43% 3.51% 3.48% 3.28% 201520162017201820192020 2015201620172018 ²2019 ²2020 ² Non-GAAP financial measure. Excludes one-time transaction costs of $3.3 million for 2018 and $0.13 million for 2019 and branch closure costs in 2020 of $0.68 million. |
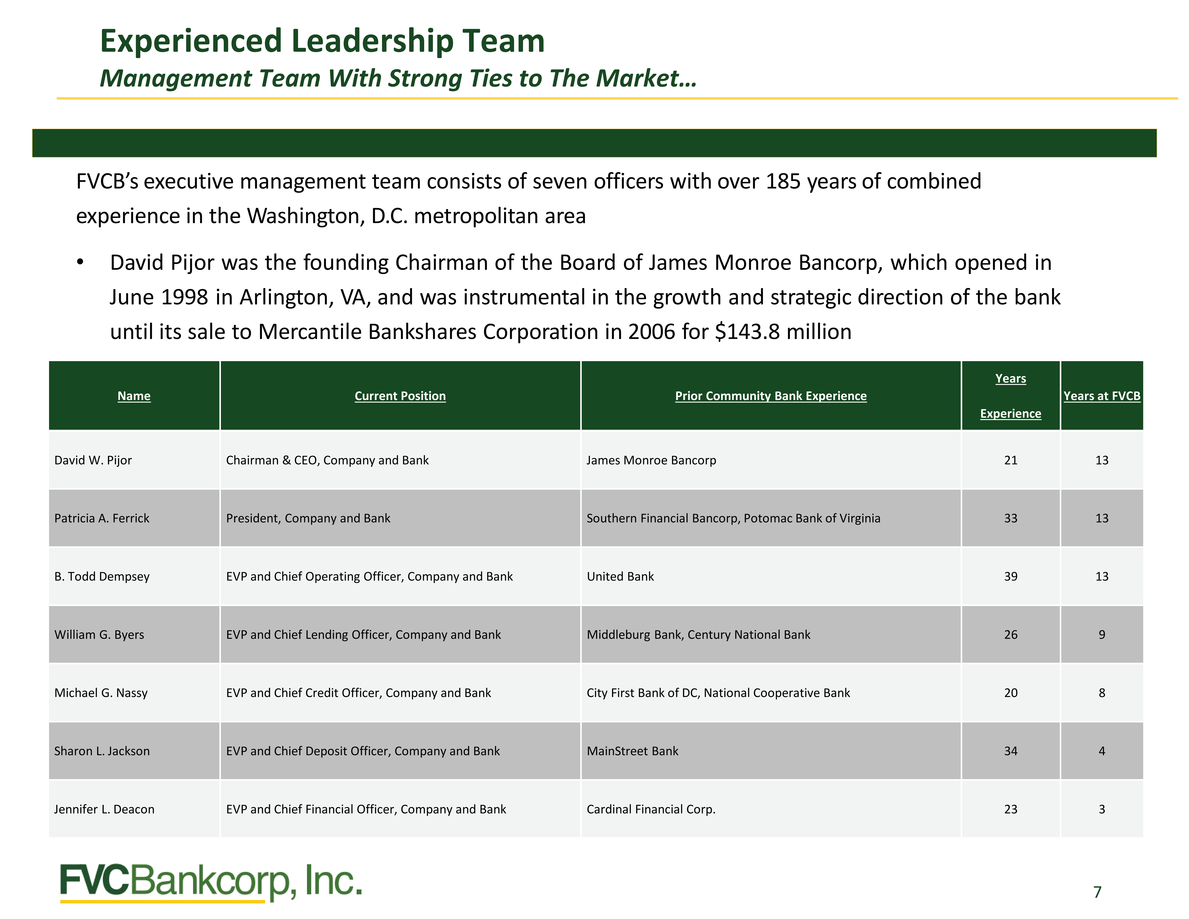 |
FVCB’s executive management team consists of seven officers with over 185 years of combined experience in the Washington, D.C. metropolitan area David Pijor was the founding Chairman of the Board of James Monroe Bancorp, which opened in June 1998 in Arlington, VA, and was instrumental in the growth and strategic direction of the bank until its sale to Mercantile Bankshares Corporation in 2006 for $143.8 million |
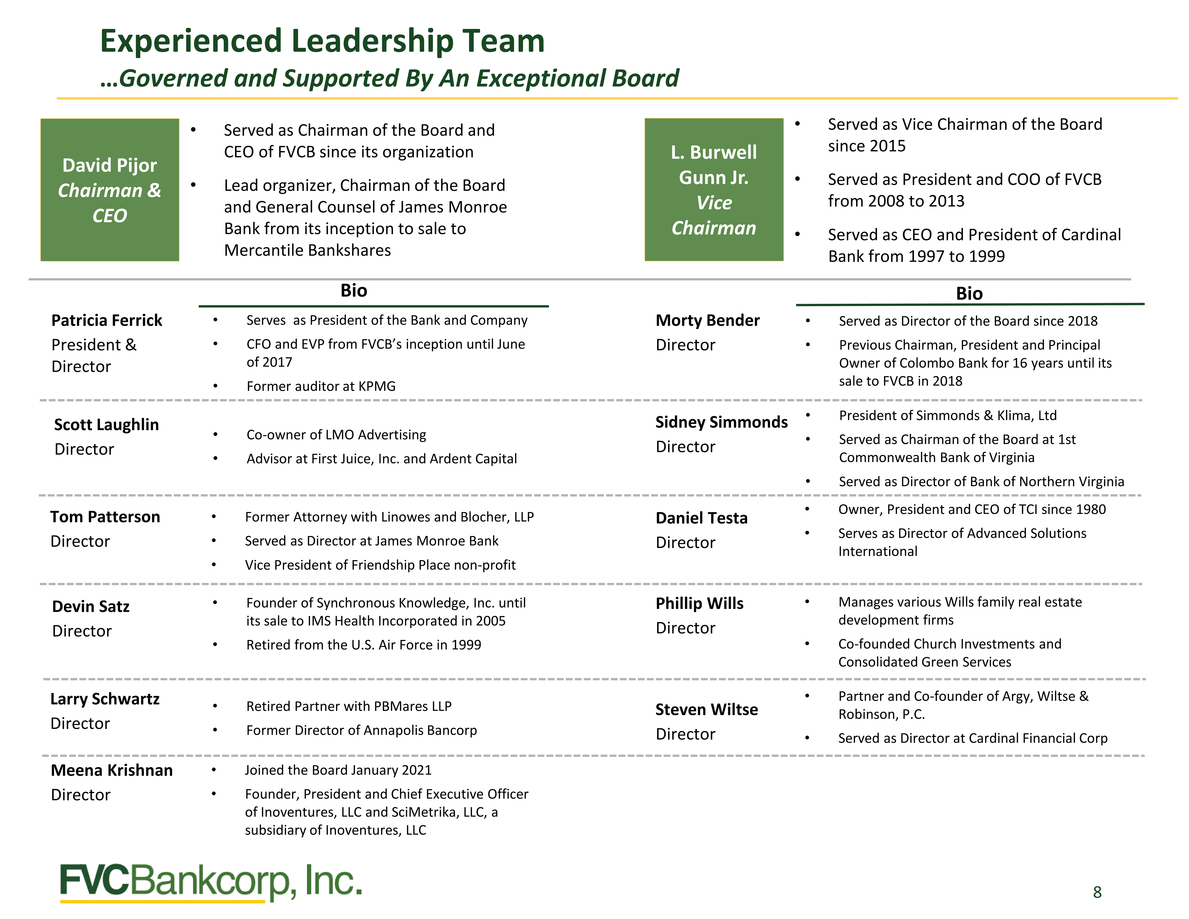 |
David Pijor Chairman & CEO Lead organizer, Chairman of the Board and General Counsel of James Monroe Bank from its inception to sale to Mercantile Bankshares Served as Vice Chairman of the Board since 2015 L. Burwell Gunn Jr. Vice Chairman Served as CEO and President of Cardinal Bank from 1997 to 1999 BioBio Patricia Ferrick President & Director Scott Laughlin Director Tom Patterson Director Devin Satz Director Larry Schwartz Director Meena Krishnan Director •Serves as President of the Bank and Company •CFO and EVP from FVCB’s inception until June of 2017 •Former auditor at KPMG •Co-owner of LMO Advertising •Advisor at First Juice, Inc. and Ardent Capital •Former Attorney with Linowes and Blocher, LLP •Served as Director at James Monroe Bank •Vice President of Friendship Place non-profit •Founder of Synchronous Knowledge, Inc. until its sale to IMS Health Incorporated in 2005 •Retired from the U.S. Air Force in 1999 •Retired Partner with PBMares LLP •Former Director of Annapolis Bancorp •Joined the Board January 2021 •Founder, President and Chief Executive Officer of Inoventures, LLC and SciMetrika, LLC, a subsidiary of Inoventures, LLC Morty Bender Director Sidney Simmonds Director Daniel Testa Director Phillip Wills Director Steven Wiltse Director Served as Director of the Board since 2018 Previous Chairman, President and Principal Owner of Colombo Bank for 16 years until its sale to FVCB in 2018 President of Simmonds & Klima, Ltd Served as Chairman of the Board at 1st Commonwealth Bank of Virginia Served as Director of Bank of Northern Virginia Owner, President and CEO of TCI since 1980 Serves as Director of Advanced Solutions International Manages various Wills family real estate development firms Co-founded Church Investments and Consolidated Green Services Partner and Co-founder of Argy, Wiltse & Robinson, P.C. Served as Director at Cardinal Financial Corp |
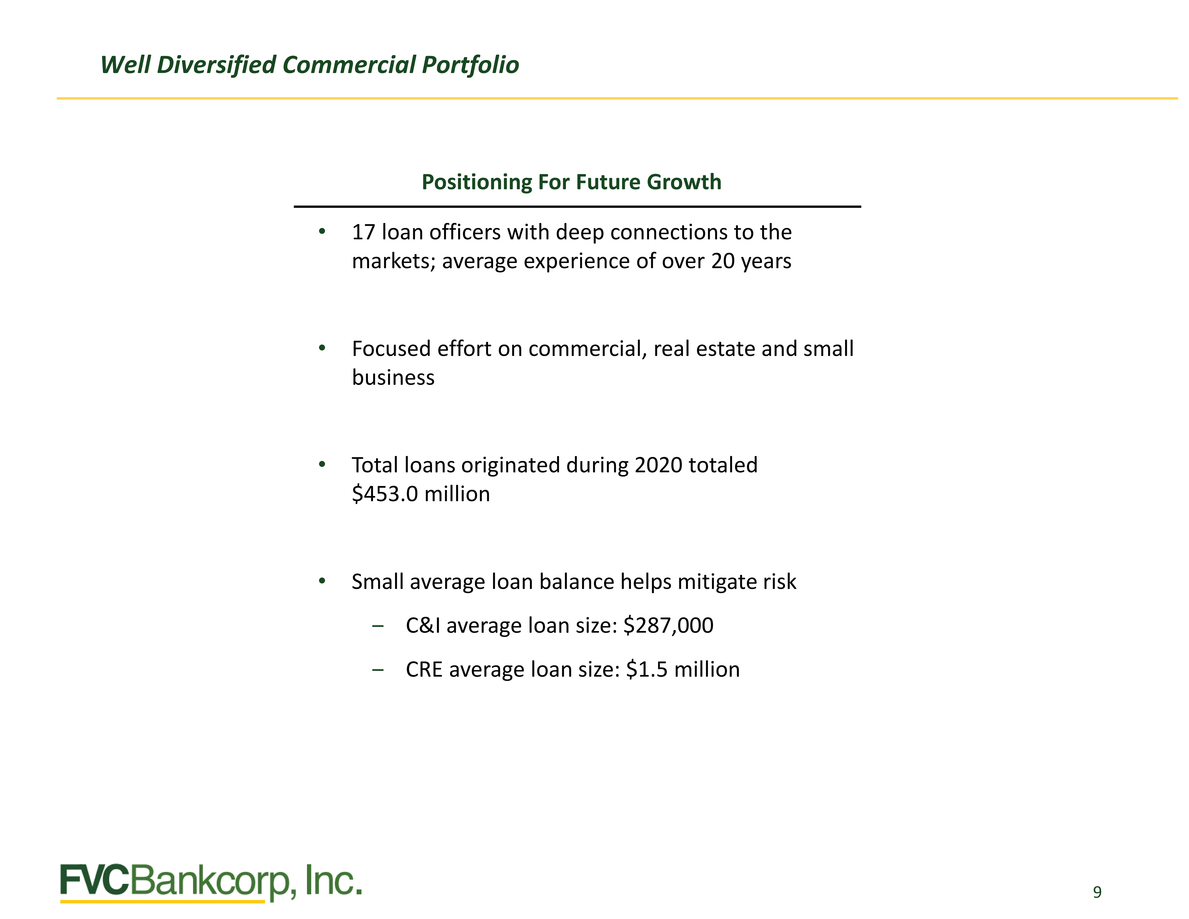 |
Well Diversified Commercial Portfolio Positioning For Future Growth 17 loan officers with deep connections to the markets; average experience of over 20 years Focused effort on commercial, real estate and small business Total loans originated during 2020 totaled $453.0 million Small average loan balance helps mitigate risk ‒C&I average loan size: $287,000 ‒CRE average loan size: $1.5 million |
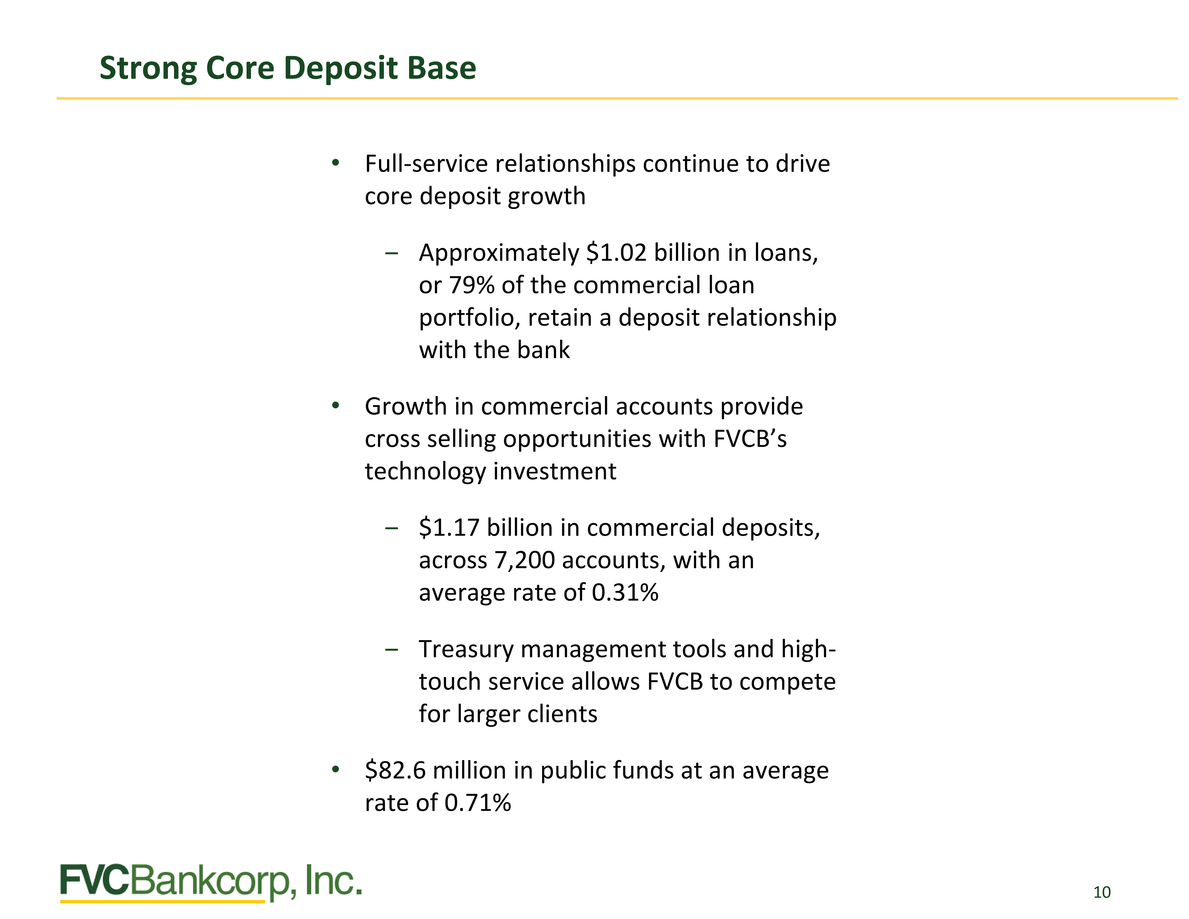 |
Full-service relationships continue to drive core deposit growth ‒Approximately $1.02 billion in loans, or 79% of the commercial loan portfolio, retain a deposit relationship with the bank Growth in commercial accounts provide cross selling opportunities with FVCB’s technology investment ‒$1.17 billion in commercial deposits, across 7,200 accounts, with an average rate of 0.31% ‒ Treasury management tools and high-touch service allows FVCB to compete for larger clients $82.6 million in public funds at an average rate of 0.71% |
 |
The CARES Act, which was enacted March 27, 2020, included several provisions designed to provide relief to individuals and businesses as well as the banking system. Among the more significant components of this legislation was the creation of the PPP. Loans made under the PPP are fully guaranteed as to principal and interest by the U.S. Small Business Administration (“SBA”), whose guarantee is backed by the full faith and credit of the U.S. government. PPP loans afford borrowers forgiveness up to the principal amount of the PPP covered loan if the proceeds are used to retain workers and maintain payroll or make mortgage interest, lease and utility payments. The SBA will reimburse banks that participate in this program for any amount of a PPP covered loan that is forgiven. Under the first round of PPP during 2020, we originated 756 applications for approximately $173 million, and net fees of over $5 million. We also participated during the second round of PPP during 2021, originating an additional 393 loans for approximately $62.5 million with net fees of over $2 million as of March 31, 2021. As of March 31, 2021, over 389 loans have been forgiven totaling $69.9 million. |
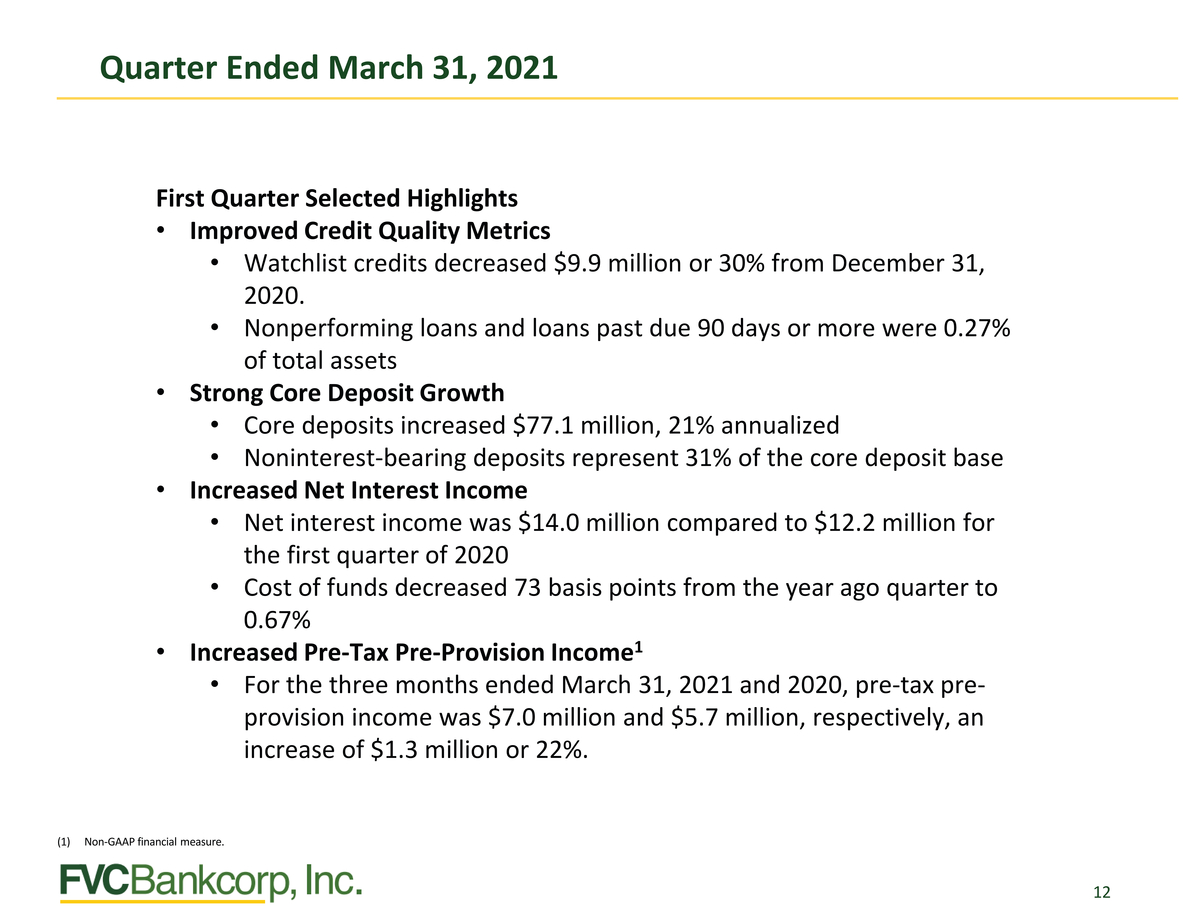 |
First Quarter Selected Highlights Improved Credit Quality Metrics Watchlist credits decreased $9.9 million or 30% from December 31, 2020. Nonperforming loans and loans past due 90 days or more were 0.27% of total assets Strong Core Deposit Growth Core deposits increased $77.1 million, 21% annualized Noninterest-bearing deposits represent 31% of the core deposit base Increased Net Interest Income Net interest income was $14.0 million compared to $12.2 million for the first quarter of 2020 Cost of funds decreased 73 basis points from the year ago quarter to 0.67% Increased Pre-Tax Pre-Provision Income1 For the three months ended March 31, 2021 and 2020, pre-tax pre-provision income was $7.0 million and $5.7 million, respectively, an increase of $1.3 million or 22%. Non-GAAP financial measure. |
 |
Well-Capitalized Bank Capital ratios at the FVCB’s subsidiary bank, FVCbank, remain above the threshold to be considered well-capitalized at March 31, 2021 Improved Efficiency Ratio1 Efficiency ratio for the three months ended March 31, 2021 was 53.1%, an improvement from 55.9% for the year ago quarter (1) Non-GAAP financial measure. |
 |
Each year, FVCBank identifies one or more nonprofit organizations to award funds from the L. Burwell Gunn Citizenship Award to support these organizations ongoing efforts to help the communities we serve. This year’s recipient is Veterans Moving Forward, Inc. Founded in 2010, Veterans Moving Forward, Inc. is a 501(c)(3) nonprofit organization headquartered in Dulles, Virginia. For over a decade, the mental health and wellness-driven Veterans organization has provided free-of-cost service dogs for military professionals with physical and/or mental health challenges. Determined to make a positive difference in the lives of those who fought for our country, Veterans Moving Forward works toward bringing independence back to their lives by providing our Veterans with a service canine that not only helps address their disability but is also exactly the companion many of them have been missing. The services provided by Veterans Moving Forward are available to all U.S. veterans regardless of age or location within the United States. With an inspiring vision to be a leading source of service dogs and canine therapy services, FVCbank is proud to award the 2021 L. Burwell Gunn Citizenship Award to Veterans Moving Forward. |
|
NASDAQ: FVCB 2021 Annual Shareholders’ Meeting May 19, 2021 |
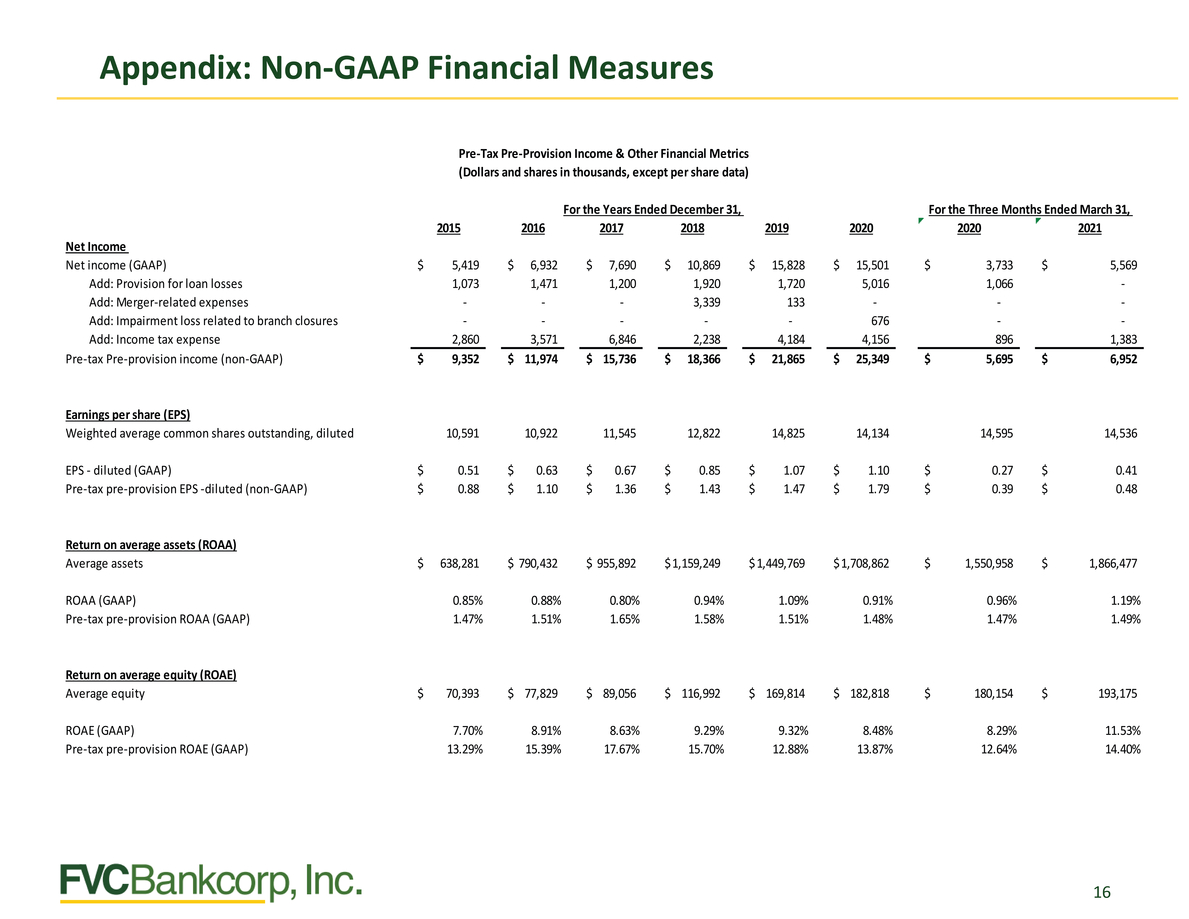 |
Pre-Tax Pre-Provision Income & Other Financial Metrics (Dollars and shares in thousands, except per share data) Add: Provision for loan losses1,0731,4711,2001,9201,7205,0161,066-Add: Merger-related expenses---3,339133---Add: Impairment loss related to branch closures-----676--Add: Income tax expense2,8603,5716,8462,2384,1844,1568961,383 Pre-tax Pre-provision income (non-GAAP) $9,352 $ 11,974 $ 15,736 $18,366 $21,865 $25,349$ 5,695$ 6,952 |
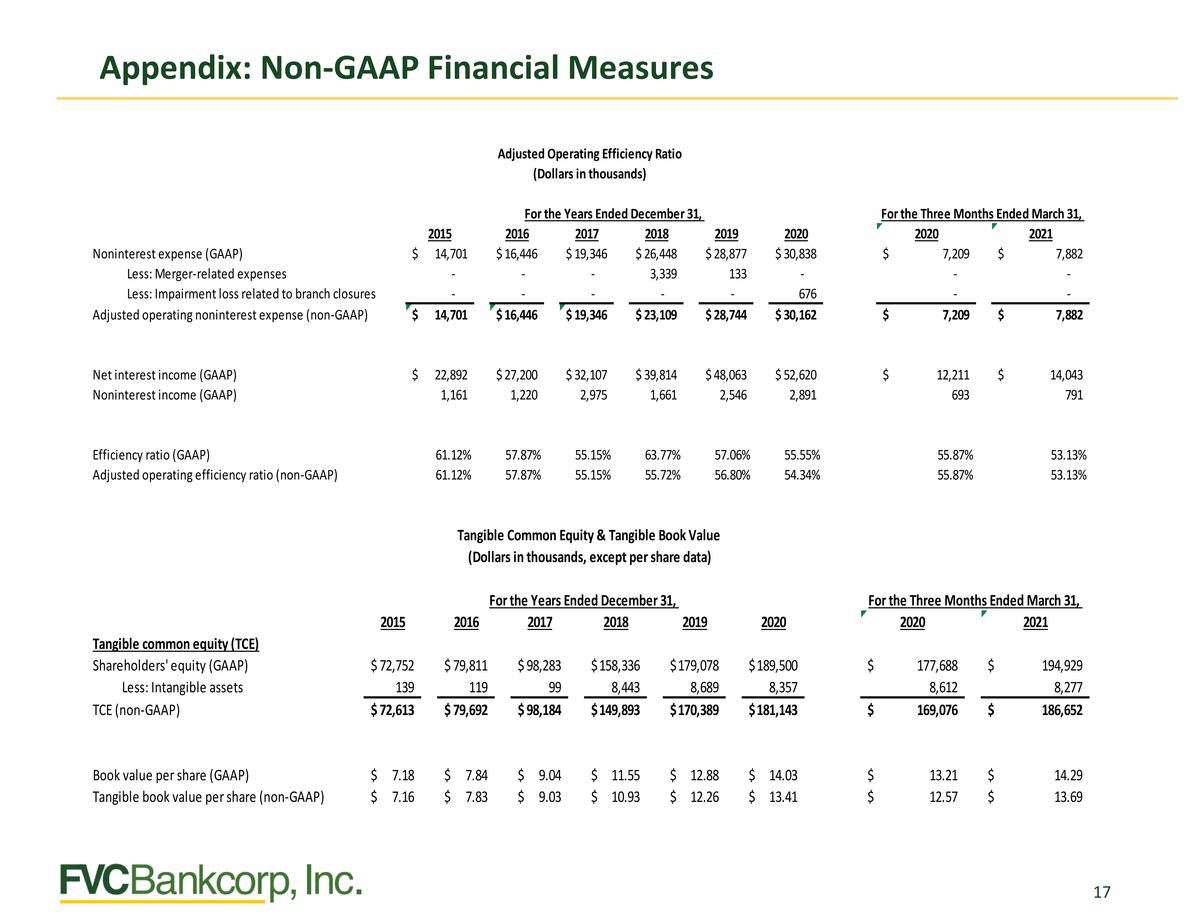 |
Adjusted Operating Efficiency Ratio (Dollars in thousands) For the Years Ended December 31,For the Three Months Ended March 31, 20152016201720182019202020202021 Noninterest expense (GAAP) $14,701 $ 16,446 $ 19,346 $ 26,448 $ 28,877 $ 30,838 $7,209$ 7,882 Less: Merger-related expenses---3,339133---Less: Impairment loss related to branch closures-----676--Adjusted operating noninterest expense (non-GAAP) $14,701 $ 16,446 $ 19,346 $ 23,109 $ 28,744 $ 30,162 $7,209$ 7,882 Tangible Common Equity & Tangible Book Value (Dollars in thousands, except per share data) For the Years Ended December 31,For the Three Months Ended March 31, |