Attached files
| file | filename |
|---|---|
| 8-K - FORM 8-K - Village Bank & Trust Financial Corp. | tm2116876d1_8k.htm |
Exhibit 99.1

You're a Neighbor, Not a Number 2021 Annual Shareholders Meeting Exhibit 99.1

Cautionary Statement Regarding Forward - Looking Statements In addition to historical information, this presentation may contain forward - looking statements . For this purpose, any statement that is not a statement of historical fact may be deemed to be a forward - looking statement . These forward - looking statements may include statements regarding profitability, liquidity, allowance for loan losses, interest rate sensitivity, market risk, growth strategy and financial and other goals . Forward - looking statements often use words such as “believes,” “expects,” “plans,” “may,” “will,” “should,” “projects,” “contemplates,” “anticipates,” “forecasts,” “intends” or other words of similar meaning . You can also identify them by the fact that they do not relate strictly to historical or current facts . Forward - looking statements are subject to numerous assumptions, risks and uncertainties, and actual results could differ materially from historical results or those anticipated by such statements . There are many factors that could have a material adverse effect on the operations and future prospects of the Company including, but not limited to : changes in assumptions underlying the establishment of allowances for loan losses, and other estimates ; the risks of changes in interest rates on levels, composition and costs of deposits, loan demand, and the values and liquidity of loan collateral, securities, and interest sensitive assets and liabilities ; the effects of future economic, business and market conditions ; legislative and regulatory changes, including the Dodd - Frank Wall Street Reform and Consumer Protection Act and other changes in banking, securities, and tax laws and regulations and their application by our regulators, and changes in scope and cost of Federal Deposit Insurance Corporation insurance and other coverages ; our inability to maintain our regulatory capital position ; the Company’s computer systems and infrastructure may be vulnerable to attacks by hackers or breached due to employee error, malfeasance, or other disruptions despite security measures implemented by the Company ; changes in market conditions, specifically declines in the residential and commercial real estate market, volatility and disruption of the capital and credit markets, soundness of other financial institutions we do business with ; risks inherent in making loans such as repayment risks and fluctuating collateral values ; changes in operations of the mortgage company as a result of the activity in the residential real estate market ; exposure to repurchase loans sold to investors for which borrowers failed to provide full and accurate information on or related to their loan application or for which appraisals have not been acceptable or when the loan was not underwritten in accordance with the loan program specified by the loan investor ; governmental monetary and fiscal policies ; changes in accounting policies, rules and practices ; reliance on our management team, including our ability to attract and retain key personnel ; competition with other banks and financial institutions, and companies outside of the banking industry, including those companies that have substantially greater access to capital and other resources ; demand, development and acceptance of new products and services ; problems with technology utilized by us ; natural disasters, war, terrorist activities, pandemics, or the outbreak of COVID - 19 or similar outbreaks, and their effects on economic and business environments in which the Company operates ; adverse effects due to COVID - 19 on the Company and its customers, counterparties, employees, and third - party service providers, and the adverse impacts to our business, financial position, results of operations, and prospects ; changing trends in customer profiles and behavior ; and other factors described from time to time in our reports filed with the SEC . These risks and uncertainties should be considered in evaluating the forward - looking statements contained herein, and readers are cautioned not to place undue reliance on such statements . Any forward - looking statement speaks only as of the date on which it is made, and the Company undertakes no obligation to update any forward - looking statement to reflect events or circumstances after the date on which it is made . In addition, past results of operations are not necessarily indicative of future results . 1
Non - GAAP Financial Measures The accounting and reporting polices of the Company conform to generally accepted accounting principles (“GAAP”) in the United States and prevailing practices in the banking industry. However, management uses certain non - GAAP measures to supplement the evaluation of the Company’s performance. These measures include core operating income, core earnings per share and core return on tangible common equity for the consolidated entity, the commercial banking segment, and the mortgage banking segment. Management believes presentations of these non - GAAP financial measures provide useful supplemental information that is essential to a proper understanding of the operating results of the Company’s core businesses. These non - GAAP disclosures should not be viewed as a substitute for operating results determined in accordance with GAAP, nor are they necessarily comparable to non - GAAP performance measures that may be presented by other companies. Reconciliations of GAAP to non - GAAP disclosures are included as tables at the end of this presentation. 2
Why Village? Vision, Discipline, Execution – We think and behave like long term investors Market – Strong market position in a very attractive market Opportunity – Excellent opportunity to take m arket share Differentiated – A strong community bank with a successful mortgage company Transparency and Candor – Effective shareholder communications We Deliver Results – Excellent shareholder returns over the last five years 3
Our Strategy Is Built Around Delivering Top Quartile Long Term Returns To Our Shareholders This Means… • Top Quartile Return on Tangible Common Equity • Sustained High Single Digit Earnings Per Share Growth • Best Quartile Asset Quality in Worst Part of Cycle • Best Quartile Earnings Volatility 4

We Accomplished Our Objectives In 2020 5 (1) Non - GAAP financial measure. See GAAP to Non - GAAP financial measure reconciliation at the end of this release . (2) Source: S&P Global – Southeast Public Banks under $1 billion in assets as of December 31, 2020. (3) Nonperforming assets excludes performing troubled debt restructurings. $2.21 $3.53 $5.86 $2.66 $- $1.00 $2.00 $3.00 $4.00 $5.00 $6.00 $7.00 2018 2019 2020 Q1 2021 Core Earnings Per Share (1) Commerical Banking Segment Mortgage Banking Segment 38% CAGR 0.54% 0.44% 0.27% 0.26% 0.05% 0.00% 0.04% (0.01%) (0.30%) (0.20%) (0.10%) 0.00% 0.10% 0.20% 0.30% 0.40% 0.50% 0.60% 2018 2019 2020 Q1 2021 Asset Quality Metrics (3) NPAs/Total Assets Net Charge-offs to Average Loans 8.97% 12.72% 19.12% 29.07% 0.00% 10.00% 20.00% 30.00% 0.00% 10.00% 20.00% 30.00% 2018 2019 2020 Q1 2021 Core ROTCE (1) Commerical Banking Segment Mortgage Banking Segment Top Quartile(2)
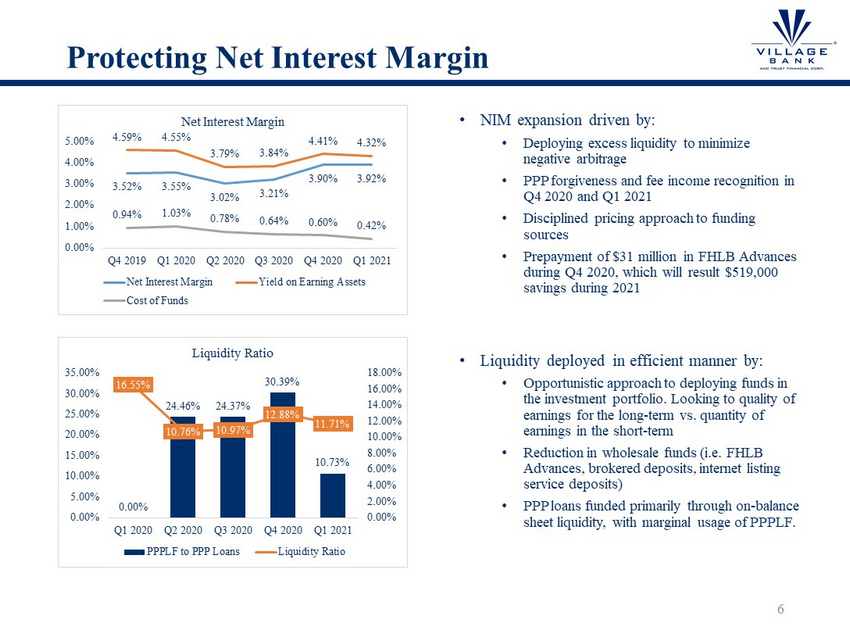
Protecting Net Interest Margin 6 3.52% 3.55% 3.02% 3.21% 3.90% 3.92% 4.59% 4.55% 3.79% 3.84% 4.41% 4.32% 0.94% 1.03% 0.78% 0.64% 0.60% 0.42% 0.00% 1.00% 2.00% 3.00% 4.00% 5.00% Q4 2019 Q1 2020 Q2 2020 Q3 2020 Q4 2020 Q1 2021 Net Interest Margin Net Interest Margin Yield on Earning Assets Cost of Funds • NIM expansion driven by: • Deploying excess liquidity to minimize negative arbitrage • PPP forgiveness and fee income recognition in Q4 2020 and Q1 2021 • Disciplined pricing approach to funding sources • Prepayment of $31 million in FHLB Advances during Q4 2020, which will result $519,000 savings during 2021 • Liquidity deployed in efficient manner by: • Opportunistic approach to deploying funds in the investment portfolio. Looking to quality of earnings for the long - term vs. quantity of earnings in the short - term • Reduction in wholesale funds (i.e. FHLB Advances, brokered deposits, internet listing service deposits) • PPP loans funded primarily through on - balance sheet liquidity, with marginal usage of PPPLF. 0.00% 24.46% 24.37% 30.39% 10.73% 16.55% 10.76% 10.97% 12.88% 11.71% 0.00% 2.00% 4.00% 6.00% 8.00% 10.00% 12.00% 14.00% 16.00% 18.00% 0.00% 5.00% 10.00% 15.00% 20.00% 25.00% 30.00% 35.00% Q1 2020 Q2 2020 Q3 2020 Q4 2020 Q1 2021 Liquidity Ratio PPPLF to PPP Loans Liquidity Ratio

Loan and Deposit Trends 7 $435,234 $607,993 $600,089 $561,003 $592,177 4.90% 4.15% 4.08% 4.76% 4.64% -0.50% 1.00% 2.50% 4.00% 5.50% 7.00% 8.50% 10.00% $- $100,000 $200,000 $300,000 $400,000 $500,000 $600,000 $700,000 Q1 2020 Q2 2020 Q3 2020 Q4 2020 Q1 2021 Loan Growth (dollars in thousands) Core Loans PPP Loans Yield on Loans $468,843 $579,795 $573,852 $588,382 $620,056 0.80% 0.62% 0.51% 0.47% 0.33% -0.15% 0.05% 0.25% 0.45% 0.65% 0.85% 1.05% 1.25% $- $100,000 $200,000 $300,000 $400,000 $500,000 $600,000 $700,000 Q1 2020 Q2 2020 Q3 2020 Q4 2020 Q1 2021 Deposit Growth (dollars in thousands) Non-interest bearing deposits Low cost interest bearing deposits Time deposits Cost of total deposits
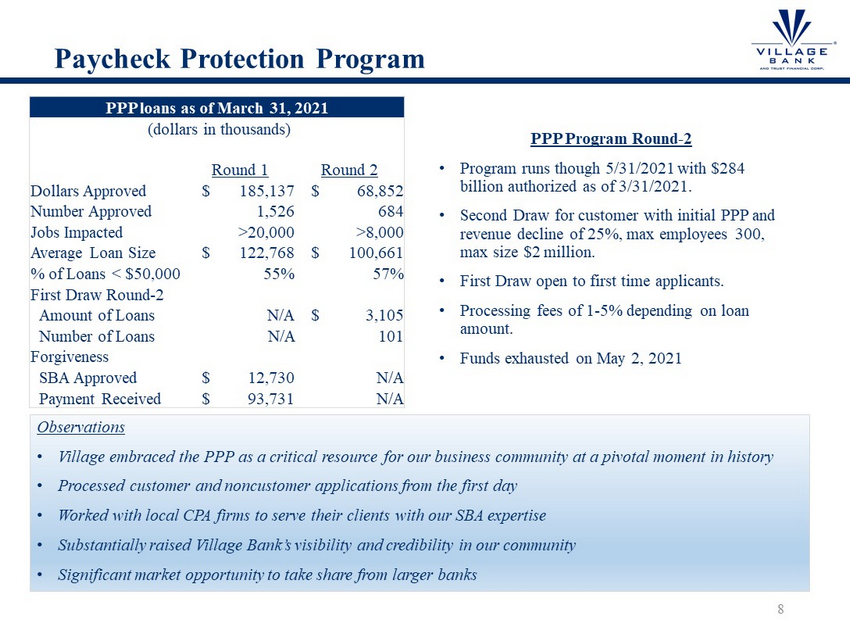
Paycheck Protection Program Observations • Village embraced the PPP as a critical resource for our business community at a pivotal moment in history • Processed customer and noncustomer applications from the first day • Worked with local CPA firms to serve their clients with our SBA expertise • Substantially raised Village Bank’s visibility and credibility in our community • Significant market opportunity to take share from larger banks 8 PPP Program Round - 2 • Program runs though 5/31/2021 with $284 billion authorized as of 3/31/2021. • Second Draw for customer with initial PPP and revenue decline of 25%, max employees 300, max size $2 million. • First Draw open to first time applicants. • Processing fees of 1 - 5% depending on loan amount. • Funds exhausted on May 2, 2021 PPP loans as of March 31, 2021 (dollars in thousands) Round 1 Round 2 Dollars Approved $ 185,137 $ 68,852 Number Approved 1,526 684 Jobs Impacted >20,000 >8,000 Average Loan Size $ 122,768 $ 100,661 % of Loans < $50,000 55% 57% First Draw Round - 2 Amount of Loans N/A $ 3,105 Number of Loans N/A 101 Forgiveness SBA Approved $ 12,730 N/A Payment Received $ 93,731 N/A

Loan Deferral Update 9 Loan Deferrals • Balances under modification declined 77% from the peak in September 30, 2020 • Follow frameworks laid out in FFIEC Interagency and FASB guidance • Deferral metrics exclude SBA 7a and 504 loans receiving Section 1112 Subsidy Payments. $83,837 $84,335 $38,028 $19,034 $- $10,000 $20,000 $30,000 $40,000 $50,000 $60,000 $70,000 $80,000 $90,000 $100,000 Q2 2020 Q3 2020 Q4 2020 Q1 2021 Loan Deferrals (dollars in thousands) Other Consumer/Residential Acquisition, development and construction Nonowner occupied commercial real estate C&I + Owner occupied commercial real estate (1 ) Effective January 19, 2021, the SBA provided guidance on the implementation of the extension of the Section 1112 Debt Relief Program fo r t he 7(a) loan program as authorized by Section 325 of the Economic Aid to Hard - Hit Small Business, Nonprofits, and Venues Act. The SBA wi ll pay the principal, interest, and fees on current 7(a) loans for a period of up to eight months. These loans have been excluded from t he March 31, 2021 metrics; however, as of December 31, 2020, six loans with a total outstanding balance of $3,407,000 went into a deferred paym ent status and were included in the deferred loan amount above.
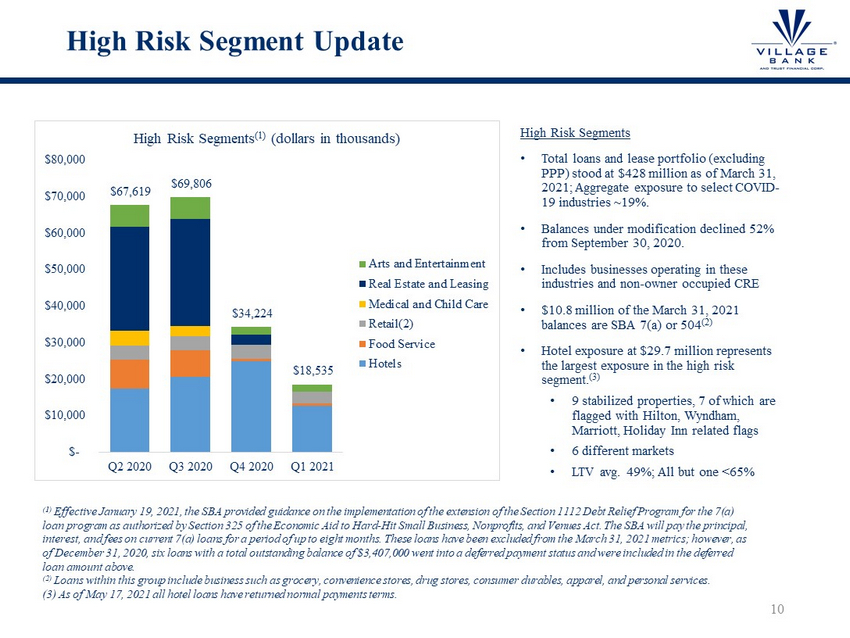
High Risk Segment Update 10 High Risk Segments • Total loans and lease portfolio (excluding PPP) stood at $428 million as of March 31, 2021; Aggregate exposure to select COVID - 19 industries ~19%. • Balances under modification declined 52% from September 30, 2020. • Includes businesses operating in these industries and non - owner occupied CRE • $10.8 million of the March 31, 2021 balances are SBA 7(a) or 504 (2 ) • Hotel exposure at $29.7 million represents the largest exposure in the high risk segment. (3) • 9 stabilized properties, 7 of which are flagged with Hilton, Wyndham, Marriott, Holiday Inn related flags • 6 different markets • LTV avg. 49%; All but one <65% $67,619 $69,806 $34,224 $18,535 $- $10,000 $20,000 $30,000 $40,000 $50,000 $60,000 $70,000 $80,000 Q2 2020 Q3 2020 Q4 2020 Q1 2021 High Risk Segments (1) (dollars in thousands) Arts and Entertainment Real Estate and Leasing Medical and Child Care Retail(2) Food Service Hotels (1 ) Effective January 19, 2021, the SBA provided guidance on the implementation of the extension of the Section 1112 Debt Relief Program fo r t he 7(a) loan program as authorized by Section 325 of the Economic Aid to Hard - Hit Small Business, Nonprofits, and Venues Act. The SBA wi ll pay the principal, interest, and fees on current 7(a) loans for a period of up to eight months. These loans have been excluded from the March 31 , 2 021 metrics; however, as of December 31, 2020, six loans with a total outstanding balance of $3,407,000 went into a deferred payment status and were i ncl uded in the deferred loan amount above . ( 2) Loans within this group include business such as grocery, convenience stores, drug stores, consumer durables, apparel, and pe rs onal services. (3) As of May 17, 2021 all hotel loans have returned normal payments terms.
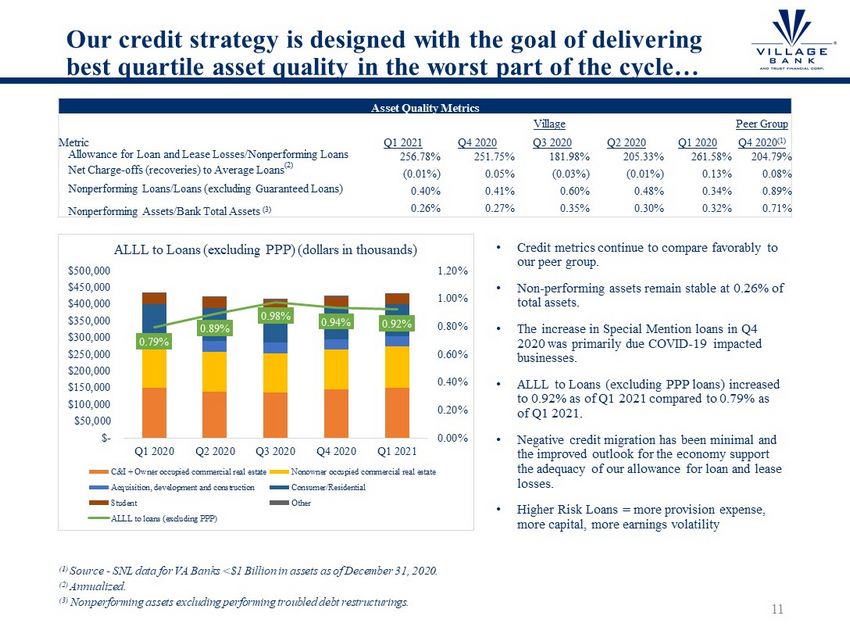
Our credit strategy is designed with the goal of delivering best quartile asset quality in the worst part of the cycle… 11 Asset Quality Metrics Metric Village Peer Group Q1 2021 Q4 2020 Q3 2020 Q2 2020 Q1 2020 Q4 2020 (1) Allowance for Loan and Lease Losses/Nonperforming Loans 256.78% 251.75% 181.98% 205.33% 261.58% 204.79% Net Charge - offs (recoveries) to Average Loans (2) (0.01%) 0.05% (0.03%) (0.01%) 0.13% 0.08% Nonperforming Loans/Loans (excluding Guaranteed Loans) 0.40% 0.41% 0.60% 0.48% 0.34% 0.89% Nonperforming Assets/Bank Total Assets (3) 0.26% 0.27% 0.35% 0.30% 0.32% 0.71% (1) Source - SNL data for VA Banks <$1 Billion in assets as of December 31, 2020. (2) Annualized. (3) Nonperforming assets excluding performing troubled debt restructurings. • Credit metrics continue to compare favorably to our peer group. • Non - performing assets remain stable at 0.26% of total assets. • The increase in Special Mention loans in Q4 2020 was primarily due COVID - 19 impacted businesses. • ALLL to Loans (excluding PPP loans) increased to 0.92% as of Q1 2021 compared to 0.79% as of Q1 2021. • Negative credit migration has been minimal and the improved outlook for the economy support the adequacy of our allowance for loan and lease losses. • Higher Risk Loans = more provision expense, more capital, more earnings volatility 0.79% 0.89% 0.98% 0.94% 0.92% 0.00% 0.20% 0.40% 0.60% 0.80% 1.00% 1.20% $- $50,000 $100,000 $150,000 $200,000 $250,000 $300,000 $350,000 $400,000 $450,000 $500,000 Q1 2020 Q2 2020 Q3 2020 Q4 2020 Q1 2021 ALLL to Loans (excluding PPP) (dollars in thousands) C&I + Owner occupied commercial real estate Nonowner occupied commercial real estate Acquisition, development and construction Consumer/Residential Student Other ALLL to loans (excluding PPP)

2020 Record Year for the Mortgage Banking Segment Observations • Purchase money focused • Strong real estate market supports purchase money • Counter cyclical business to commercial bank • Application to close turn - time averaged 12 days shorter than industry 12 $162,111 $203,497 $369,818 $90,877 0.19% 2.44% 8.27% 12.00% 0.00% 2.00% 4.00% 6.00% 8.00% 10.00% 12.00% 14.00% $0 $50,000 $100,000 $150,000 $200,000 $250,000 $300,000 $350,000 $400,000 2018 2019 2020 Q1 2021 Mortgage Banking Segment Originations vs. ROE (dollars in thousands) Purchase Refinance ROE (1) Source - Mortgage Bankers Association * Mortgage Banking Segment 92% 80% 82% 66% 54% 55% 43% 8% 20% 18% 34% 46% 45% 57% 0% 10% 20% 30% 40% 50% 60% 70% 80% 90% 100% MBS* Industry Avg. MBS* Industry Avg. MBS* Industry Avg. MBS* 2018 2019 2020 Q1 2021 Loan Originations - Purchase vs. Refinance (1) Purchase Refinance

Management Team 13 Jay Hendricks President & Chief Executive Officer Donnie Kaloski Chief Financial Officer & Chief Risk Officer Max Morehead Commercial Banking Joy Kline Retail Banking Clif Winn President & CEO Village Bank Mortgage Corp Christy Quesenbery Operations Roy Barzel Chief Credit Officer Lindsay Cheatham Director of Human Resources Price Beazley Chief Technology Officer Valenda Campbell Director of Marketing

Board of Directors 14 Craig Bell Chairman Since 1998 Randy Whittemore Director Since 1998 Frank Jenkins Director Since 2017 R.T. Avery Director Since 1998 Mike Katzen Director Since 2008 Mike Toalson Director Since 2004 Devon Henry Director Since 2018 Mary Margaret Kastelberg Director Since 2020 Note: Jay Hendricks – President and Chief Executive Officer is a member of the Board of Directors.

2021 Challenges and Opportunities Challenges • Rate environment • Liquidity levels • Competition driving spreads tighter and credit standards looser Opportunities • Strong market perception, reinforced by success in PPP • Local bank mergers and disappointed PPP customers creating opportunities • Cross - sell opportunity into ~400 new PPP clients • Strong mortgage loan purchase money market, Mortgage recruiting • Leverage Treasury Management Sales team and Concierge Banking teams established in 2020 • SBA enhancements to their 7a and 504 programs • SBA guaranty strip sales • Digitalization initiatives 15

Question and Answer Segment 16

Reconciliation of Non - GAAP Financial Measures 17 Reconciliation of Non - GAAP Financial Measures (Dollars in thousands, except per share amounts) * Reference notes on following page. GAAP Operating Results by Segment 2018 2019 2020 Q1 2021 Pre - tax earnings by segment Commercial banking $ 3,646 $ 4,402 $ 6,058 $ 2,998 Mortgage banking 84 1,239 4,981 2,035 Income before income tax expense 3,730 5,641 11,039 5,033 Commercial banking income tax expense 675 904 1,439 709 Mortgage banking income tax expense 18 260 1,046 427 Net income $ 3,037 $ 4,477 $ 8,554 $ 3,897 Preferred stock dividend (1) $ (113) $ - $ - $ - Net income available to common shareholders $ 2,924 $ 4,477 $ 8,554 $ 3,897 Core Operating Results by Segment (2) 2018 2019 2020 Q1 2021 Commercial banking GAAP pre - tax earnings $ 3,646 $ 4,402 $ 6,058 $ 2,998 Non - core (income) expense items Salaries and benefits (3) - 760 - - Branch write - down 56 22 - - (Gain)/loss on sale of securities 89 (101) (12) - Other non - core expense (4) 162 55 696 - Commercial banking operating income 3,953 5,138 6,742 2,998 Mortgage banking GAAP pre - tax earnings 84 1,239 4,981 2,035 Non - core expense items Salaries and benefits (3) - 54 - - Mortgage banking operating income 84 1,293 4,981 2,035 Core operating income before income tax expense 4,037 6,431 11,723 5,033 Commercial banking income tax expense (5) 739 1,059 1,583 709 Mortgage banking income tax expense (5) 18 271 1,046 427 Core operating net income $ 3,280 $ 5,101 $ 9,094 $ 3,897 Preferred stock dividend (1 ) $ (113) $ - $ - $ - Core operating income available to common shareholders $ 3,167 $ 5,101 $ 9,094 $ 3,897

Reconciliation of Non - GAAP Financial Measures 18 Reconciliation of Non - GAAP Financial Measures (Dollars in thousands, except per share amounts) Reference notes for GAAP to Core Operating Income (1) On March 30, 2018, the Company redeemed the remaining 5,027 shares ($5,027,000 aggregate liquidation value) of its Fixed Rate Cumulative Perpetual Preferred Stock, Series A. (2) Non - GAAP financial measure. (3) The Company recognized $814,000 in additional compensation expense during Q2 2019, as a result of the accelerated vesting of restricted stock awards and retirement benefits as disclosed in the Company's Form 8 - K filed on June 25, 2019. (4) Other non - core expense is composed of the write - off of premiums associated with United State Department of Agriculture Loans, $139,000 during 2018, $12,000 during 2019, and additional audit and tax fees of $23,000 during 2018 and $43,000 during 2019 associated with the transition of our external auditors during 2018 . 202 0 includes $696,000 in prepayment fees associated with the early pay - off of the then $31 million outstanding in FHLB Advances. (5) Income tax expense was adjusted for the non - core items at the corporate tax rate of 21%.

Reconciliation of Non - GAAP Financial Measures 19 Reconciliation of Non - GAAP Financial Measures (Dollars in thousands, except per share amounts) 2018 2019 2020 Q1 2021 ROTCE Average shareholder's equity $ 36,523 $ 40,111 $ 47,572 $ 54,360 Less: average preferred stock (1) 1,229 - - - Average tangible common equity $ 35,294 $ 40,111 $ 47,572 $ 54,360 Net income available to common shareholders Consolidated $ 2,924 $ 4,477 $ 8,554 $ 3,897 Commerical Banking Segment 2,858 3,498 4,619 2,289 Mortgage Banking Segment $ 66 $ 979 $ 3,935 $ 1,608 Return on Tangible Common Equity Consolidated 8.28% 11.16% 17.98% 29.07% Commerical Banking Segment 8.10% 8.72% 9.71% 17.08% Mortgage Banking Segment 0.19% 2.44% 8.27% 12.00% Core ROTCE Operating income available to common shareholders (2) Consolidated $ 3,167 $ 5,101 $ 8,545 $ 3,897 Commerical Banking Segment 3,101 4,079 4,610 2,289 Mortgage Banking Segment $ 66 $ 1,022 $ 3,935 $ 1,608 Return on Tangible Common Equity Consolidated 8.97% 12.72% 17.96% 29.07% Commerical Banking Segment 8.78% 10.17% 9.69% 17.08% Mortgage Banking Segment 0.19% 2.55% 8.27% 12.00% (1) On March 30, 2018, the Company redeemed the remaining 5,027 shares ($5,027,000 aggregate liquidation value) of its Fixed Rate Cumulative Perpetual Preferred Stock, Series A. (2) Derived from the Core Operating Results by Segment table.

Reconciliation of Non - GAAP Financial Measures 20 Reconciliation of Non - GAAP Financial Measures (in thousands, except per share amounts) (1) Derived from the Core Operating Results by Segment table. 2018 2019 2020 Q1 2021 GAAP earnings per share Weighted Average Share Outstanding 1,433 1,445 1,459 1,467 Net income available to common shareholders Consolidated $ 2,924 $ 4,477 $ 8,554 $ 3,897 Commerical Banking Segment 2,858 3,498 4,619 2,289 Mortgage Banking Segment $ 66 $ 979 $ 3,935 $ 1,608 GAAP earnings per share Consolidated $ 2.04 $ 3.10 $ 5.86 $ 2.66 Commerical Banking Segment $ 1.99 $ 2.42 $ 3.17 $ 1.56 Mortgage Banking Segment $ 0.05 $ 0.68 $ 2.70 $ 1.10 Core earnings per share Operating income available to common shareholders (1) Consolidated $ 3,167 $ 5,101 $ 8,545 $ 3,897 Commerical Banking Segment 3,101 4,079 4,610 2,289 Mortgage Banking Segment $ 66 $ 1,022 $ 3,935 $ 1,608 Core earnings per share Consolidated $ 2.21 $ 3.53 $ 5.86 $ 2.66 Commerical Banking Segment $ 2.16 $ 2.82 $ 3.16 $ 1.56 Mortgage Banking Segment $ 0.05 $ 0.71 $ 2.70 $ 1.10