Attached files
| file | filename |
|---|---|
| 8-K - 8-K - BAR HARBOR BANKSHARES | bhb-20210518x8k.htm |
Exhibit 99.1
|

| Legal Disclaimer Forward Looking Statements Certain statements contained in this document that are not historical facts may constitute forward‐looking statements within the meaning of Section 27A of the Securities Act of 1933, as amended (“Securities Act”), and Section 21E of the Securities Act of 1934, as amended (“Exchange Act”), and are intended to be covered by the safe harbor provisions of the Private Securities Litigation Reform Act of 1995. There are several factors that could cause actual results to differ significantly from expectations described in the forward‐looking statements, including deterioration in local economies or real estate markets or in the general economy or financial markets, interest rate volatility, loss of deposits or changes in deposit mix, insufficient wholesale funding sources, competition from an ever‐increasing array of financial service providers, and challenges from expansion, growth and acquisitions. For additional discussion of such factors, please see the Company’s most recent reports on Forms 10‐K and 10‐Q filed with the Securities and Exchange Commission and available on the SEC’s website at www.sec.gov. The Company is not undertaking an obligation to update forward‐looking statements, even though its situation may change in the future, except as required under federal securities law. Non‐GAAP Financial Statements This document contains certain non‐GAAP financial measures in addition to results presented in accordance with accounting principles generally accepted in the United States of America (“GAAP”). These non‐GAAP measures are intended to provide the reader with additional supplemental perspectives on operating results, performance trends, and financial condition. Non‐GAAP financial measures are not a substitute for GAAP measures; they should be read and used in conjunction with the Company’s GAAP financial information. A reconciliation of non‐GAAP financial measures to GAAP measures is provided in the first quarter of earnings release, which is available on the SEC’s website at www.sec.gov. In all cases, it should be understood that non‐GAAP measures do not depict amounts that accrue directly to the benefit of shareholders. An item which management excludes when computing non‐GAAP adjusted earnings can be of substantial importance to the Company’s results for any particular quarter or year. The Company’s non‐GAAP core earnings information set forth is not necessarily comparable to non‐GAAP information which may be presented by other companies. Each non‐GAAP measure used by the Company in this report as supplemental financial data should be considered in conjunction with the Company’s GAAP financial information. The Company utilizes the non‐GAAP measure of core earnings in evaluating operating trends, including components for core revenue and expense. These measures exclude amounts which the Company views as unrelated to its normalized operations, including securities gains/losses, acquisition costs, restructuring costs, legal settlements, and system conversion costs. Non‐GAAP adjustments are presented net of an adjustment for income tax expense. The Company also calculates core earnings per share based on its measure of core earnings. The Company views these amounts as important to understanding its operating trends, particularly due to the impact of accounting standards related to acquisition activity. Analysts also rely on these measures in estimating and evaluating the Company’s performance. Management also believes that the computation of non‐GAAP core earnings and core earnings per share may facilitate the comparison of the Company to other companies in the financial services industry. The Company also adjusts certain equity related measures to exclude intangible assets due to the importance of these measures to the investment community. 2 |
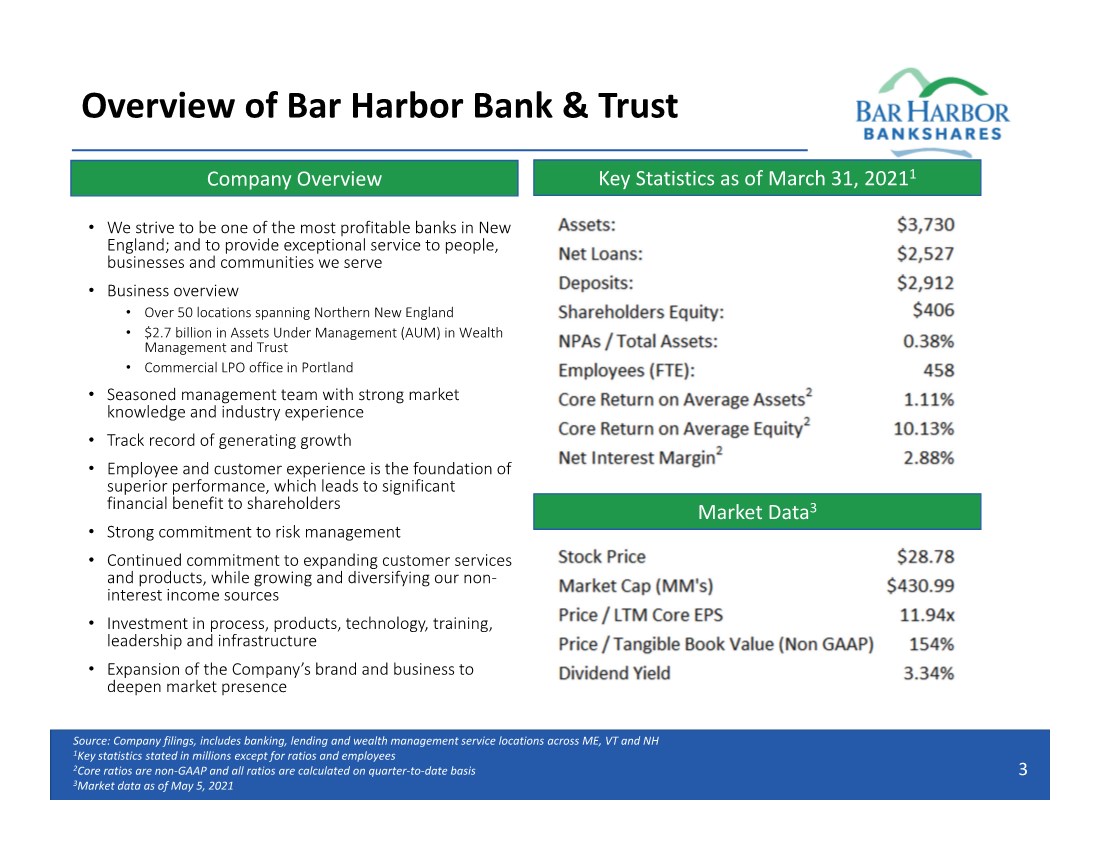
| Overview of Bar Harbor Bank & Trust 3 Company Overview • We strive to be one of the most profitable banks in New England; and to provide exceptional service to people, businesses and communities we serve • Business overview • Over 50 locations spanning Northern New England • $2.7 billion in Assets Under Management (AUM) in Wealth Management and Trust • Commercial LPO office in Portland • Seasoned management team with strong market knowledge and industry experience • Track record of generating growth • Employee and customer experience is the foundation of superior performance, which leads to significant financial benefit to shareholders • Strong commitment to risk management • Continued commitment to expanding customer services and products, while growing and diversifying our non‐ interest income sources • Investment in process, products, technology, training, leadership and infrastructure • Expansion of the Company’s brand and business to deepen market presence Source: Company filings, includes banking, lending and wealth management service locations across ME, VT and NH 1Key statistics stated in millions except for ratios and employees 2Core ratios are non‐GAAP and all ratios are calculated on quarter‐to‐date basis 3Market data as of May 5, 2021 Key Statistics as of March 31, 20211 Market Data3 |
|
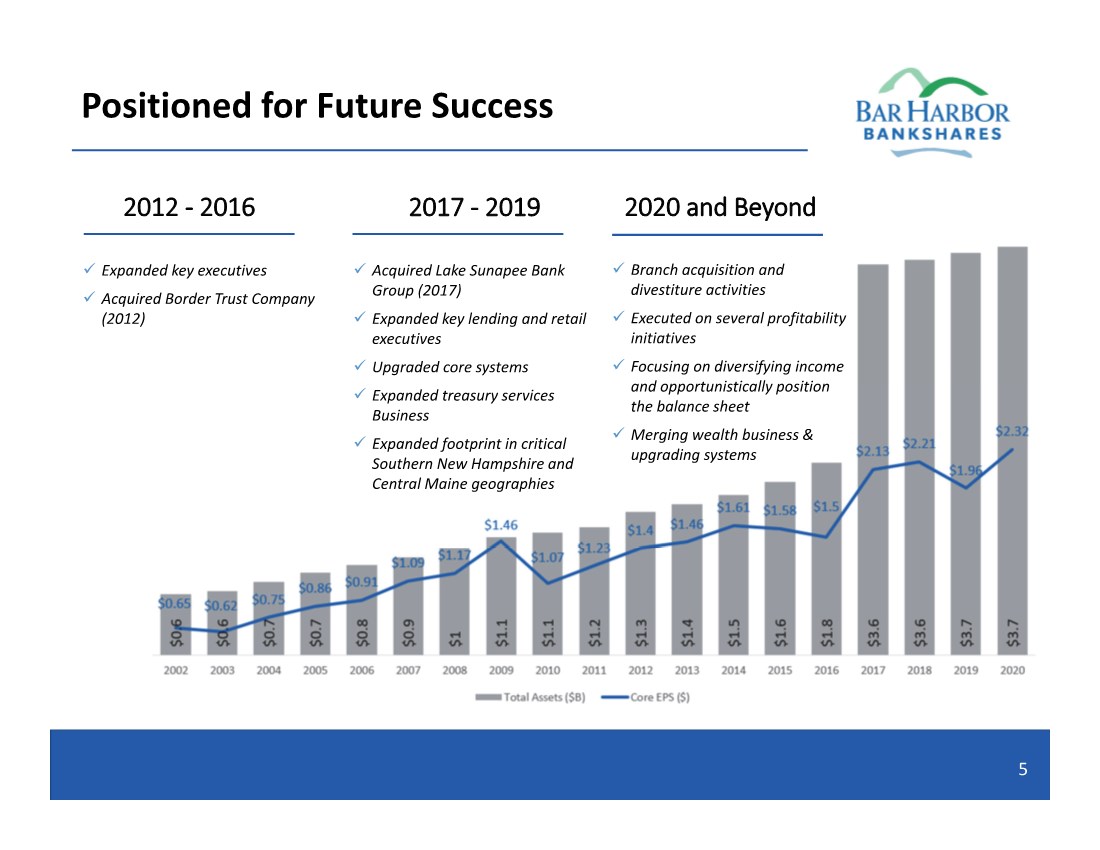
| Positioned for Future Success 5 2012 ‐ 2016 Expanded key executives Acquired Border Trust Company (2012) 2017 ‐ 2019 2020 and Beyond Acquired Lake Sunapee Bank Group (2017) Expanded key lending and retail executives Upgraded core systems Expanded treasury services Business Expanded footprint in critical Southern New Hampshire and Central Maine geographies Branch acquisition and divestiture activities Executed on several profitability initiatives Focusing on diversifying income and opportunistically position the balance sheet Merging wealth business & upgrading systems |
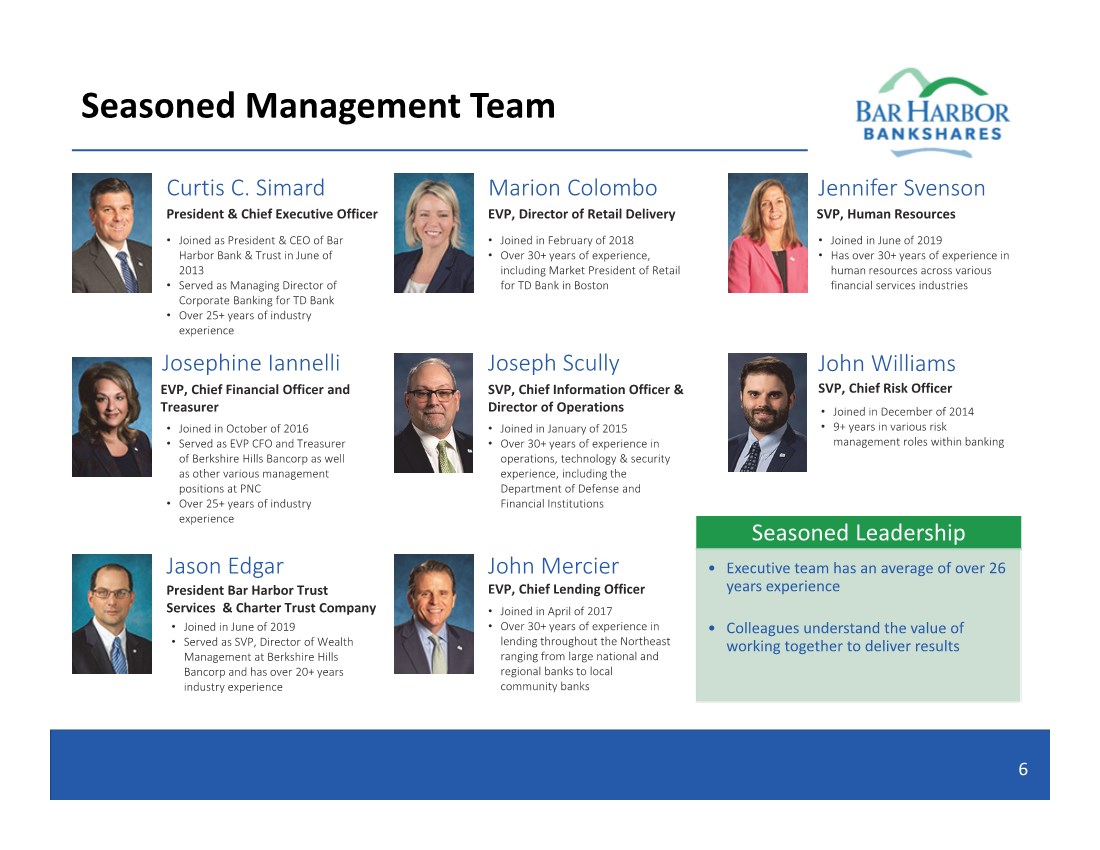
| Seasoned Management Team Seasoned Leadership •Executive team has an average of over 26 years experience • Colleagues understand the value of working together to deliver results Curtis C. Simard President & Chief Executive Officer • Joined as President & CEO of Bar Harbor Bank & Trust in June of 2013 • Served as Managing Director of Corporate Banking for TD Bank • Over 25+ years of industry experience EVP, Chief Financial Officer and Treasurer Josephine Iannelli • Joined in October of 2016 • Served as EVP CFO and Treasurer of Berkshire Hills Bancorp as well as other various management positions at PNC • Over 25+ years of industry experience Jason Edgar President Bar Harbor Trust Services & Charter Trust Company • Joined in June of 2019 • Served as SVP, Director of Wealth Management at Berkshire Hills Bancorp and has over 20+ years industry experience Marion Colombo Jennifer Svenson John Mercier Joseph Scully John Williams EVP, Director of Retail Delivery SVP, Chief Information Officer & Director of Operations SVP, Chief Risk Officer SVP, Human Resources EVP, Chief Lending Officer • Joined in February of 2018 • Over 30+ years of experience, including Market President of Retail for TD Bank in Boston • Joined in June of 2019 • Has over 30+ years of experience in human resources across various financial services industries • Joined in January of 2015 • Over 30+ years of experience in operations, technology & security experience, including the Department of Defense and Financial Institutions • Joined in April of 2017 • Over 30+ years of experience in lending throughout the Northeast ranging from large national and regional banks to local community banks • Joined in December of 2014 • 9+ years in various risk management roles within banking 6 |
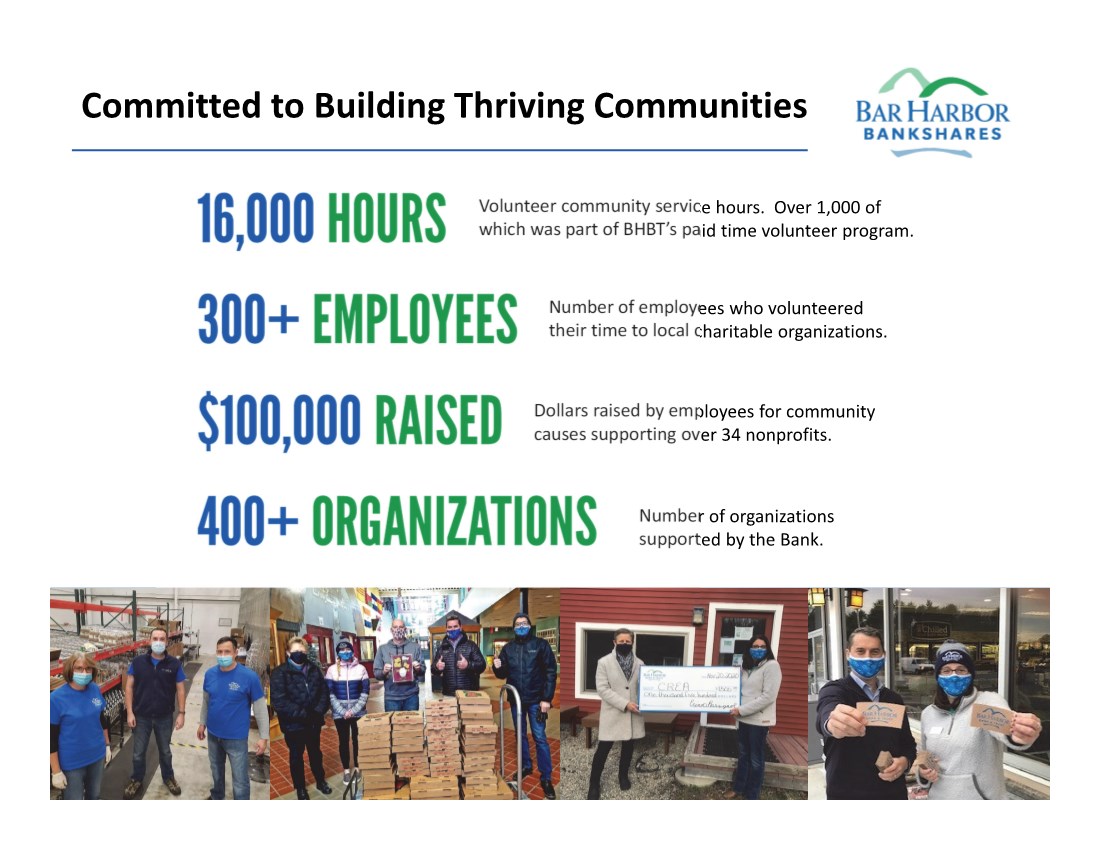
| Committed to Building Thriving Communities Volunteer community service hours. Over 1,000 of which was part of BHBT’s paid time volunteer program. Number of employees who volunteered their time to local charitable organizations. Dollars raised by employees for community causes supporting over 34 nonprofits. Number of organizations supported by the Bank. |
|

| BHB: Investment Summary • Long before the COVID‐19 pandemic, we set out to build a balanced Bank that is not reliant on any one business, with a strong risk‐focused credit culture, and a judicious approach to managing capital • Growing market share as our customer service differentiates us from our competition • Focusing on core earnings as we balance growth with profitability • Growing core deposits while reducing overall cost of funds • Adhering to a disciplined credit culture with historic low charge‐off rates • Expanding non‐interest income as a percentage of total revenue • Efficiently managing non‐interest expenses while investing in infrastructure, digital platforms, Call Center, info security and operations • We have a talented team and firm culture in place to carry out our strategies in all economic environments 9 |
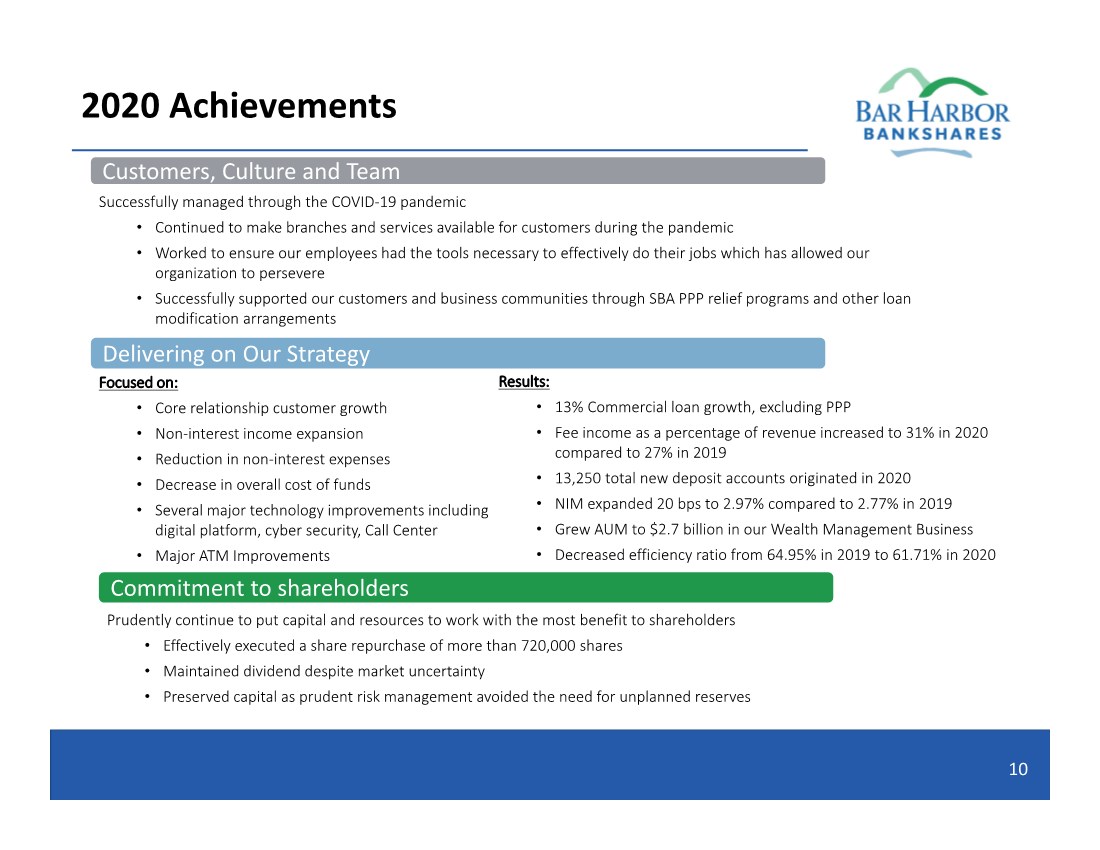
| 2020 Achievements 10 Customers, Culture and Team Delivering on Our Strategy Commitment to shareholders Successfully managed through the COVID‐19 pandemic • Continued to make branches and services available for customers during the pandemic • Worked to ensure our employees had the tools necessary to effectively do their jobs which has allowed our organization to persevere • Successfully supported our customers and business communities through SBA PPP relief programs and other loan modification arrangements Focused on: • Core relationship customer growth • Non‐interest income expansion • Reduction in non‐interest expenses • Decrease in overall cost of funds • Several major technology improvements including digital platform, cyber security, Call Center • Major ATM Improvements Prudently continue to put capital and resources to work with the most benefit to shareholders • Effectively executed a share repurchase of more than 720,000 shares • Maintained dividend despite market uncertainty • Preserved capital as prudent risk management avoided the need for unplanned reserves Results: • 13% Commercial loan growth, excluding PPP • Fee income as a percentage of revenue increased to 31% in 2020 compared to 27% in 2019 • 13,250 total new deposit accounts originated in 2020 • NIM expanded 20 bps to 2.97% compared to 2.77% in 2019 • Grew AUM to $2.7 billion in our Wealth Management Business • Decreased efficiency ratio from 64.95% in 2019 to 61.71% in 2020 |
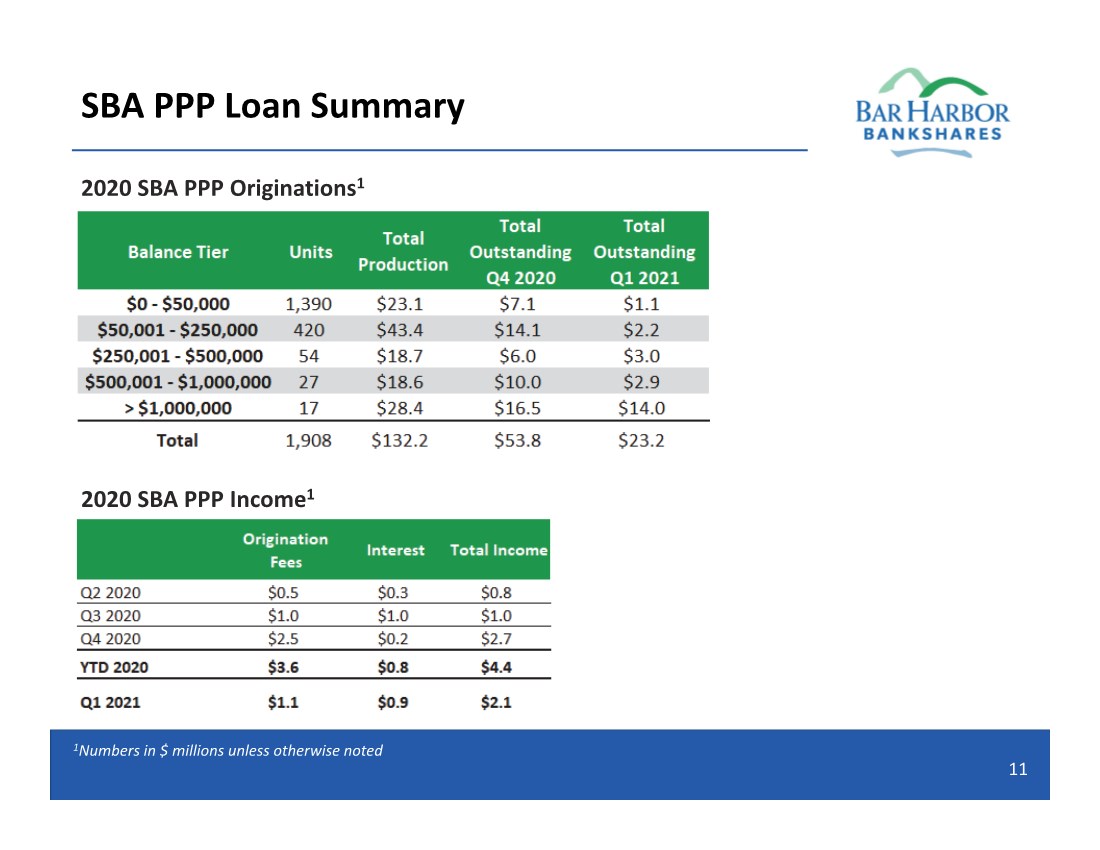
| SBA PPP Loan Summary 11 2020 SBA PPP Originations1 2020 SBA PPP Income1 1Numbers in $ millions unless otherwise noted |
| Q1 2021 Overview 12 Results1 Looking Forward….. • 1.03% return on assets; 1.11% core return on assets2 • 8% annualized total commercial loan growth, excluding PPP loans • 12% annualized increase in core‐deposits • 5% increase in pre‐tax, pre‐provision net revenue; 13% excluding non‐core charges2 • 22% increase in fee‐based income; Wealth Management income increased 9% based on 23% growth in AUM • Announced increased dividend by 9% effective Q2 2021 • The Bank continues to focus on profitability from both a revenue and expense side • In 2020, we executed a fee income growth strategy which was implemented in January 2021; Expanding our non‐interest income remains a top priority • In the first quarter, the Bank initiated a strategic non‐interest expense review consisting of two phases • Phase I of the recommendations have been implemented and will result in a decrease of salary and benefits by more than $3.0 million annualized starting in Q2 2021 • Phase II recommendations relate to process improvements and/or consolidations, and vendor contracts which will generate further cost reductions over various timeframes 1Results are compared to Q1 2020, unless otherwise stated 2Non‐GAAP, see appendix for GAAP reconciliation |
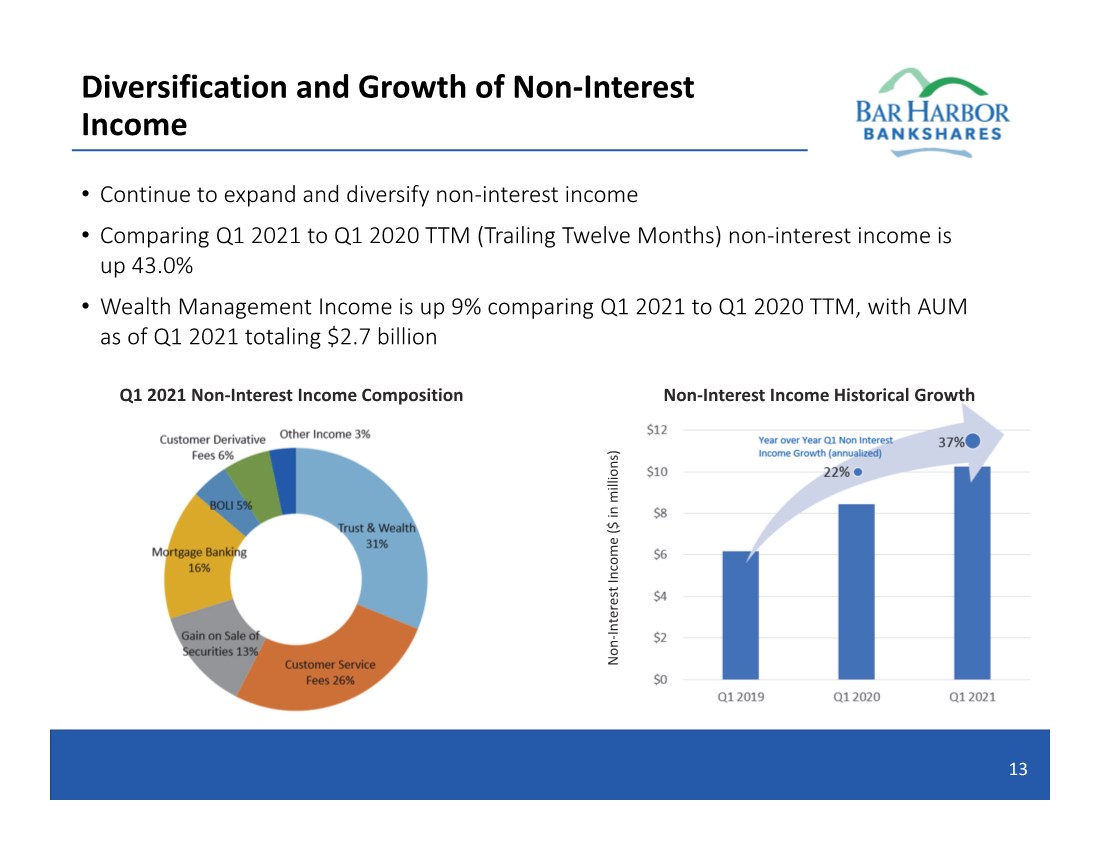
| Diversification and Growth of Non‐Interest Income • Continue to expand and diversify non‐interest income • Comparing Q1 2021 to Q1 2020 TTM (Trailing Twelve Months) non‐interest income is up 43.0% • Wealth Management Income is up 9% comparing Q1 2021 to Q1 2020 TTM, with AUM as of Q1 2021 totaling $2.7 billion 13 Non ‐ Interest Income ($ in millions) Q1 2021 Non‐Interest Income Composition Non‐Interest Income Historical Growth |
| Prudent Balance Sheet Management 14 Liquidity Interest Rate Risk (IRR) Positioning & Modeling Enhancements • Grew total deposits by 9.8%, and opened 13,250 deposit accounts over the LTM ending Q1 2021 vs. Q1 2020 • Further reduced loan to deposit ratio to 87.9% for Q1 2021 vs. 99.4% in Q1 2020 • Enhanced ability and size of pledgable securities at FHLB • Expanded our liquidity stress testing capabilities and reporting • Increased and expanded our use of testing and enhancing various liquidity lines (PPPLF, third party credit lines, FHLB, FRB, etc.) • The Bank’s risk position is moderately asset sensitive • A strategic shift was made to sell more longer‐term fixed rate mortgages versus putting them on the balance sheet • Given the changing rate environment and behaviors observed, institution‐specific cash flow assumptions were implemented • Enhanced and expanded our use of models within the organization, strengthening various ALM assumptions and testing methods 1Core Deposits are considered DDA, Non‐Interest Bearing, NOW, Savings and Money Market Accounts, Non‐Core is considered Time Deposits |
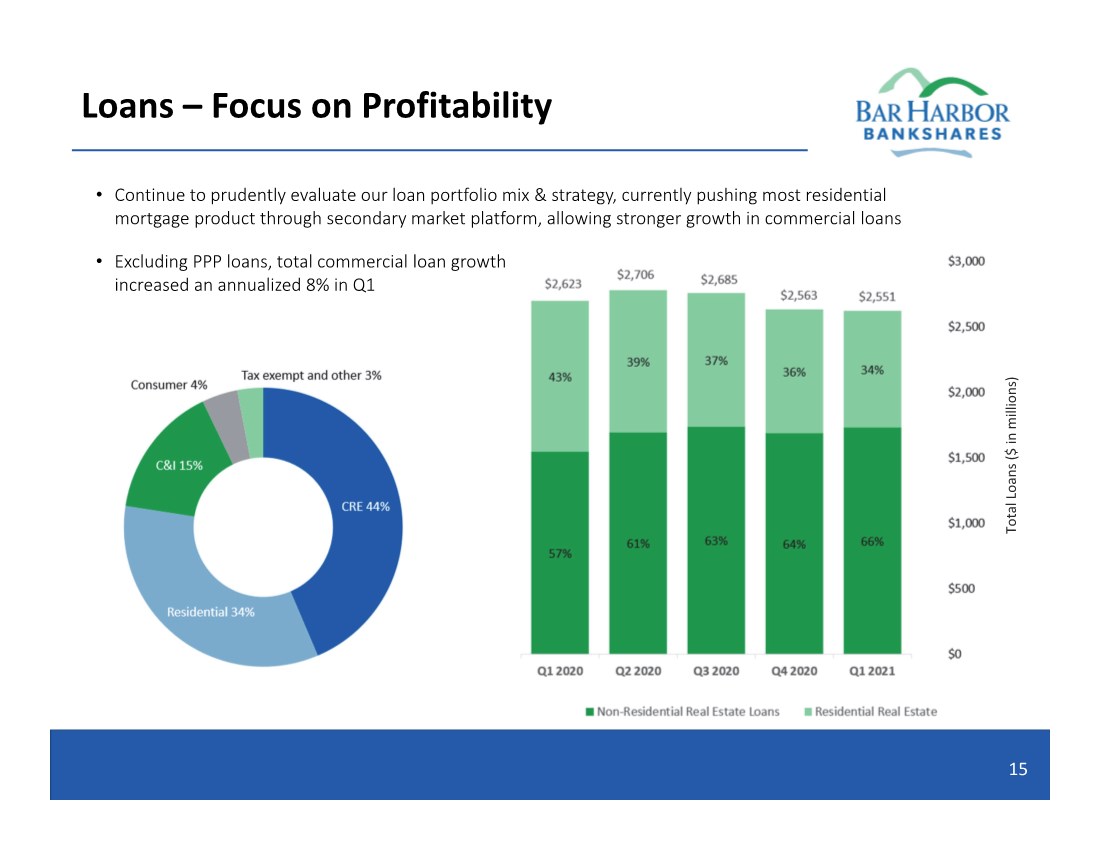
| Loans –Focus on Profitability 15 Total Loans ($ in millions) • Excluding PPP loans, total commercial loan growth increased an annualized 8% in Q1 • Continue to prudently evaluate our loan portfolio mix & strategy, currently pushing most residential mortgage product through secondary market platform, allowing stronger growth in commercial loans |
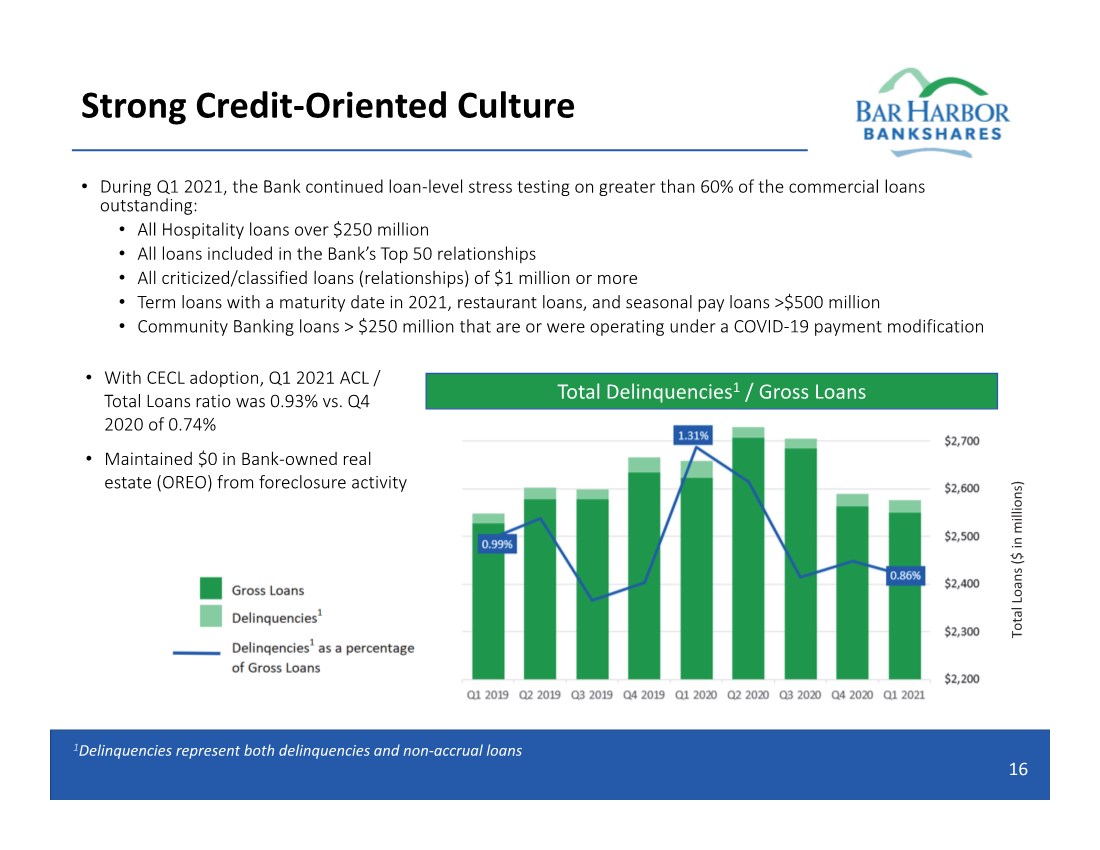
| Strong Credit‐Oriented Culture • During Q1 2021, the Bank continued loan‐level stress testing on greater than 60% of the commercial loans outstanding: • All Hospitality loans over $250 million • All loans included in the Bank’s Top 50 relationships • All criticized/classified loans (relationships) of $1 million or more • Term loans with a maturity date in 2021, restaurant loans, and seasonal pay loans >$500 million • Community Banking loans > $250 million that are or were operating under a COVID‐19 payment modification 16 • With CECL adoption, Q1 2021 ACL / Total Loans ratio was 0.93% vs. Q4 2020 of 0.74% • Maintained $0 in Bank‐owned real estate (OREO) from foreclosure activity 1Delinquencies represent both delinquencies and non‐accrual loans Total Delinquencies1 / Gross Loans Total Loans ($ in millions) |
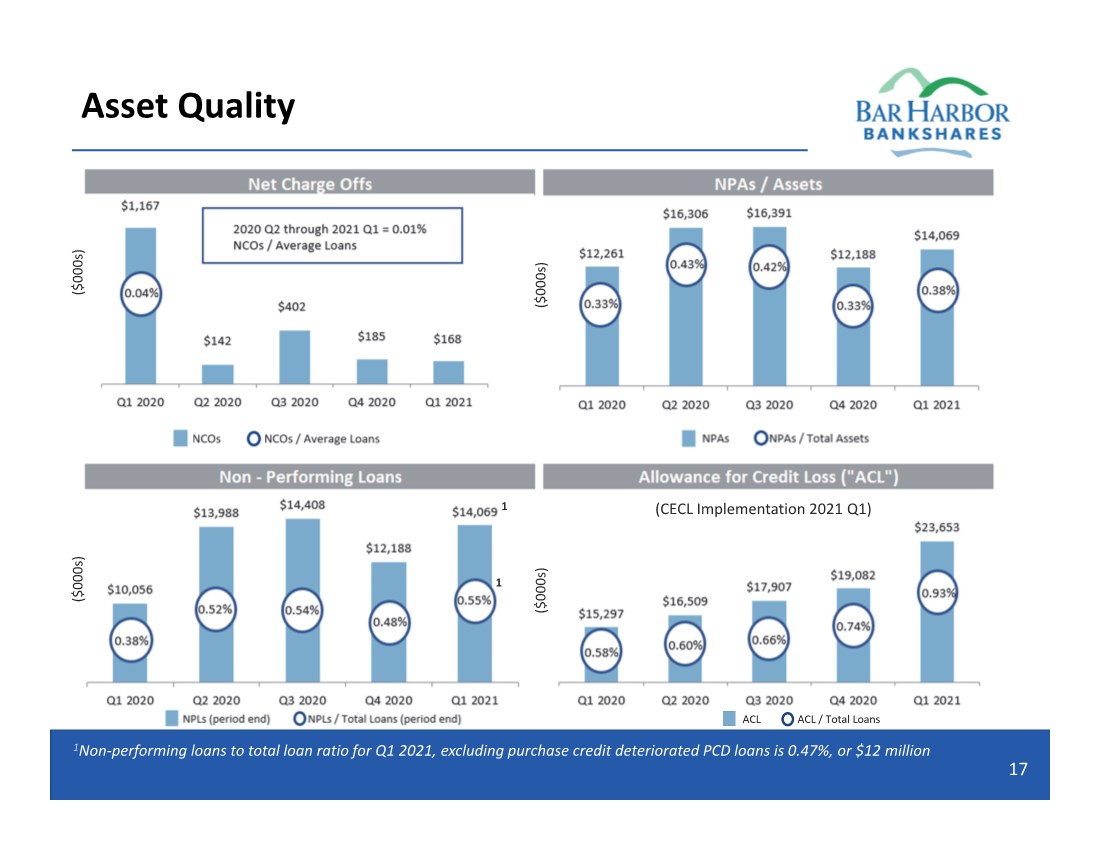
| Asset Quality 17 (CECL Implementation 2021 Q1) ($000s) ($000s) ($000s) ($000s) 1Non‐performing loans to total loan ratio for Q1 2021, excluding purchase credit deteriorated PCD loans is 0.47%, or $12 million 1 1 |
| Loan Deferral Trends 18 Accommodation deferrals are both: • Scheduled to resume full P&I payments by June 2021 • Currently making interest‐only payments to the Bank |

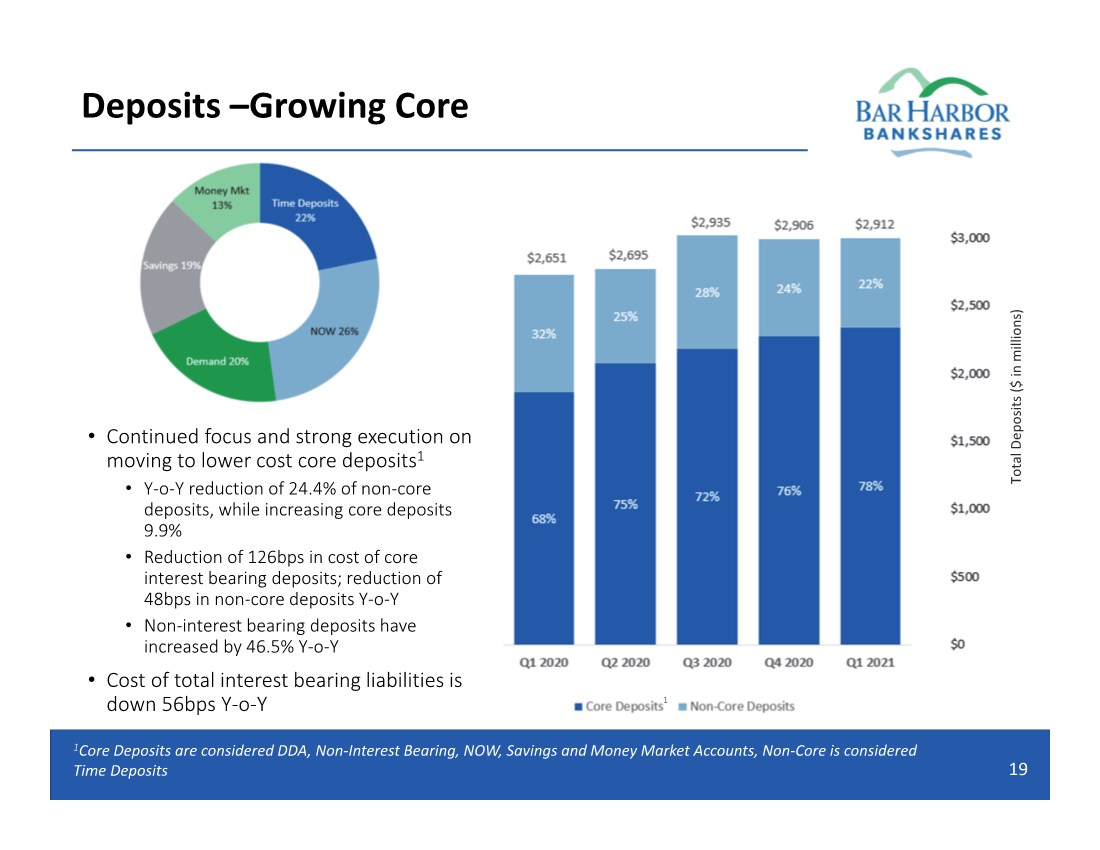
| Deposits –Growing Core • Continued focus and strong execution on moving to lower cost core deposits1 • Y‐o‐Y reduction of 24.4% of non‐core deposits, while increasing core deposits 9.9% • Reduction of 126bps in cost of core interest bearing deposits; reduction of 48bps in non‐core deposits Y‐o‐Y • Non‐interest bearing deposits have increased by 46.5% Y‐o‐Y • Cost of total interest bearing liabilities is down 56bps Y‐o‐Y 19 1 1Core Deposits are considered DDA, Non‐Interest Bearing, NOW, Savings and Money Market Accounts, Non‐Core is considered Time Deposits Total Deposits ($ in millions) |
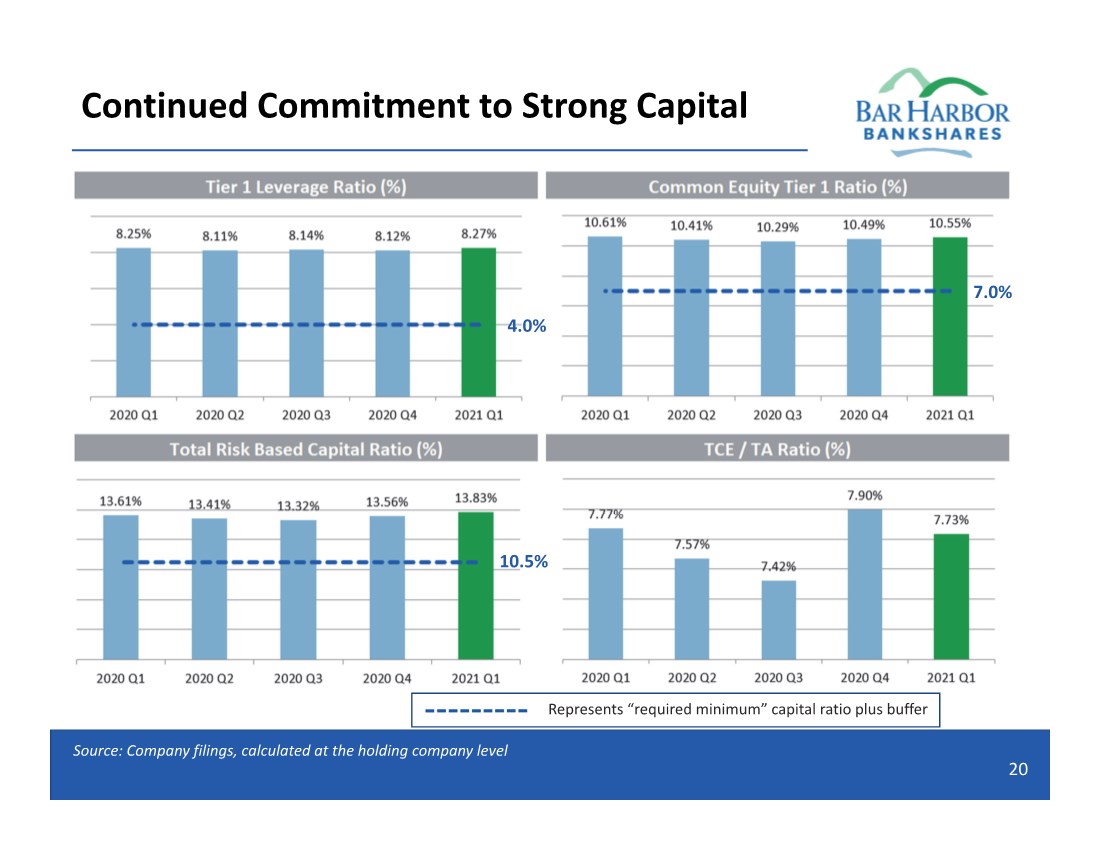
| Continued Commitment to Strong Capital 20 4.0% 10.5% 7.0% Represents “required minimum” capital ratio plus buffer Source: Company filings, calculated at the holding company level |
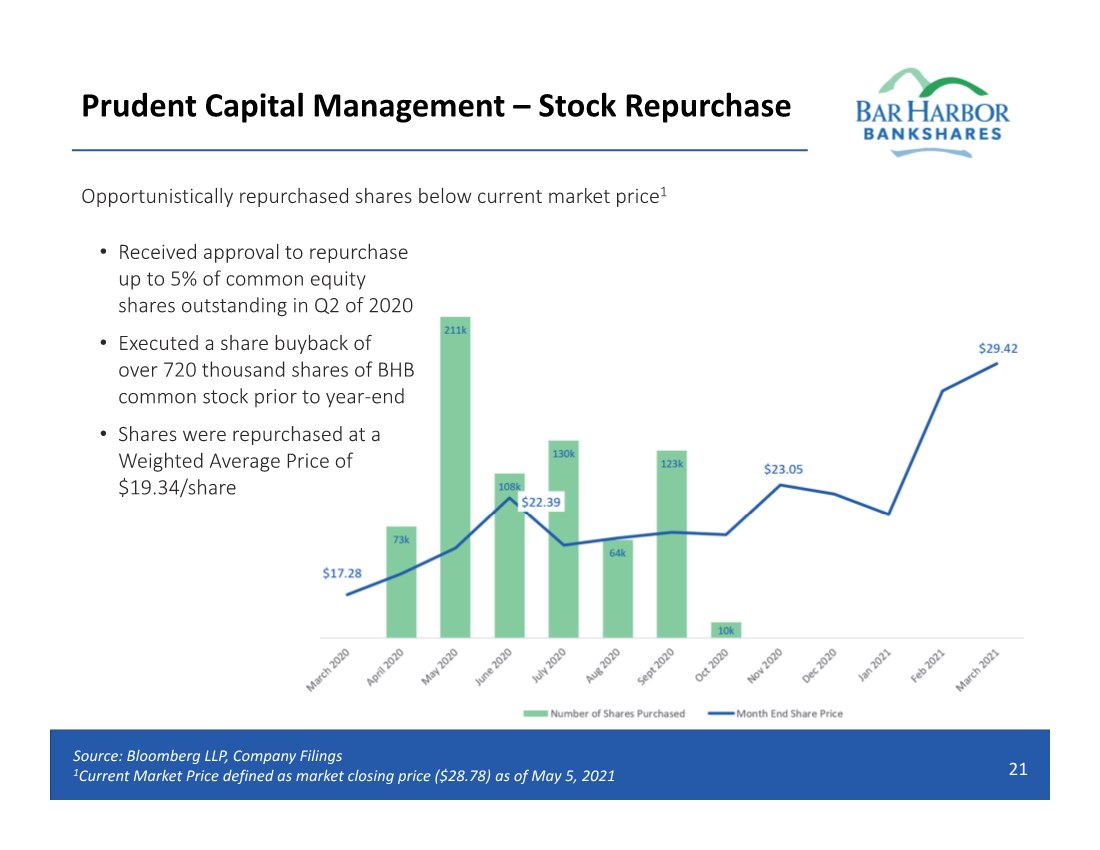
| Prudent Capital Management –Stock Repurchase 21 Source: Bloomberg LLP, Company Filings 1Current Market Price defined as market closing price ($28.78) as of May 5, 2021 Opportunistically repurchased shares below current market price1 • Received approval to repurchase up to 5% of common equity shares outstanding in Q2 of 2020 • Executed a share buyback of over 720 thousand shares of BHB common stock prior to year‐end • Shares were repurchased at a Weighted Average Price of $19.34/share |
| Investor Relations Contact Information 22 Facebook @BHBTsocial LinkedIn Bar Harbor Bank & Trust Twitter @barharborbank Connect with us on Social Media Visit our Website www.barharbor.bank/shareholder‐relations Contact by Phone (207)288‐2637 Write to us at Bar Harbor Bankshares Attn: Investor Relations PO Box 400 Bar Harbor, ME 04609‐0400 Contact by Email investorrelations@barharbor.bank |

|
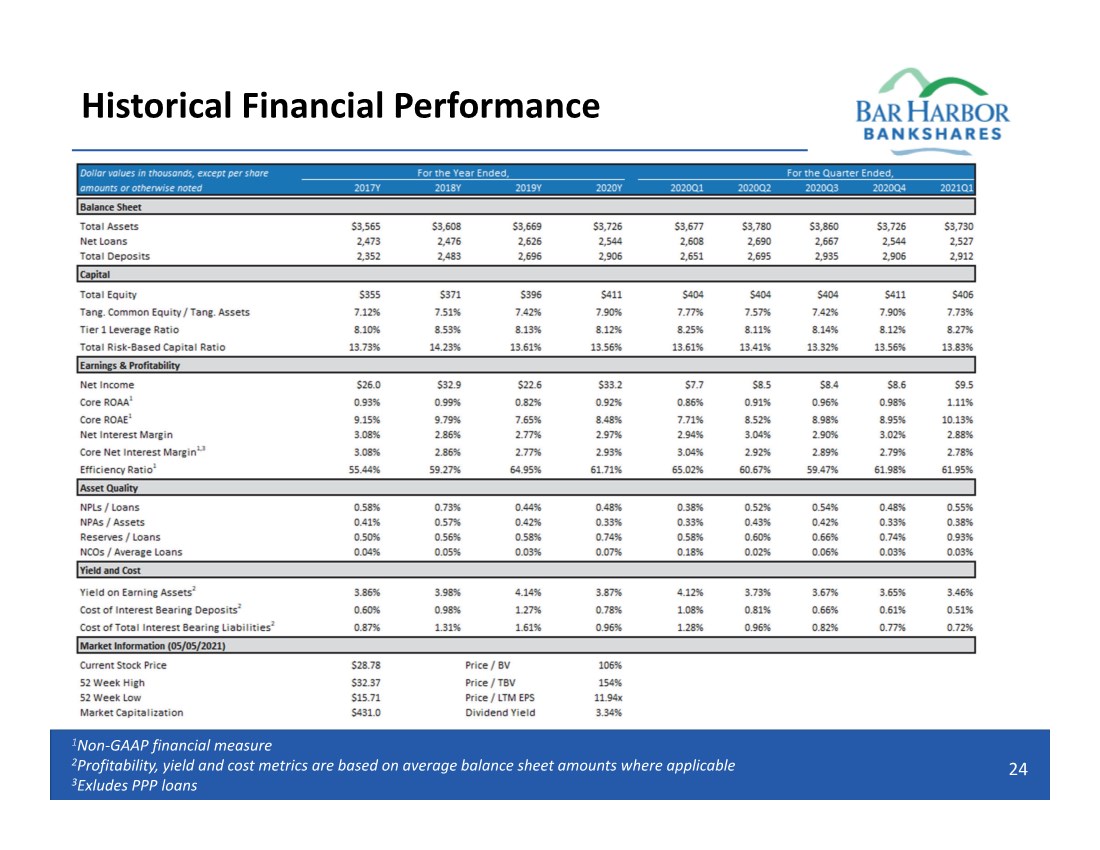
| Historical Financial Performance 24 1Non‐GAAP financial measure 2Profitability, yield and cost metrics are based on average balance sheet amounts where applicable 3Exludes PPP loans |
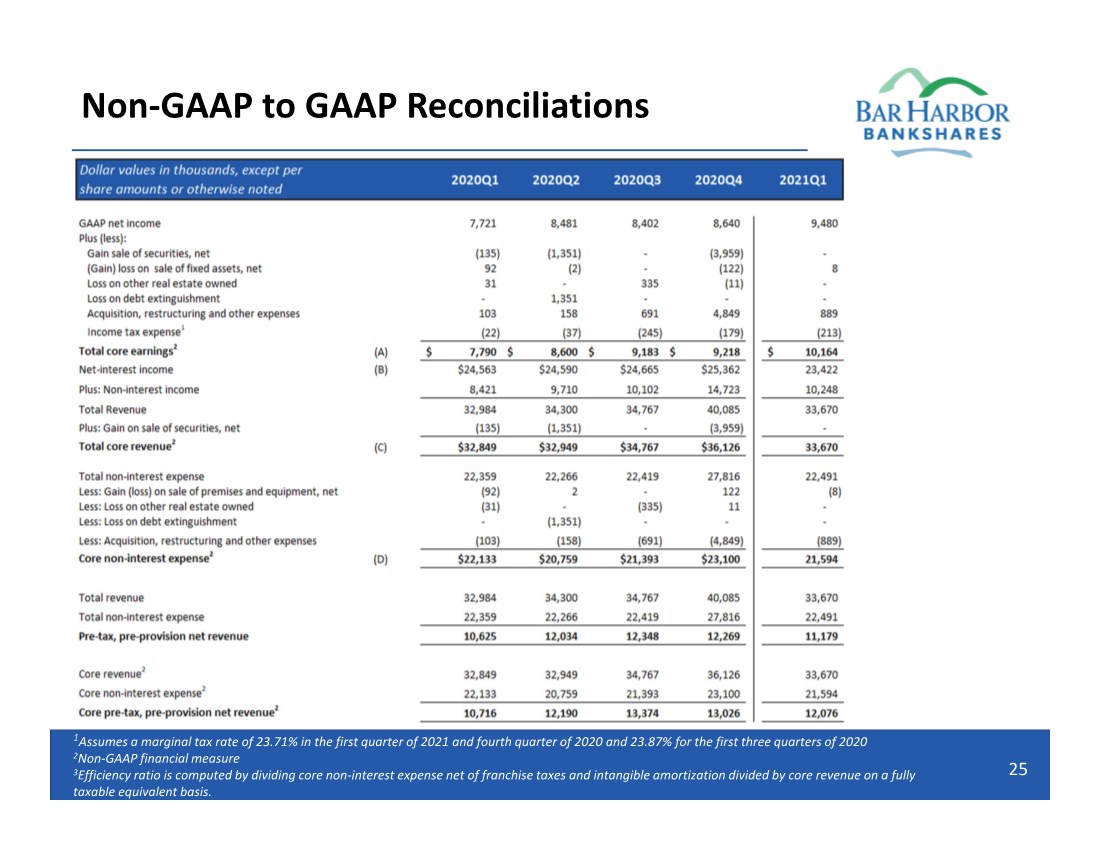
| Non‐GAAP to GAAP Reconciliations 25 1Assumes a marginal tax rate of 23.71% in the first quarter of 2021 and fourth quarter of 2020 and 23.87% for the first three quarters of 2020 2Non‐GAAP financial measure 3Efficiency ratio is computed by dividing core non‐interest expense net of franchise taxes and intangible amortization divided by core revenue on a fully taxable equivalent basis. |
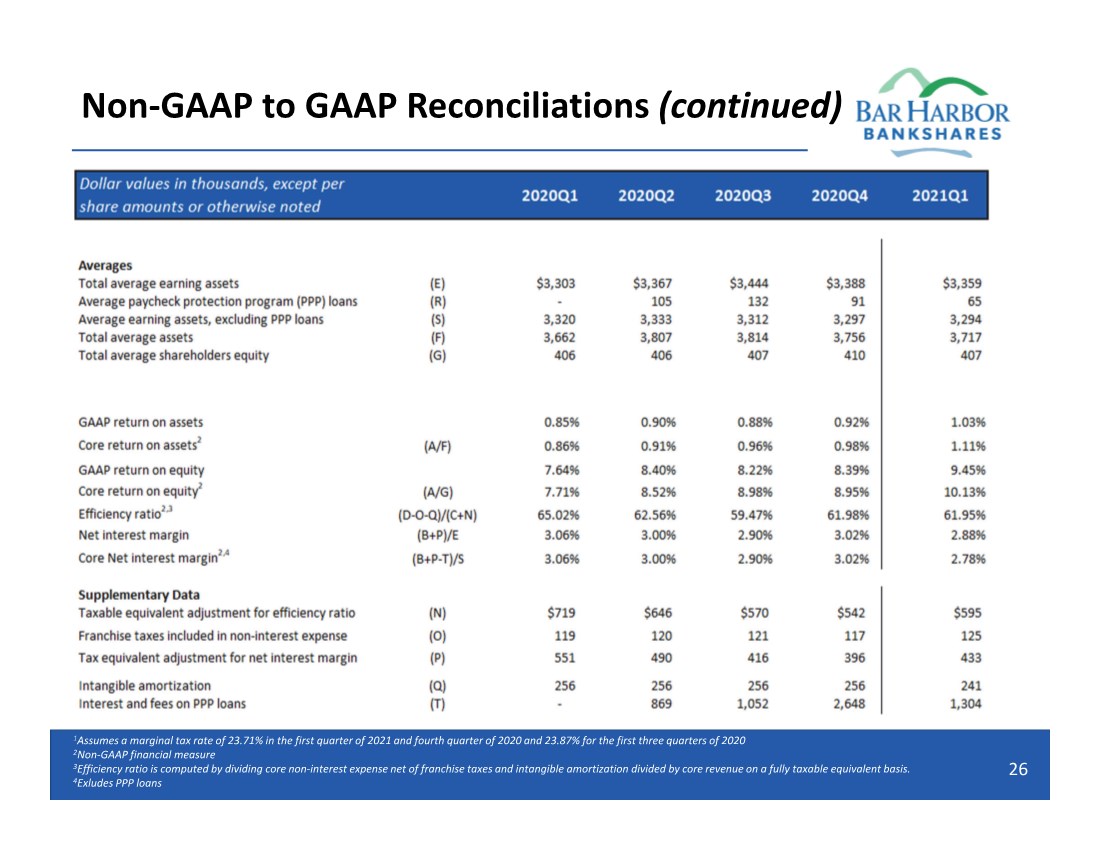
| Non‐GAAP to GAAP Reconciliations (continued) 26 1Assumes a marginal tax rate of 23.71% in the first quarter of 2021 and fourth quarter of 2020 and 23.87% for the first three quarters of 2020 2Non‐GAAP financial measure 3Efficiency ratio is computed by dividing core non‐interest expense net of franchise taxes and intangible amortization divided by core revenue on a fully taxable equivalent basis. 4Exludes PPP loans |
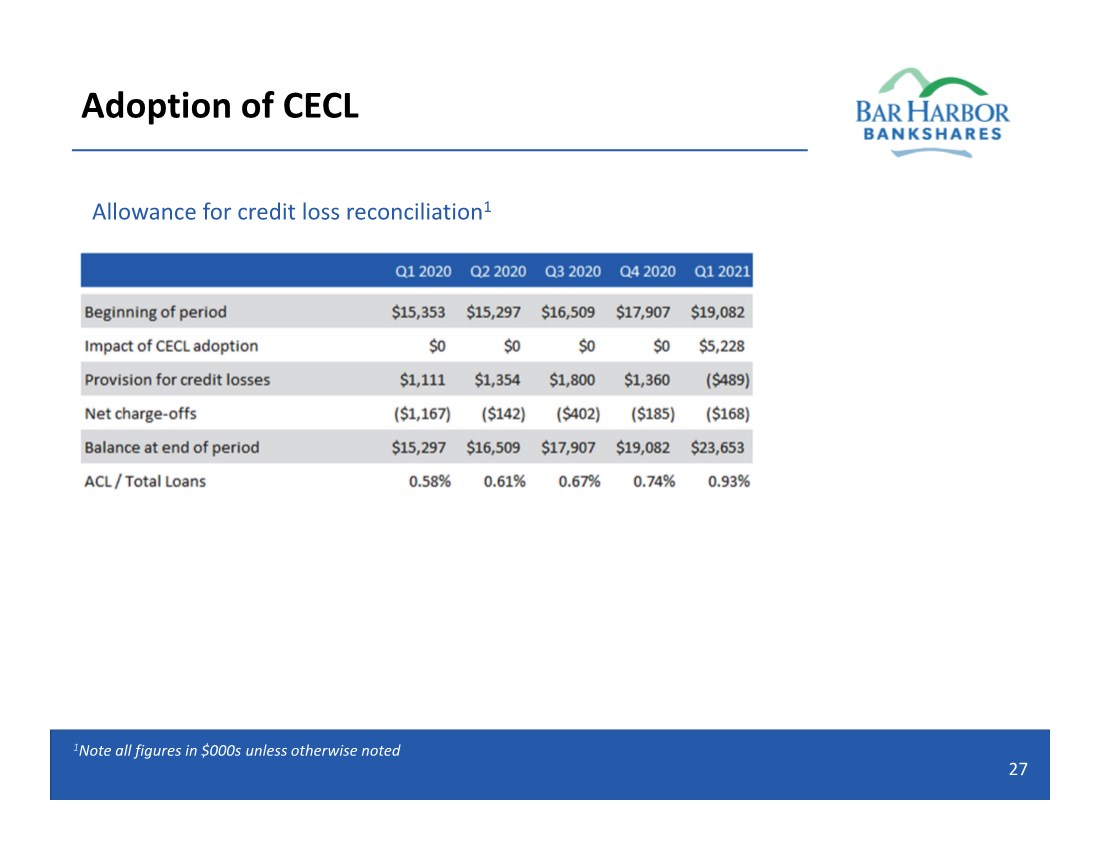
| Adoption of CECL 27 Allowance for credit loss reconciliation1 1Note all figures in $000s unless otherwise noted |
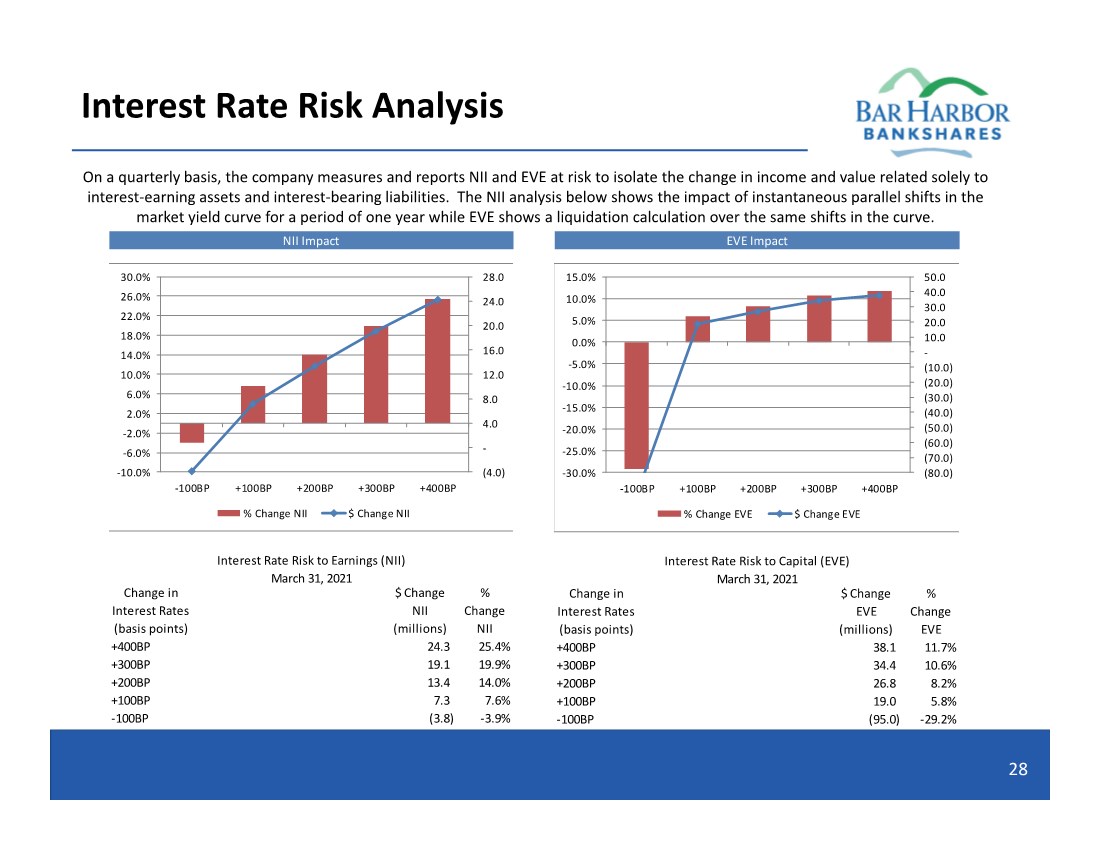
| Interest Rate Risk Analysis 28 On a quarterly basis, the company measures and reports NII and EVE at risk to isolate the change in income and value related solely to interest‐earning assets and interest‐bearing liabilities. The NII analysis below shows the impact of instantaneous parallel shifts in the market yield curve for a period of one year while EVE shows a liquidation calculation over the same shifts in the curve. Change in Interest Rates (basis points) $ Change NII (millions) % Change NII +400BP 24.3 25.4% +300BP 19.1 19.9% +200BP 13.4 14.0% +100BP 7.3 7.6% ‐100BP (3.8) ‐3.9% Interest Rate Risk to Earnings (NII) March 31, 2021 NII Impact (4.0) ‐ 4.0 8.0 12.0 16.0 20.0 24.0 28.0 ‐10.0% ‐6.0% ‐2.0% 2.0% 6.0% 10.0% 14.0% 18.0% 22.0% 26.0% 30.0% ‐100BP +100BP +200BP +300BP +400BP % Change NII $ Change NII Change in Interest Rates (basis points) $ Change EVE (millions) % Change EVE +400BP 38.1 11.7% +300BP 34.4 10.6% +200BP 26.8 8.2% +100BP 19.0 5.8% ‐100BP (95.0) ‐29.2% EVE Impact Interest Rate Risk to Capital (EVE) March 31, 2021 (80.0) (70.0) (60.0) (50.0) (40.0) (30.0) (20.0) (10.0) ‐ 10.0 20.0 30.0 40.0 50.0 ‐30.0% ‐25.0% ‐20.0% ‐15.0% ‐10.0% ‐5.0% 0.0% 5.0% 10.0% 15.0% ‐100BP +100BP +200BP +300BP +400BP % Change EVE $ Change EVE |