Attached files
| file | filename |
|---|---|
| EX-99.3 - EX-99.3 - ZIPRECRUITER, INC. | exhibit993-8xktranscriptof.htm |
| EX-99.1 - EX-99.1 - ZIPRECRUITER, INC. | exhibit991-8xkpressrelease.htm |
| EX-3.2 - EX-3.2 - ZIPRECRUITER, INC. | exhibit32-8xkearnings.htm |
| EX-3.1 - EX-3.1 - ZIPRECRUITER, INC. | exhibit31-8xkearnings.htm |
| 8-K - 8-K - ZIPRECRUITER, INC. | a8-kearnings.htm |
Exhibit 99.2


The testimonials included in this presentation were acquired by ZipRecruiter without compensation to these individuals or their employers, and may not be indicative of every user’s experience on ZipRecruiter.
To Our Shareholders
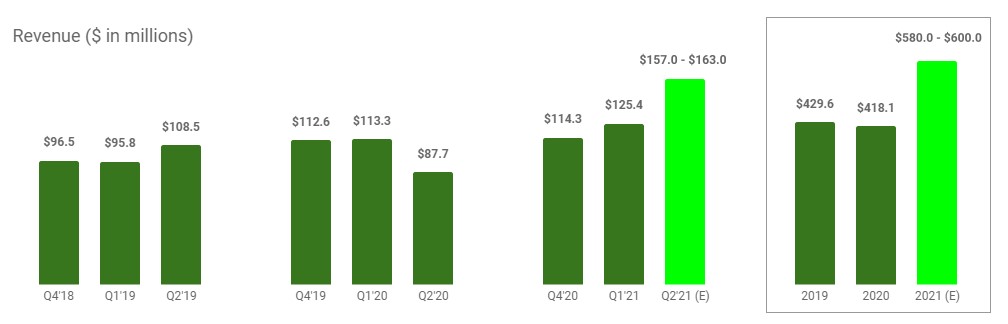
The first quarter of 2021 was an inflection point for ZipRecruiter, with our momentum accelerating as the hiring market continued to rebound impressively from the pandemic-driven downturn. In Q1’21, we generated $125.4 million in revenue, up 11% y/y. In terms of profitability, we posted $13.4 million in net income with a net income margin of 11%. We generated $20.0 million of Adjusted EBITDA during the quarter, with an Adjusted EBITDA margin of 16%. Despite the ongoing uncertainty of how the economy will recover from COVID-19, we remain optimistic that ZipRecruiter is in the early stages of a sustained economic recovery and our Q2’21 guidance reflects robust sequential revenue growth. We believe this once-in-a-lifetime reopening of the economy provides a compelling opportunity to help to put America back to work while continuing to invest in building our marketplace.
We have reached a level of scale and maturity in our business where we believe the time is right for ZipRecruiter to become a public company. To that end, in April we publicly filed a registration statement on Form S-1 with the U.S. Securities and Exchange Commission for a direct listing. Our registration statement was declared effective on May 14th, and we anticipate that our stock will begin trading on the New York Stock Exchange under the ticker “ZIP” on May 26th. We believe becoming a public company will enable us to further accelerate our journey and achieve our mission of actively connecting people to their next great opportunity.
We have elected a direct listing to enter the public markets for two fundamental reasons:
1) Given the strength of our balance sheet and cash flow generation over the past three quarters, we believe we have the capital we need to invest in our business as the economy reopens without raising additional equity.
2) Transparency and openness are core values of ZipRecruiter, and a direct listing can give our shareholders immediate access to the market.
While our Q1’21 results are in our registration statement, we are pleased to share them with you today in the shareholder letter format that we intend to use for our quarterly updates, along with our guidance. We welcome you to join our conference call today at 1:30 p.m. PT and look forward to keeping analysts and investors updated on our progress.
 | Q1 | 2021 Shareholder Letter | 3 | ||||||
First Quarter 2021 Key Results
| Revenue | $125.4 million 11% y/y growth | ||||
Quarterly Paid Employers(1) | 114.7K 17% y/y growth | ||||
Revenue per Paid Employer(1) | $1,093 (5)% y/y growth | ||||
| Gross Margin | 87% | ||||
| Net Income | $13.4 million | ||||
| Net Income Margin | 11% +2,047 bps y/y improvement | ||||
Adjusted EBITDA(1) | $20.0 million | ||||
Adjusted EBITDA Margin(1) | 16% +2,158 bps y/y improvement | ||||
Financial Outlook
| Q2 2021 | FY 2021 | |||||||
| Revenue | $157.0 - $163.0 million 79% - 86% y/y growth | $580.0 - $600.0 million 39% - 44% y/y growth | ||||||
Adjusted EBITDA(1) | $(22.0) - $(16.0) million (14)% - (10)% Adjusted EBITDA margin | $20.0 - $28.0 million 3% - 5% Adjusted EBITDA margin | ||||||
(1) See “Key Operating Metrics and Non-GAAP Financial Measures” below for additional information regarding non-GAAP metrics used in this shareholder letter and a reconciliation of GAAP net income (loss) to Adjusted EBITDA.
| Q1 | 2021 Shareholder Letter | 4 | ||||||
Growth Strategies and Recent Progress
There are three key pillars to our strategy to grow the ZipRecruiter marketplace over time, all three of which we continued to make steady progress toward in Q1’21.
Growth Strategy #1: Increase the number of employers in the ZipRecruiter marketplace
The first pillar of our growth strategy is driving more employers to the ZipRecruiter marketplace, from SMBs to Fortune 500 companies. The online segment of the recruiting market in the U.S. was only 6% of the total U.S. recruiting and staffing agency market in 2020, but is expected to grow by 33% over the next four years.1 ZipRecruiter is focused on meaningfully reducing the time associated with making a new hire. Our technology delivers high-quality matches immediately after a job goes live and provides tools to streamline the vetting process.
We introduced several new employer-focused features in Q1’21. For example, many employers lose top candidates to more agile competitors by taking too long to contact them. The "Act Fast" feature helps employers avoid this costly mistake by giving them valuable information about the status of applicants.

We are also happy to report that we served a record number of Paid Employers in the ZipRecruiter marketplace this quarter. This was the result of our highly focused and efficient sales and marketing efforts, coupled with strong brand awareness among employers. We believe we are just beginning our next stage of growth. America is ready to hire again and ZipRecruiter is better positioned than ever to help companies of all sizes find great talent.
Growth Strategy #2: Expand the job seeker side of the ZipRecruiter marketplace
The second pillar of our growth strategy is to drive more job seekers into our marketplace. ZipRecruiter simplifies the job market for both job seekers and employers. For job seekers across all industries and levels of seniority, we operate like a dedicated recruiter. That means presenting strong-fit job opportunities, proactively pitching potential candidates to employers, and providing job seekers with updates on the status of their applications. This makes job seekers
1 Based on the following published reports: (1) IBISWorld Inc., Office Staffing & Temp Agencies in the US, December 2020, (2) IBISWorld Inc., Employment & Recruiting Agencies in the US, March 2021, and (3) IBISWorld Inc., Online Recruitment Sites, March 2021.
| Q1 | 2021 Shareholder Letter | 5 | ||||||
feel supported while searching for work. This is why ZipRecruiter has been the #1 rated job seeker app on iOS and Android for the past four years.2
While employers have come roaring back into the job market, job seekers have returned more slowly through Q1’21. Job seeker activity is approximately 20%3 below pre-pandemic levels despite over 16 million people being unemployed or underemployed.4 On top of this, BLS JOLTS report data show there are millions of people who are currently employed who would have switched jobs over the past year,5 but have remained with their current employer. We believe as the vaccination rate climbs, schools reopen, and stimulus extensions expire there will be a surge in job seeker activity. We view this as an incredible opportunity and will be investing heavily in marketing to build brand awareness with job seekers in the same manner that we have with employers.
In Q1’21, we launched our very first TV commercial targeting job seekers. This TV spot was launched nationally and features a fictional job seeker describing how after weeks of looking for a job, ZipRecruiter worked “like a free personal recruiter,” leading him to a great job. This is only the beginning of our marketing journey with job seekers. We are excited to apply the same scientific, data-driven marketing discipline we have used over the years to achieve 82% aided brand awareness6 with U.S. employers to acquire and engage the broader job seeker community.

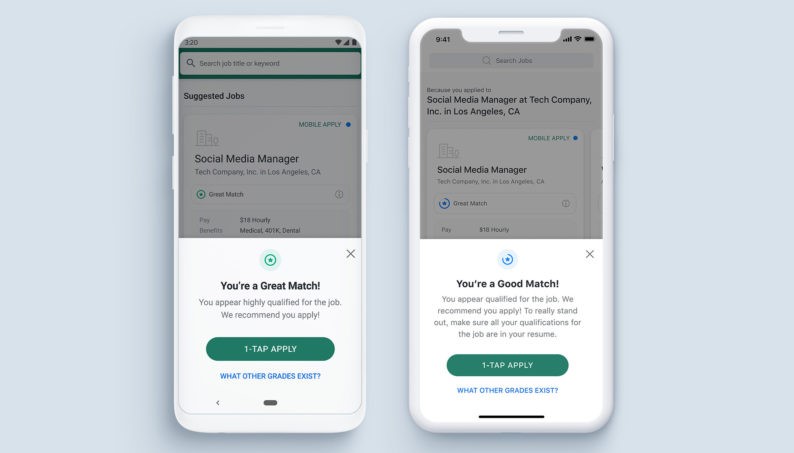
One of the more daunting challenges a job seeker faces when looking for work is not knowing how good a fit they may be for a specific role. In the first quarter, we started promoting “Insights,” a new feature that proactively shows a job seeker how closely their training and experience match up with an employer’s job. Job seekers will see a match score on job ads—Great Match, Good Match, Fair Match, or Not a Match. This encourages job seekers to apply to jobs where they are more likely to get a positive response, creating a more satisfying job search experience.
2 Based on ratings information for the Google Play Store and Apple App Store from the AppFollow platform during the period of March 2017 to March 2021 for the job seeker apps of ZipRecruiter, CareerBuilder, Craigslist, Glassdoor, Indeed, LinkedIn,
and Monster.
3 There is no official nationwide measure of job search activity, but the civilian labor force has fallen by 3.89 million since February 2020, according to the U.S. Bureau of Labor Statistics, and online searches for terms like “find a job” are well below the pre-pandemic peak week of February 2, 2020.
4 U.S. Bureau of Labor Statistics and U.S. Census Bureau, Current Population Survey. The number of unemployed and underemployed is a sum of Total Unemployed + the number of persons not in the labor force but who currently want a job = 9.81 million + 6.65 million= 16.46 million.
5 U.S. Bureau of Labor Statistics, Job Openings and Labor Turnover Survey. 42.1 million people quit their jobs in 2019, but quits plummeted during the early months of the pandemic. Overall, only 36.4 million quit their jobs in 2020. https://fred.stlouisfed.org/graph/?g=DrLi. The decline in quits amounted to 5.8 million.
6 Based on an internal company-designed survey of 602 participants conducted in 2020.
| Q1 | 2021 Shareholder Letter | 6 | ||||||
 | |||||
 | |||||
ZipRecruiter’s Co-founder and CEO, Ian Siegel, published Get Hired Now! in the first quarter to provide an additional resource to job seekers. The Wall Street Journal bestseller includes data-driven insights and anecdotes from Ian’s time helping millions of job seekers find their next great opportunity. The book also provides step-by-step | |||||
instructions for writing a resume that works, identifying the right jobs to apply to, acing a job interview, and negotiating a job offer. Relevant for every stage of a job seeker’s career and for every industry, Get Hired Now! is a one-stop resource for job seekers looking to level up, stand out, and land their dream job. | |||||
We anticipate continuing to launch several other features and enhancements for job seekers in 2021. Nothing is more critical to our mission of actively connecting people to their next great opportunity than being ready to help job seekers as America gets back to work after the pandemic.
Growth Strategy #3: Making our matching technology smarter over time
The third pillar of our strategy is bringing both sides of our marketplace together, connecting people to their next great opportunity. For years we have been relentlessly developing our AI-driven job matching technology. That singular focus continues, and we maintain our dedication to helping job seekers get back to work and employers find the best talent quickly.
We consistently release improvements to our matching technology. For example, we recently launched a way for employers with urgent hiring needs to attract more job seeker traffic to their jobs by letting job seekers know that they intend to move quickly toward a hiring decision. This allows job seekers with similarly urgent job search goals to prioritize those jobs.
While we are pleased with our progress to date, we have increasing levels of conviction that we are just beginning to see the digital transformation of the hiring process that our matching technology has the potential to enable.
| Q1 | 2021 Shareholder Letter | 7 | ||||||
Doubling down on making ZipRecruiter a great place to work
 | Our people and culture are our greatest assets. During the first quarter, we were honored to receive two awards from Comparably recognizing ZipRecruiter as one of the Best Places to Work in Los Angeles and one of the Best Sales Teams. Comparably relies on direct, anonymous feedback from current employees to inform these decisions. We were especially pleased to receive these awards during such an unprecedented time. The commitment shown by the ZipRecruiter team, working harder than ever to keep the company moving forward, was inspired by the incredible resilience we witnessed among our job seekers and employers. Moving our tight-knit global workforce to a fully remote operating rhythm brought an additional set of challenges. The shared sense of adversity we felt over the past year only increases the satisfaction we feel in receiving these awards and reinforces our commitment to make ZipRecruiter a great place to work. It is heartening to see that both our Los Angeles, CA headquarters and Tempe, AZ-based sales operations truly reflect our company values. | ||||
 | |||||
| Q1 | 2021 Shareholder Letter | 8 | ||||||
Q1’21 Financial Discussion
Unless otherwise noted, all comparisons are presented on a year-over-year basis. Revenue Revenue for Q1’21 was $125.4 million, up 11% y/y. The increase in revenue was mainly driven by the record growth in Quarterly Paid Employers. | 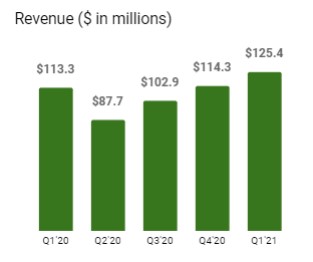 | ||||
Quarterly Paid Employers We had 114,705 Quarterly Paid Employers in Q1’21, up 17% y/y. We saw an increase in both the number of employers returning to our site to post jobs, as well as new employers entering our marketplace. | 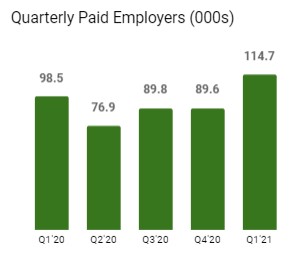 | ||||
Revenue per Paid Employer Revenue per Paid Employer was $1,093, down 5% y/y. This decline was the result of the large influx of new Quarterly Paid Employers toward the end of the quarter. We did not realize a full quarter of revenue from these new customers which brought the average down. | 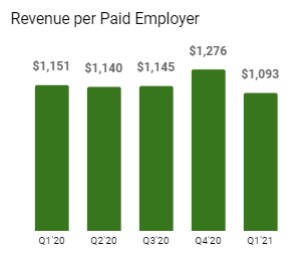 | ||||
Gross Profit and Margin Gross profit for Q1’21 was $109.4 million, up 11% y/y. This increase was driven by the increase in revenue. Gross margin remained consistently strong at 87%. | 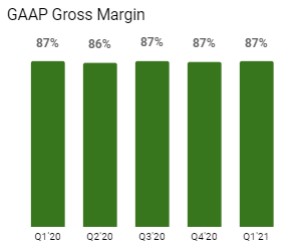 | ||||
Operating Expenses Total operating expenses on a GAAP basis for Q1’21 were $92.9 million, compared to $109.6 million in Q1’20. The decrease in total operating expenses y/y is largely due to reductions in marketing spend and reduced headcount. | |||||
Sales and Marketing (S&M) expenses were $63.5 million in Q1’21, or 51% of revenue, compared to $78.9 million, or 70% of revenue in Q1’20. The y/y decrease in sales and marketing expense was largely driven by reduced marketing and headcount expenses. The 51% of revenue spent on S&M in Q1’21 represented the largest expenditure on go-to-market activities since the beginning of the pandemic, and an increase of $21.0 million sequentially vs. Q4‘20. | 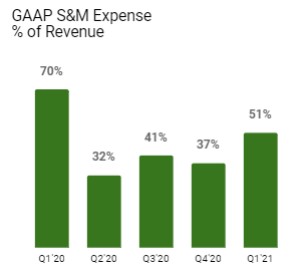 | ||||
| Q1 | 2021 Shareholder Letter | 9 | ||||||
Research and Development (R&D) expenses were $17.0 million in Q1’21, or 14% of revenue, compared to $19.2 million, or 17% of revenue in Q1’20. The decrease in research and development expense y/y was largely due to reduced headcount expense. | 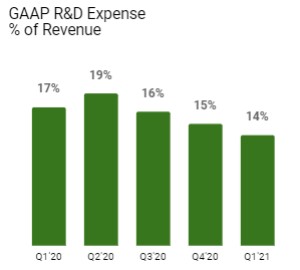 | ||||
General and Administrative (G&A) expenses were $12.5 million in Q1’21, or 10% of revenue, compared to $11.5 million, or 10% of revenue in Q1’20. The increase was primarily driven by professional fees related to the direct listing, which was partially offset by reduced headcount expense. | 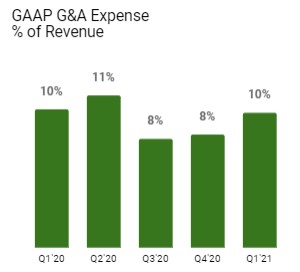 | ||||
Net Income and Adjusted EBITDA Net income was $13.4 million in Q1’21, compared to a net loss of $11.1 million in Q1’20. Adjusted EBITDA was $20.0 million, with a margin of 16%, compared to $(6.4) million, with a margin of (6)% in Q1’20. The increases were largely due to the increase in revenue, more efficient sales and marketing expenses and lower headcount-related expenses. | 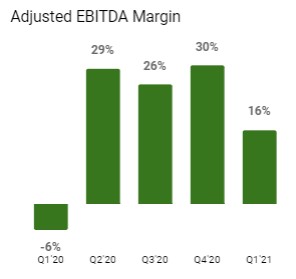 | ||||
| Q1 | 2021 Shareholder Letter | 10 | ||||||
Financial Outlook
Quarterly Guidance
We delivered outsized growth in Q1’21 and experienced increased activity in our marketplace as the country began to recover from the pandemic. We expect to deliver strong growth in Q2’21 as the economic recovery continues. Viewing Q2’21 revenue guidance of $157.0 to $163.0 million through the lens of 25% to 30% sequential growth, vs. 10% sequential growth in Q1’21, is a helpful framework to understand the magnitude of the re-acceleration we expect in Q2’21. The revenue increase we expect for Q2’21 is greater than any quarter in the history of our company and reflects our confidence in our team’s ability to take advantage of the reopening of the U.S. economy. Our Adjusted EBITDA outlook of $(22.0) to $(16.0) million or (14)% to (10)% Adjusted EBITDA margins for the quarter reflects both increasing investments in building our brand, plus one-time costs of approximately $32.0 million related to our direct listing.
Annual Guidance
While variability related to potential outcomes of the reopening of the economy makes annual forecasting difficult, we believe it is helpful to articulate our longer-term expectations for the macroeconomic backdrop as we give guidance as a newly public company. Within our guidance for the full year 2021, we presume a gradual return to a more traditional macroeconomic pattern by the end of the year. Our 2021 revenue guidance of $580.0 to $600.0 million equates to 39% to 44% growth over 2020, and would put us in line with our pre-COVID compounded growth trajectory in 2019, when we grew by 18% to $429.6 million. Our Adjusted EBITDA guidance of $20.0 to $28.0 million equates to an Adjusted EBITDA margin of 3% to 5%, above our pre-COVID Adjusted EBITDA margin of 2% in 2019, despite investing to achieve a substantially higher growth rate in the current period.
Long-Term Outlook
The macroeconomic outlook and the shape of the recovery remains uncertain; however, we believe that the economy is in the early phases of expansion after the COVID pandemic-driven downturn. In that context, our operating assumption is that, following a robust macroeconomic recovery in the first half of 2021, our growth will moderate in the second half of the year. Our guidance implies second half 2021 year-over-year revenue growth of approximately 40%. In 2022 and beyond, we expect our revenue growth to return to normalized pre-COVID growth rates. By increasing the number of job seekers and employers in our marketplace and continuing to enhance our matching technology, we believe we are poised to deliver both growth and
| Q1 | 2021 Shareholder Letter | 11 | ||||||
profitability over time.
We expect to continue investing in high ROI sales and marketing initiatives to grow our marketplace. Our 2021 Adjusted EBITDA margin guidance range of approximately 3% to 5% reflects this increased investment. In 2022, we expect our Adjusted EBITDA margin to increase to somewhere between the 3% to 5% margin expected in 2021 and the 19% margin we delivered in 2020. Over the long-term, we expect to achieve our Adjusted EBITDA margin target of 30%.
Recommitting to Our Mission As We Transition to a New Phase
As we begin life as a public company, we look forward to partnering with our new investors who share in our commitment to our mission. As noted in our founder letter in our registration statement on Form S-1, we love working at ZipRecruiter because what we do matters. We believe that jobs are fundamental. They help define who we are as individuals, can alter the trajectory of our lives, and shape the financial futures of our families. We pledge to work tirelessly to connect people to their next great opportunity, and play a leading role in getting America back to work.
| /s/ Ian Siegel | ||
Ian Siegel | ||
Chief Executive Officer | ||
| /s/ David Travers | ||
David Travers | ||
Chief Financial Officer | ||
| Q1 | 2021 Shareholder Letter | 12 | ||||||
Forward Looking Statements
This shareholder letter contains forward-looking statements within the meaning of the Private Securities Litigation Reform Act of 1995. All statements contained in this shareholder letter that do not relate to matters of historical fact should be considered forward-looking statements, including, without limitation, our market opportunity for the remainder of 2021; our anticipated launch of several other features and enhancements for job seekers in 2021; our belief that we are just beginning our next stage of growth; our belief regarding our positioning to help companies of all sizes find great talent; the future of digital transformation of the hiring process that our matching technology can enable; statements under the section titled "Financial Outlook", statements regarding our expected financial performance and operational performance for the second quarter of 2021 and the fiscal year ended December 31, 2021, our expected future Adjusted EBITDA profitability, as well as statements that include the words “expect,” “intend,” “plan,” “believe,” “project,” “forecast,” “estimate,” “may,” “should,” “anticipate” and similar statements of a future or forward-looking nature. These forward-looking statements are based on management's current expectations. These statements are neither promises nor guarantees, but involve known and unknown risks, uncertainties and other important factors that may cause actual results, performance or achievements to be materially different from any future results, performance or achievements expressed or implied by the forward-looking statements, including, but not limited to: our ability to attract and retain employers and job seekers; our ability to achieve profitability; our ability to maintain and enhance our brand; our dependence on macroeconomic factors; our ability to maintain and improve the quality of our marketplace; our dependence on the interoperability of our technology with mobile operating systems that we do not control; our ability to successfully implement our business plan during a global economic downturn caused by the COVID-19 pandemic that may impact the demand for our services or have a material adverse impact on our and our business partners’ financial condition and results of operations; our ability and the ability of third parties to protect our users’ personal or other data from a security breach and to comply with laws and regulations relating to consumer data privacy and data protection; our ability to detect errors, defects or disruptions in our technology; our ability to comply with the terms of underlying licenses of open source software components on our platform; our ability to expand into markets outside the United States; our ability to achieve desired operating margins; our compliance with a wide variety of U.S. and international laws and regulations; our ability to protect our intellectual property rights and to successfully halt the operations of copycat websites or misappropriation of data; our reliance on Amazon Web Services; our ability to mitigate payment and fraud risks; our dependence on relationships with payment partners, banks and disbursement partners; our dependence on our senior management and our ability to attract new talent; and the other important factors discussed under the caption “Risk Factors” in our Registration Statement on Form S-1/A filed with the U.S. Securities and Exchange Commission (“SEC”) on April 30, 2021. In addition, we operate in a very competitive and rapidly changing environment. New risks emerge from time to time. It is not possible for our management to predict all risks, nor can we assess the impact of all factors on our business or the extent to which any factor, or combination of factors, may cause actual results to differ materially from those contained in any forward-looking statements that we may make. In light of these risks, uncertainties and assumptions, the forward-looking events and circumstances discussed in this release are inherently uncertain and may not occur, and actual results could differ materially and adversely from those anticipated or implied in the forward-looking statements. Accordingly, you should not rely upon forward-looking statements as predictions of future events. In addition, the forward-looking statements made in this release relate only to events or information as of the date on which the statements are made in this release. Except as required by law, we undertake no obligation to update or revise publicly any forward-looking statements, whether as a result of new information, future events or otherwise, after the date on which the statements are made or to reflect the occurrence of unanticipated events.
| Q1 | 2021 Shareholder Letter | 13 | ||||||
Conference Call Details
We will host a conference call to discuss our financial results on Monday, May 17, at 1:30 p.m. Pacific Time. A live webcast of the call can be accessed from ZipRecruiter’s Investor Relations website. An archived version will be available on the website two hours after the call. Investors and analysts can participate in the conference call by dialing +1 (833) 979-2842, or +1 (236) 714-2904 for callers outside the United States and mention the passcode, “ZipRecruiter”, or by referencing conference ID “8391396”. A telephonic replay of the conference call will be available until 8:59 p.m. Pacific Time on May 24, 2021, beginning two hours after the end of the conference call. To listen to the replay please dial +1 (800) 585-8367 or +1 (416) 621-4642 for callers outside the United States and enter replay code “8391396”.
| Q1 | 2021 Shareholder Letter | 14 | ||||||
CONSOLIDATED BALANCE SHEETS
(in thousands)
| December 31, 2020 | March 31, 2021 | ||||||||||
| Assets | |||||||||||
| Current assets | |||||||||||
| Cash | $ | 114,539 | $ | 135,065 | |||||||
| Accounts receivable | 21,036 | 25,941 | |||||||||
| Prepaid expenses and other assets | 5,462 | 8,523 | |||||||||
| Deferred commissions, current portion | 3,727 | 3,870 | |||||||||
| Total current assets | 144,764 | 173,399 | |||||||||
| Property and equipment, net | 5,043 | 7,112 | |||||||||
| Operating lease right-of-use assets | 22,500 | 21,027 | |||||||||
| Internal use software, net | 11,191 | 11,114 | |||||||||
| Deferred commissions, net of current portion | 3,712 | 3,447 | |||||||||
| Goodwill | 1,724 | 1,724 | |||||||||
| Deferred tax assets, net | 23,083 | 19,932 | |||||||||
| Other assets | 112 | 53 | |||||||||
| Total assets | $ | 212,129 | $ | 237,808 | |||||||
| Liabilities, Redeemable Convertible Preferred Stock and Stockholders' Deficit | |||||||||||
| Current liabilities | |||||||||||
| Accounts payable | $ | 13,509 | $ | 11,485 | |||||||
| Accrued expenses | 38,842 | 44,711 | |||||||||
| Deferred revenue | 15,112 | 19,355 | |||||||||
| Deferred payroll tax liability, current portion | 1,677 | 1,677 | |||||||||
| Operating lease liabilities, current portion | 1,669 | 3,302 | |||||||||
| Other liabilities | 646 | 614 | |||||||||
| Total current liabilities | 71,455 | 81,144 | |||||||||
| Operating lease liabilities, net of current portion | 25,130 | 22,766 | |||||||||
| Convertible notes and accrued interest with related parties | 25,371 | 25,545 | |||||||||
| Deferred payroll tax liability, net of current portion | 1,818 | 1,829 | |||||||||
| Other liabilities | 1,795 | 2,066 | |||||||||
| Total liabilities | 125,569 | 133,350 | |||||||||
| Redeemable convertible preferred stock | |||||||||||
| Series A | 87,118 | 88,079 | |||||||||
| Series B | 49,738 | 49,774 | |||||||||
| Total redeemable convertible preferred stock | 136,856 | 137,853 | |||||||||
| Stockholders' deficit | |||||||||||
| Common stock | — | — | |||||||||
| Treasury stock | (644) | (644) | |||||||||
| Additional paid-in capital | 21,732 | 25,235 | |||||||||
| Accumulated deficit | (71,384) | (57,986) | |||||||||
| Total stockholders' deficit | (50,296) | (33,395) | |||||||||
| Total liabilities, redeemable convertible preferred stock, and stockholders' deficit | $ | 212,129 | $ | 237,808 | |||||||
| Q1 | 2021 Shareholder Letter | 15 | ||||||
CONSOLIDATED STATEMENTS OF OPERATIONS
(in thousands, except per share data)
| Three Months Ended March 31, | |||||||||||
| 2020 | 2021 | ||||||||||
| Revenue | $ | 113,292 | $ | 125,372 | |||||||
| Cost of revenue | 14,472 | 15,961 | |||||||||
| Gross profit | 98,820 | 109,411 | |||||||||
| Operating expenses: | |||||||||||
| Sales and marketing | 78,880 | 63,476 | |||||||||
| Research and development | 19,226 | 17,015 | |||||||||
| General and administrative | 11,488 | 12,454 | |||||||||
| Total operating expenses | 109,594 | 92,945 | |||||||||
| Income (loss) from operations | (10,774) | 16,466 | |||||||||
| Other income (expense) | |||||||||||
| Interest expense | (279) | (209) | |||||||||
| Sublease income | 282 | 292 | |||||||||
| Other income (expense), net | (144) | 94 | |||||||||
| Total other income (expense), net | (141) | 177 | |||||||||
| Income (loss) before income taxes | (10,915) | 16,643 | |||||||||
| Income tax expense | 167 | 3,245 | |||||||||
| Net income (loss) | (11,082) | 13,398 | |||||||||
| Less: Accretion of redeemable convertible preferred stock | (955) | (997) | |||||||||
| Less: Undistributed earnings allocated to participating securities | — | (2,913) | |||||||||
| Net income (loss) attributable to common stockholders | $ | (12,037) | $ | 9,488 | |||||||
| Net income (loss) per share: | |||||||||||
| Basic | $ | (0.15) | $ | 0.12 | |||||||
| Diluted | $ | (0.15) | $ | 0.10 | |||||||
| Weighted-average shares used in computing net income (loss) per share: | |||||||||||
| Basic | 79,423 | 78,834 | |||||||||
| Diluted | 79,423 | 98,435 | |||||||||
| Q1 | 2021 Shareholder Letter | 16 | ||||||
CONSOLIDATED STATEMENTS OF CASH FLOWS
(in thousands)
| Three Months Ended March 31, | |||||||||||
| 2020 | 2021 | ||||||||||
| Cash flows from operating activities | |||||||||||
| Net income (loss) | $ | (11,082) | $ | 13,398 | |||||||
| Adjustments to reconcile net income (loss) to net cash provided by (used in) operating activities: | |||||||||||
| Stock-based compensation expense | 1,958 | 1,226 | |||||||||
| Depreciation and amortization | 2,434 | 2,302 | |||||||||
| Provision for bad debts | 553 | 244 | |||||||||
| Deferred income taxes | — | 3,151 | |||||||||
| Noncash lease expense | 1,170 | 1,473 | |||||||||
| Loss on disposal of property and equipment | 328 | — | |||||||||
| Change in operating assets and liabilities: | |||||||||||
| Accounts receivable | (382) | (5,149) | |||||||||
| Prepaid expenses and other current assets | 453 | (1,087) | |||||||||
| Deferred commissions, net | (736) | 122 | |||||||||
| Other assets | (8) | 59 | |||||||||
| Accounts payable | 2,958 | (2,191) | |||||||||
| Accrued expenses and other liabilities | 1,065 | 5,078 | |||||||||
| Deferred revenue | (709) | 4,259 | |||||||||
| Operating lease liabilities | (2,185) | (731) | |||||||||
| Net cash provided by (used in) operating activities | (4,183) | 22,154 | |||||||||
| Cash flows from investing activities | |||||||||||
| Purchases of property and equipment | (230) | (1,131) | |||||||||
| Capitalized internal use software costs | (2,640) | (2,124) | |||||||||
| Net cash used in investing activities | (2,870) | (3,255) | |||||||||
| Cash flows from financing activities | |||||||||||
| Proceeds from term loan | 10,000 | — | |||||||||
| Proceeds from revolving line | 16,500 | — | |||||||||
| Repurchase of common stock | — | (450) | |||||||||
| Proceeds from exercise of stock options | 288 | 2,077 | |||||||||
| Net cash provided by (used in) financing activities | 26,788 | 1,627 | |||||||||
| Net increase (decrease) in cash | 19,735 | 20,526 | |||||||||
| Cash | |||||||||||
| Beginning of period | 35,529 | 114,539 | |||||||||
| End of period | $ | 55,264 | $ | 135,065 | |||||||
| Q1 | 2021 Shareholder Letter | 17 | ||||||
RECONCILIATION OF GAAP NET INCOME (LOSS) TO ADJUSTED EBITDA
(in thousands, except Adjusted EBITDA margin data)
| Three Months Ended March 31, | |||||||||||
| 2020 | 2021 | ||||||||||
| GAAP net income (loss) | (11,082) | 13,398 | |||||||||
| Stock-based compensation | 1,958 | 1,226 | |||||||||
| Depreciation and amortization | 2,434 | 2,302 | |||||||||
| Total other (income) expense, net | 141 | (177) | |||||||||
| Income tax expense | 167 | 3,245 | |||||||||
| Adjusted EBITDA | (6,382) | 19,994 | |||||||||
| Adjusted EBITDA margin | (6) | % | 16 | % | |||||||
| Q1 | 2021 Shareholder Letter | 18 | ||||||
Key Operating Metrics and Non-GAAP Financial Measures
This shareholder letter includes certain key operating metrics, including Quarterly Paid Employers and Revenue per Paid Employer, and non-GAAP financial measures, including Adjusted EBITDA and Adjusted EBITDA margin.
We define Paid Employers as any employer(s) (or entities acting on behalf of an employer) on a paying subscription plan or performance marketing campaign for at least one day. Paid Employer(s) excludes employers from our Job Distribution Partners or other indirect channels, employers who are not actively searching for candidates, but otherwise have access to previously posted jobs, and employers on free trial. Job Distribution Partners are defined as third-party sites who have a relationship with us and advertise jobs from our marketplace. Quarterly Paid Employers means, with respect to any fiscal quarter, the count of Paid Employers during such fiscal quarter. Revenue per Paid Employer is the total company revenue in a particular period divided by the count of Paid Employers in the same period.
We define Adjusted EBITDA as our net income (loss) before total other income (expense), net, income tax expense (benefit) and depreciation and amortization, adjusted to eliminate stock-based compensation expense. Adjusted EBITDA margin represents Adjusted EBITDA as a percentage of revenue for the same period.
Management and our board of directors use these key operating metrics and non-GAAP financial measures as supplemental measures of our performance because they assist us in comparing our operating performance on a consistent basis, as they remove the impact of some items not directly resulting from our core operations. We also use these key operating metrics and non-GAAP financial measures for planning purposes, including the preparation of our internal annual operating budget and financial projections, to evaluate the performance and effectiveness of our strategic initiatives and to evaluate our capacity for capital expenditures to expand our business.
Adjusted EBITDA and Adjusted EBITDA margin should not be considered in isolation, as an alternative to, or superior to net income (loss), revenue, cash flows or other measures derived in accordance with GAAP. These non-GAAP measures are frequently used by analysts, investors and other interested parties to evaluate companies in our industry. Management believes that the presentation of non-GAAP financial measures is an appropriate measure of operating performance because they eliminate the impact of some expenses that do not relate directly to the performance of our underlying business.
These non-GAAP financial measures should not be construed as an inference that our future results will be unaffected by unusual or other items. Additionally, Adjusted EBITDA and Adjusted EBITDA margin are not intended to be a measure of free cash flow for management’s discretionary use, as they do not reflect our tax payments and certain other cash costs that may recur in the future, including, among other things, cash requirements for costs to replace assets being depreciated and amortized. Management compensates for these limitations by relying on our GAAP results in addition to using Adjusted EBITDA and Adjusted EBITDA margin as supplemental measures of our performance. Our measures of Adjusted EBITDA and Adjusted EBITDA margin used herein are not necessarily comparable to similarly titled captions of other companies due to different methods of calculation.
We are not able to provide a reconciliation of Adjusted EBITDA and Adjusted EBITDA Margin for Q2 or the full fiscal year 2021 to net income and net income margin, the comparable GAAP measures, respectively, because certain items that are excluded from non-GAAP financial measures cannot be reasonably predicted or are not in our control. In particular, we are unable to forecast the timing or magnitude of stock-based compensation or amortization of intangible assets, as applicable, without unreasonable efforts, and these items could significantly impact, either individually or in the aggregate, GAAP measures in the future.
| Q1 | 2021 Shareholder Letter | 19 | ||||||