Attached files
Exhibit 99.3
May 2021 Investor Presentation Seaport Global Acquisition Corp. © 2021 Redbox Automated Retail, LLC. Proprietary and Confidential
– 2 – Important Information About the Business Combination and Where to Find It In connection with the proposed business combination, Seaport Global Acquisition intends to file preliminary and definitive p rox y statements with the Securities and Exchange Commission (“SEC”). The preliminary and definitive proxy statements and other relevant documents will be sent or given to the stockholders of Seaport Global Acquisit ion as of the record date established for voting on the proposed business combination and will contain important information about the proposed business combination and related matters. Stockholders of Seaport Global Acquisition an d other interested persons are advised to read, when available, the preliminary proxy statement and any amendments thereto and, once available, the definitive proxy statement, in connection with Seaport Global Acquisition ’s solicitation of proxies for the meeting of stockholders to be held to approve, among other things, the proposed business combination because the proxy statement will contain important information about Seaport Global Acquisi tio n, Redbox and the proposed business combination. When available, the definitive proxy statement will be mailed to Seaport Global Acquisition’s stockholders as of a record date to be established for voting on the pr oposed business combination. Stockholders will also be able to obtain copies of the proxy statement, without charge, once available, at the SEC’s website at www.sec.gov/ or by directing a request to: Seaport Global Acquisition Co rp., 360 Madison Avenue, 20th Floor, New York, NY 10017, Attention: Secretary, telephone: (212) 616 - 7700. The information contained on, or that may be accessed through, the websites referenced in this communication is not in corporated by reference into, and is not a part of, this communication. Participants in the Solicitation Seaport Global Acquisition, Redbox and their respective directors and executive officers may be deemed participants in the so lic itation of proxies from Seaport Global Acquisition’s stockholders in connection with the business combination. Seaport Global Acquisition’s stockholders and other interested persons may obtain, without charge, more detailed in formation regarding the directors and officers of Seaport Global Acquisition in Seaport Global Acquisition’s final prospectus filed with the SEC on December 1, 2020 in connection with Seaport Global Acquisition’s initial pu blic offering. Information regarding the persons who may, under SEC rules, be deemed participants in the solicitation of proxies to Seaport Global Acquisition’s stockholders in connection with the proposed business combinat ion will be set forth in the proxy statement for the proposed business combination when available. Additional information regarding the interests of participants in the solicitation of proxies in connection with the proposed bu siness combination will be included in the proxy statement that Seaport Global Acquisition intends to file with the SEC. No Offer or Solicitation This communication shall neither constitute an offer to sell or the solicitation of an offer to buy any securities, nor shall th ere be any sale of securities in any jurisdiction in which the offer, solicitation or sale would be unlawful prior to the registration or qualification under the securities laws of any such jurisdiction. Forward - Looking Statements This communication includes certain statements that are not historical facts but are forward - looking statements for purposes of the safe harbor provisions under the United States Private Securities Litigation Reform Act of 1995. Forward - looking statements generally are accompanied by words such as “believe,” “may,” “will,” “estimate,” “continue,” “anticip ate,” “intend,” “expect,” “should,” “would,” “plan,” “predict,” “potential,” “seem,” “seek,” “future,” “outlook,” and similar expressions that predict or indicate future events or trends or that are not statements of h ist orical matters. All statements, other than statements of present or historical fact included in this communication, regarding Seaport Global Acquisition’s proposed business combination with Redbox, Seaport Global Acquisition’s ab ility to consummate the transaction, the benefits of the transaction and the combined company’s future financial performance, as well as the combined company’s strategy, future operations, estimated financial po sit ion, estimated revenues and losses, projected costs, prospects, plans and objectives of management are forward - looking statements. These statements are based on various assumptions, whether or not identified in this communicati on, and on the current expectations of the respective management of Seaport Global Acquisition and Redbox and are not predictions of actual performance. These forward - looking statements are provided for illustrative purpose s only and are not intended to serve as, and must not be relied on as, a guarantee, an assurance, a prediction or a definitive statement of fact or probability. Actual events and circumstances are difficult or impossible to p red ict and will differ from assumptions. Many actual events and circumstances are beyond the control of Seaport Global Acquisition or Redbox. Potential risks and uncertainties that could cause the actual results to differ materia lly from those expressed or implied by forward - looking statements include, but are not limited to, changes in domestic and foreign business, market, financial, political and legal conditions; the inability of the parties to successf ull y or timely consummate the business combination, including the risk that any regulatory approvals are not obtained, are delayed or are subject to unanticipated conditions that could adversely affect the combined company or the expe cte d benefits of the business combination or that the approval of the stockholders of Seaport Global Acquisition or Redbox is not obtained; failure to realize the anticipated benefits of business combination; risk relating to the uncertainty of the projected financial information with respect to Redbox; the amount of redemption requests made by Seaport Global Acquisition’s stockholders; the overall level of consumer demand for Redbox’s products; gener al economic conditions and other factors affecting consumer confidence, preferences, and behavior; disruption and volatility in the global currency, capital, and credit markets; the financial strength of Redbox’s customers; Red box’s ability to implement its business and growth strategy; changes in governmental regulation, Redbox’s exposure to litigation claims and other loss contingencies; disruptions and other impacts to Redbox’s business, as a re sult of the COVID - 19 pandemic and government actions and restrictive measures implemented in response, and as a result of the proposed transaction; Redbox’s ability to retain and expand customer relationships; competit ive pressures from many sources, including those using other distribution channels, having more experience, larger or more appealing inventory, better financing, and better relationships with those in the physical and str eam ing movie and television industries; developments in the home video distribution market as newer technologies and distribution channels compete for market share, and Redbox experiences a secular decline in the physical ren tal market; the impact of decreased quantity and quality of movie content availability for physical and digital distribution due to changes in quantity of new releases by studios, movie content failing to appeal to consumers’ tas tes , increased focus on digital sales and rentals, and other general industry - related factors; the termination, non - renewal or renegotiation on materially adverse terms of Redbox’s contracts or relationships with one or more of its significant retailers or studios; Redbox’s inability to obtain licenses to digital movie or television content for home entertainment viewing; Redbox’s reliance upon a number of partners to make its digital service available on the ir devices; unforeseen costs and potential liability in connection with content Redbox acquires, produces, licenses and/or distributes through its service; the impact of the COVID - 19 pandemic on Redbox’s business, results of operations and financial condition, its suppliers and customers and on the global economy; the impact that global climate change trends may have on Redbox and its suppliers and customers; Redbox’s ability to protect pate nts , trademarks and other intellectual property rights; any breaches of, or interruptions in, Seaport Global Acquisition’s information systems; fluctuations in the price, availability and quality of electricity and other raw ma ter ials and contracted products as well as foreign currency fluctuations; changes in tax laws and liabilities, tariffs, legal, regulatory, political and economic risks. More information on potential factors that could affect Seaport Global Acquisition’s or Redbox’s financial results is include d f rom time to time in Seaport Global Acquisition’s public reports filed with the SEC, including its Annual Report on Form 10 - K, Quarterly Reports on Form 10 - Q, and Current Reports on Form 8 - K as well as the preliminary and the definiti ve proxy statements that Seaport Global Acquisition intends to file with the SEC in connection with Seaport Global Acquisition’s solicitation of proxies for the meeting of stockholders to be held to approve, among other thi ngs, the proposed business combination. If any of these risks materialize or Seaport Global Acquisition’s or Redbox’s assumptions prove incorrect, actual results could differ materially from the results implied by the se forward - looking statements. There may be additional risks that neither Seaport Global Acquisition nor Redbox presently know, or that Seaport Global Acquisition and Redbox currently believe are immaterial, that could also cause act ual results to differ from those contained in the forward - looking statements. In addition, forward - looking statements reflect Seaport Global Acquisition’s and Redbox’s expectations, plans or forecasts of future events and vi ews as of the date of this communication. Seaport Global Acquisition and Redbox anticipate that subsequent events and developments will cause their assessments to change. However, while Seaport Global Acquisition and Redb ox may elect to update these forward - looking statements at some point in the future, Seaport Global Acquisition and Redbox specifically disclaim any obligation to do so, except as required by law. These forward - looking st atements should not be relied upon as representing Seaport Global Acquisition’s or Redbox’s assessments as of any date subsequent to the date of this communication. Accordingly, undue reliance should not be placed upo n t he forward - looking statements.
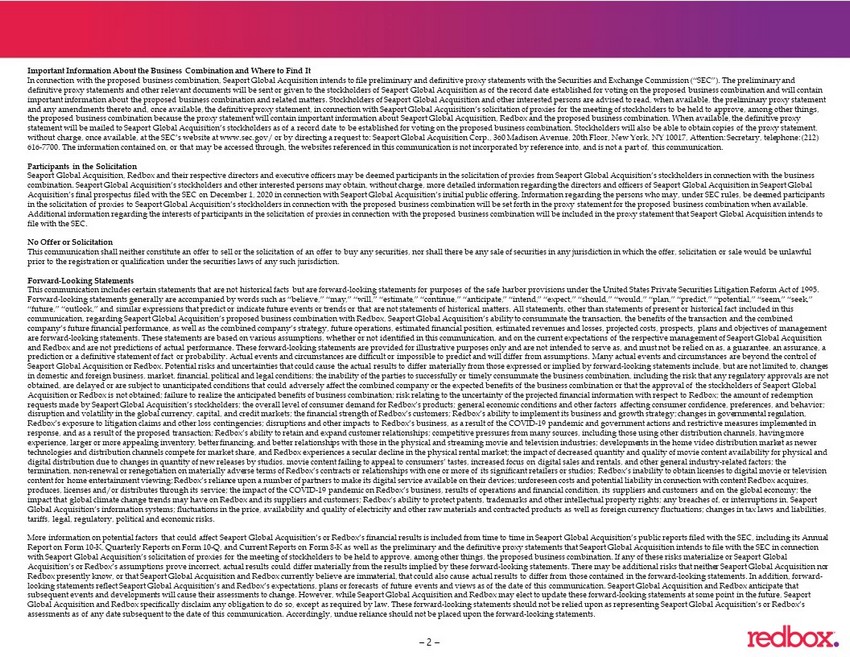
– 3 – Today’s Presenters Galen Smith Chief Executive Officer Jason Kwong Chief Strategy & Digital Officer Kavita Suthar Chief Financial Officer RedBox Stephen Smith Chairman Amroc Securities Libra Investments (acquired by U.S. Bancorp) Jay Burnham Director Cypress Management Rocker Management
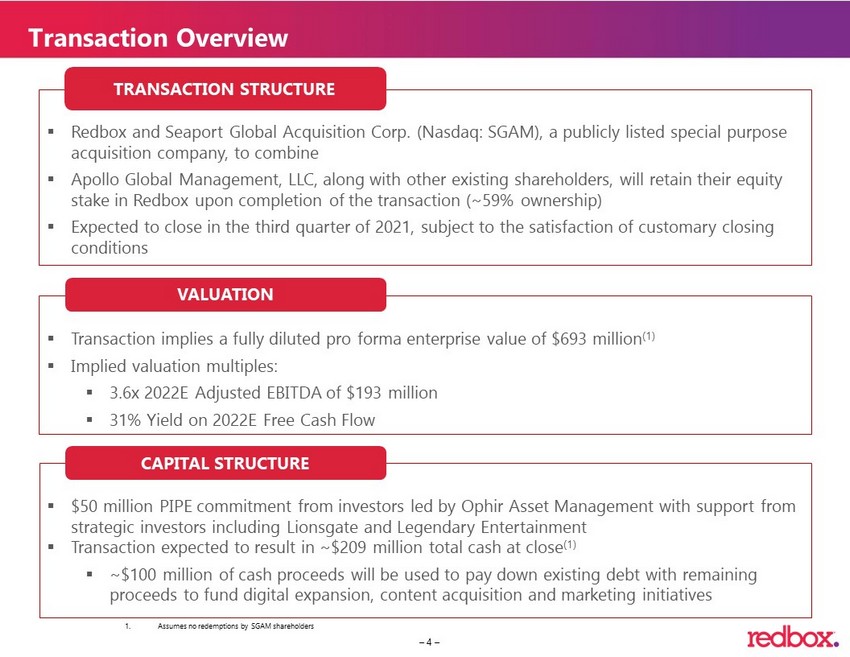
– 4 – Transaction Overview ▪ Transaction implies a fully diluted pro forma enterprise value of $693 million (1) ▪ Implied valuation multiples: ▪ 3.6x 2022E Adjusted EBITDA of $193 million ▪ 31% Yield on 2022E Free Cash Flow VALUATION ▪ Redbox and Seaport Global Acquisition Corp. (Nasdaq: SGAM ), a publicly listed special purpose acquisition company, to combine ▪ Apollo Global Management, LLC, along with other existing shareholders, will retain their equity stake in Redbox upon completion of the transaction (~59% ownership) ▪ Expected to close in the third quarter of 2021, subject to the satisfaction of customary closing conditions TRANSACTION STRUCTURE ▪ $50 million PIPE commitment from investors led by Ophir Asset Management with support from strategic investors including Lionsgate and Legendary Entertainment ▪ Transaction expected to result in ~$209 million total cash at close (1) ▪ ~$100 million of cash proceeds will be used to pay down existing debt with remaining proceeds to fund digital expansion, content acquisition and marketing initiatives CAPITAL STRUCTURE 1. Assumes no redemptions by SGAM shareholders
– 5 – Industry - Leading Reputation Resilient Business Proven and Diverse Management Team Unique Opportunity to Revolutionize Entertainment Attractive Financial Profile Favorable Industry Outlook Loyal Customer Base Redbox Benefits From
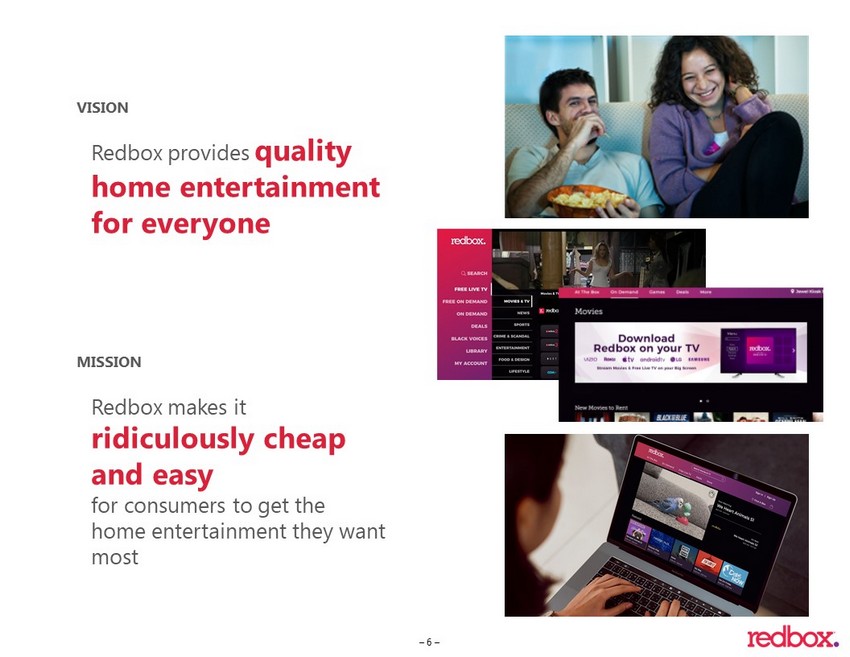
– 6 – VISION MISSION Redbox provides quality home entertainment for everyone Redbox makes it ridiculously cheap and easy for consumers to get the home entertainment they want most
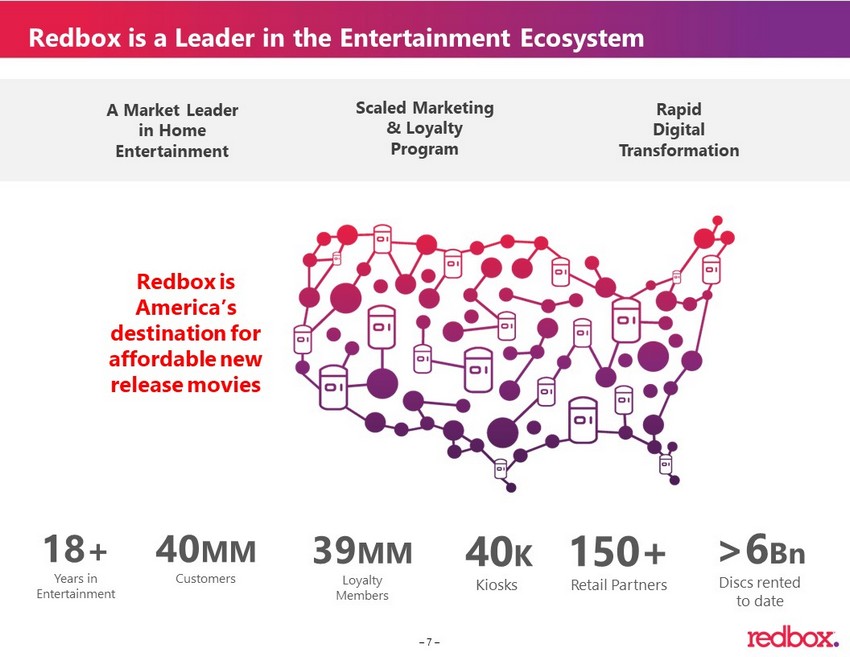
– 7 – Redbox is a Leader in the Entertainment Ecosystem A Market Leader in Home Entertainment Scaled Marketing & Loyalty Program Rapid Digital Transformation % Redbox is America’s destination for affordable new release movies 40 K Kiosks 18 + Years in Entertainment 150+ Retail Partners >6 Bn Discs rented to date 40 MM Customers 39 MM Loyalty Members
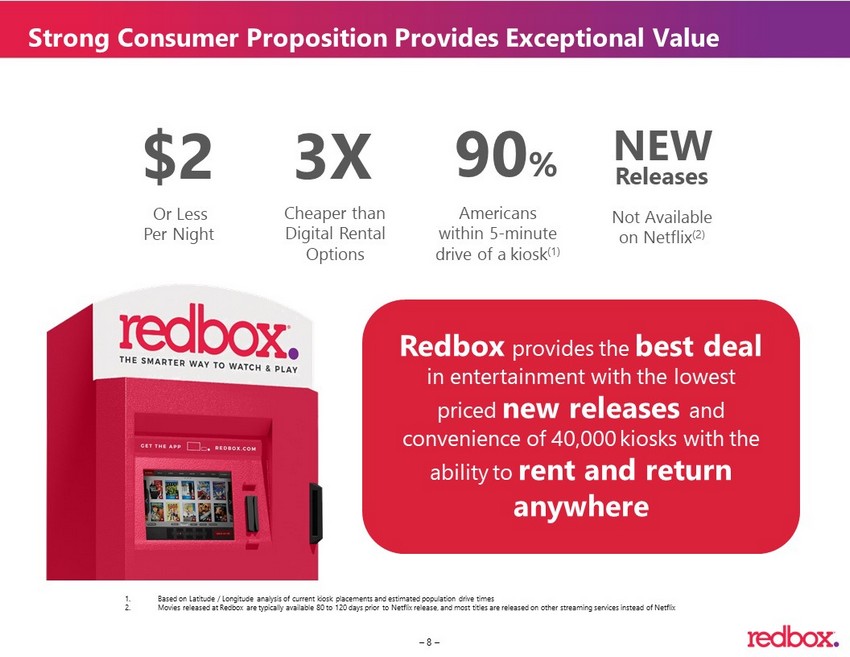
– 8 – $2 Or Less Per Night 3X Cheaper than Digital Rental Options 90 % Americans within 5 - minute drive of a kiosk (1) NEW Releases Not Available on Netflix (2) Redbox provides the best deal in entertainment with the lowest priced new releases and convenience of 40,000 kiosks with the ability to rent and return anywhere Strong Consumer Proposition Provides Exceptional Value 1. Based on Latitude / Longitude analysis of current kiosk placements and estimated population drive times 2. Movies released at Redbox are typically available 80 to 120 days prior to Netflix release, and most titles are released on ot her streaming services instead of Netflix
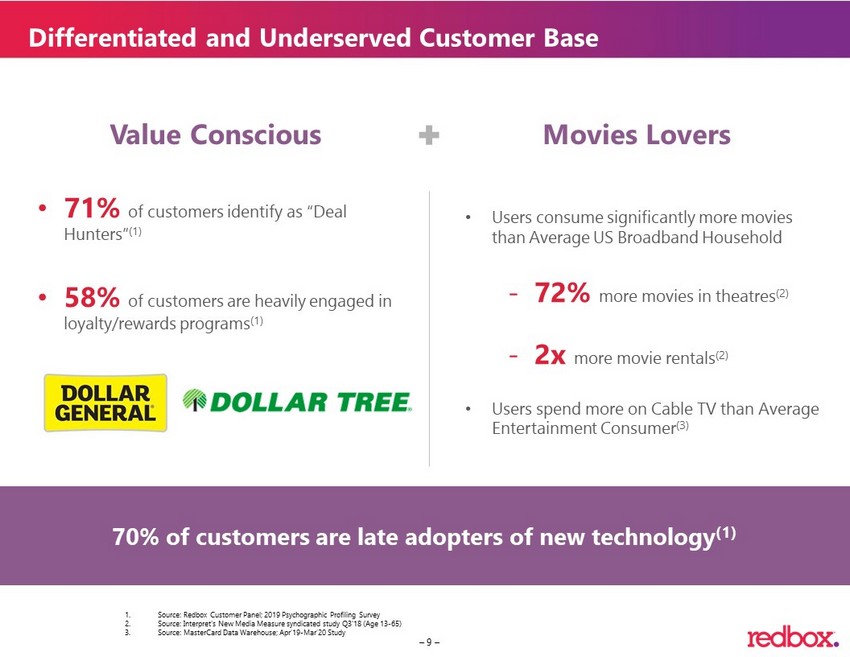
– 9 – Value Conscious • 71% of customers identify as “Deal Hunters” (1) • 58% of customers are heavily engaged in loyalty/rewards programs (1) • Users consume significantly more movies than Average US Broadband Household - 72% more movies in theatres (2) - 2x more movie rentals (2) • Users spend more on Cable TV than Average Entertainment Consumer (3) Movies Lovers 70% of customers are late adopters of new technology (1) Differentiated and Underserved Customer Base 1. Source: Redbox Customer Panel; 2019 Psychographic Profiling Survey 2. Source: Interpret's New Media Measure syndicated study Q3'18 (Age 13 - 65) 3. Source: MasterCard Data Warehouse; Apr’19 - Mar’20 Study
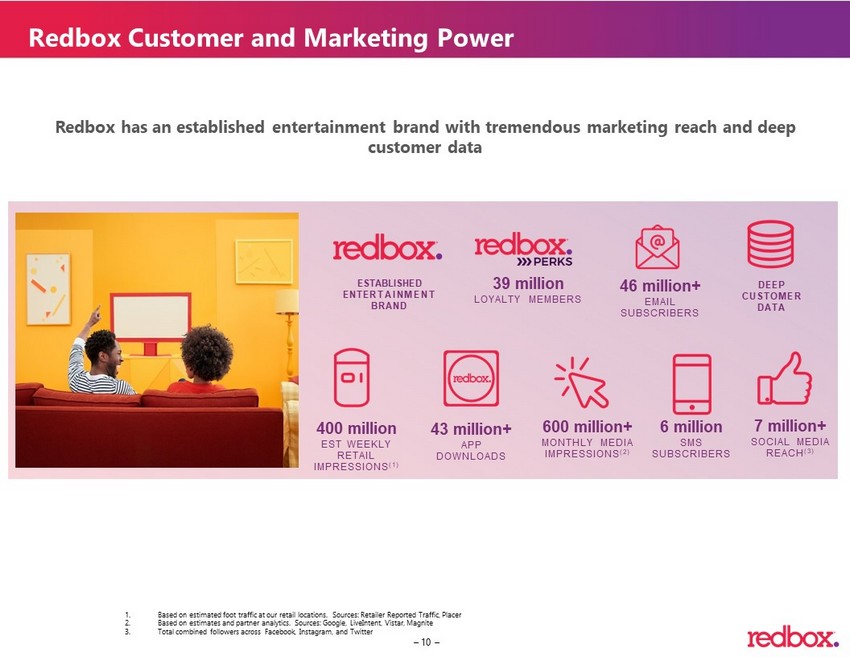
– 10 – 600 million+ MONTHLY MEDIA IMPRESSIONS (2) 46 million+ EMAIL SUBSCRIBERS 7 million+ SOCIAL MEDIA REACH (3) 39 million LOYALTY MEMBERS 6 million SMS SUBSCRIBERS ESTABLISHED ENTERTAINMENT BRAND 400 million EST WEEKLY RETAIL IMPRESSIONS (1) DEEP CUSTOMER DATA Redbox has an established entertainment brand with tremendous marketing reach and deep customer data 43 million+ APP DOWNLOADS Redbox Customer and Marketing Power 1. Based on estimated foot traffic at our retail locations. Sources: Retailer Reported Traffic, Placer 2. Based on estimates and partner analytics. Sources: Google, LiveIntent , Vistar , Magnite 3. Total combined followers across Facebook, Instagram, and Twitter
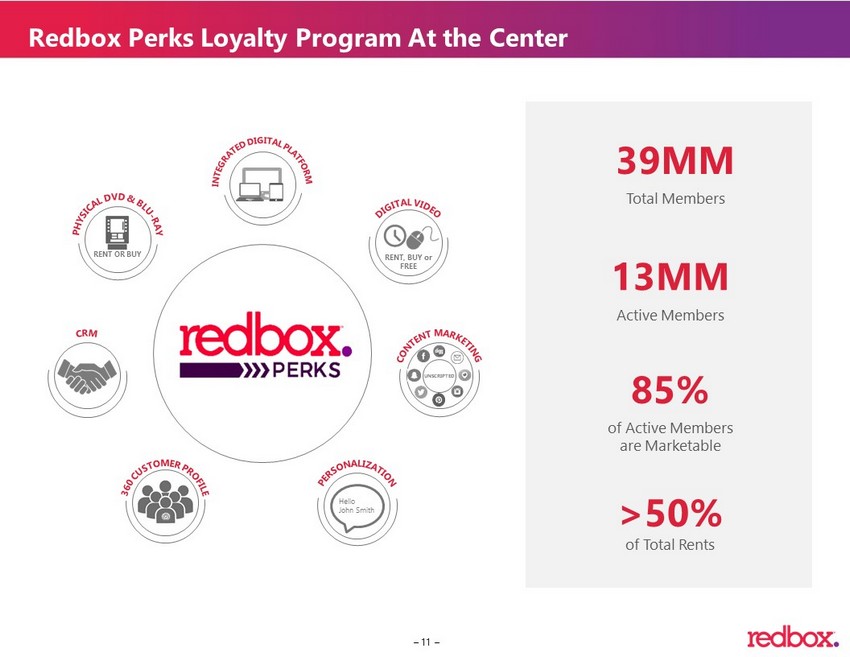
– 11 – RENT OR BUY UNSCRIPTED RENT, BUY or FREE Hello John Smith >50% of Total Rents 39MM Total Members 13MM Active Members 85 % of Active Members are Marketable Redbox Perks Loyalty Program At the Center
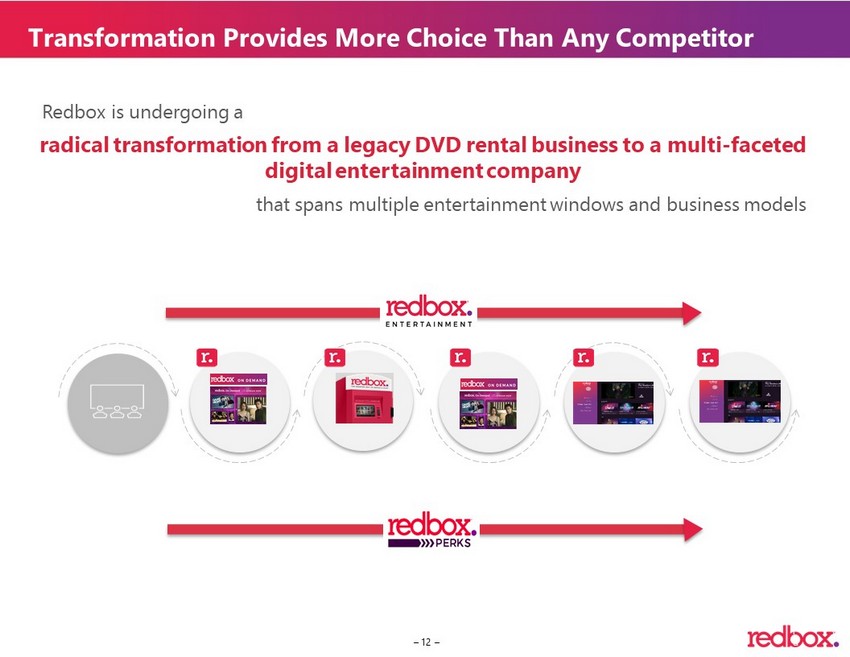
– 12 – P a g e Theatrical release PVOD / Electronic Sell Through (EST) Physical Disc Rental & Purchase Transactional Video On Demand SVOD / Premium Channels Ad - Supported radical transformation from a legacy DVD rental business to a multi - faceted digital entertainment company Redbox is undergoing a that spans multiple entertainment windows and business models Transformation Provides More Choice Than Any Competitor
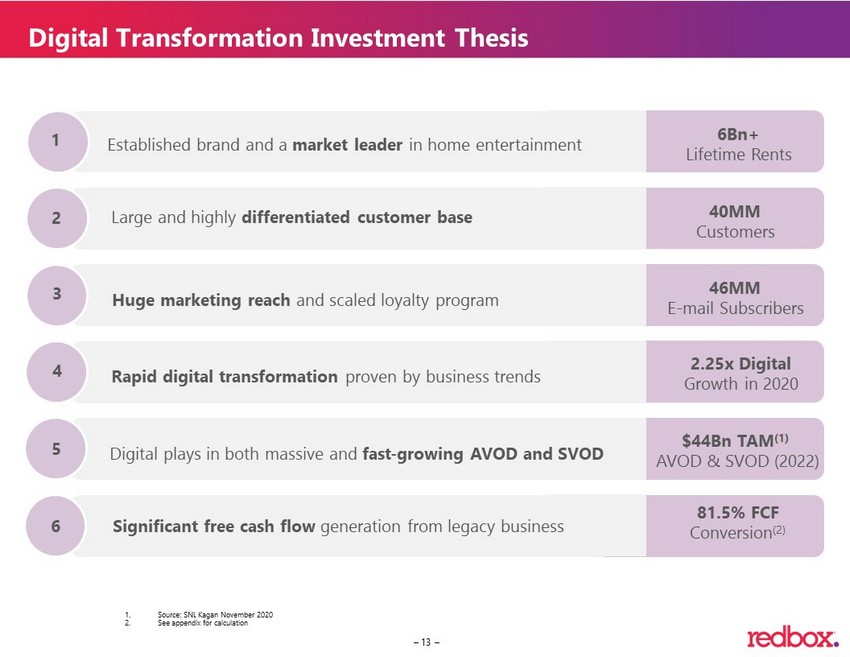
– 13 – Digital Transformation Investment Thesis 6Bn+ Lifetime Rents 40MM Customers 46MM E - mail Subscribers 2.25x Digital Growth in 2020 $44Bn TAM (1) AVOD & SVOD (2022) 81.5% FCF Conversion (2) Established brand and a market leader in home entertainment Large and highly differentiated customer base Huge marketing reach and scaled loyalty program Rapid digital transformation proven by business trends Digital plays in both massive and fast - growing AVOD and SVOD Significant free cash flow generation from legacy business 1 2 3 4 5 6 1. Source: SNL Kagan November 2020 2. See appendix for calculation
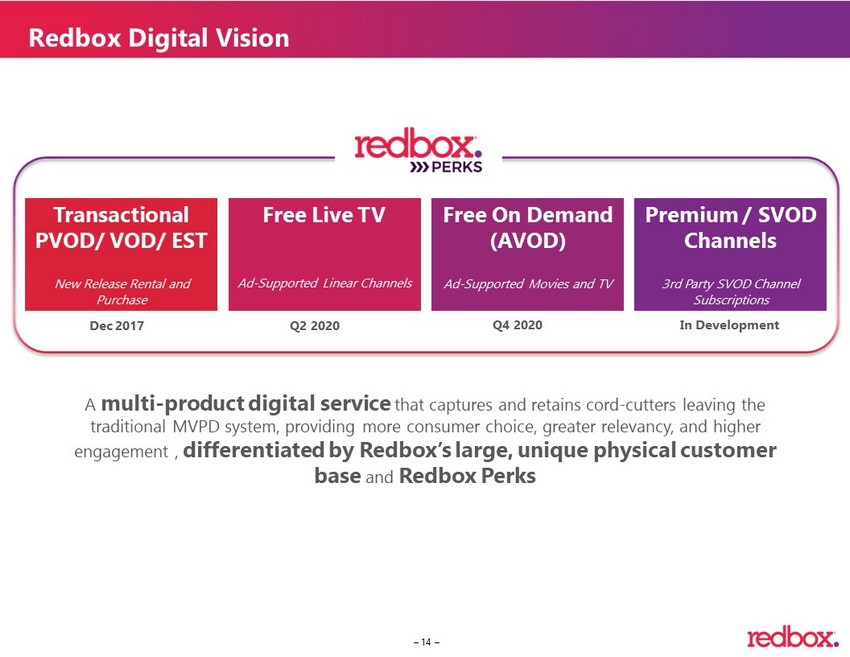
– 14 – Free Live TV Ad - Supported Linear Channels Transactional PVOD/ VOD/ EST New R elease Rental and Purchase Free On Demand (AVOD) Ad - Supported Movies and TV Premium / SVOD Channels 3rd Party SVOD Channel Subscriptions A multi - product digital service that captures and retains cord - cutters leaving the traditional MVPD system, providing more consumer choice, greater relevancy, and higher engagement , differentiated by Redbox’s large, unique physical customer base and Redbox Perks Redbox Digital Vision Dec 2017 Q2 2020 Q4 2020 In Development
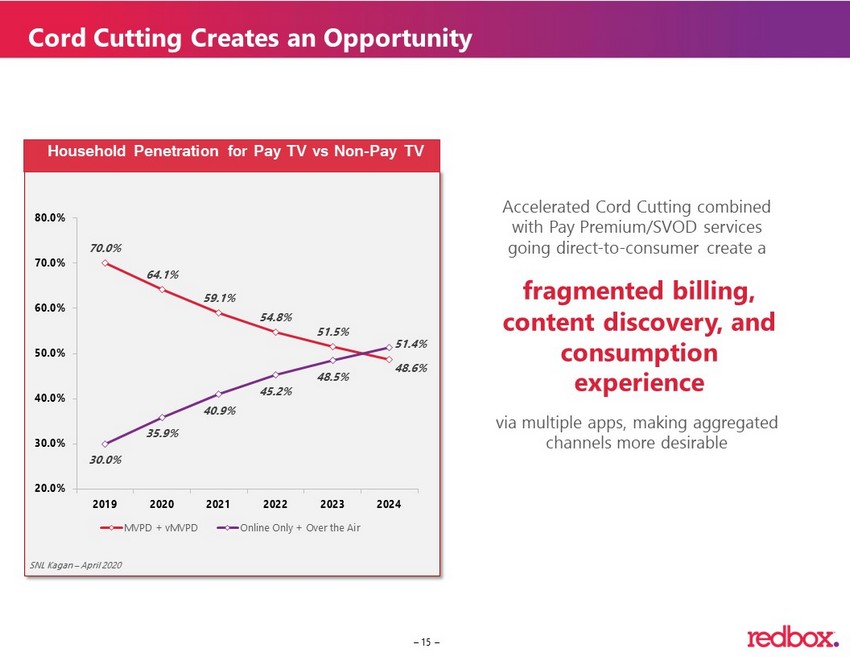
– 15 – 15 Accelerated Cord Cutting combined with Pay Premium/SVOD services going direct - to - consumer create a via multiple apps, making aggregated channels more desirable fragmented billing, content discovery, and consumption experience SNL Kagan – April 2020 Cord Cutting Creates an Opportunity 70.0% 64.1% 59.1% 54.8% 51.5% 48.6% 30.0% 35.9% 40.9% 45.2% 48.5% 51.4% 20.0% 30.0% 40.0% 50.0% 60.0% 70.0% 80.0% 2019 2020 2021 2022 2023 2024 MVPD + vMVPD Online Only + Over the Air Household Penetration for Pay TV vs Non - Pay TV
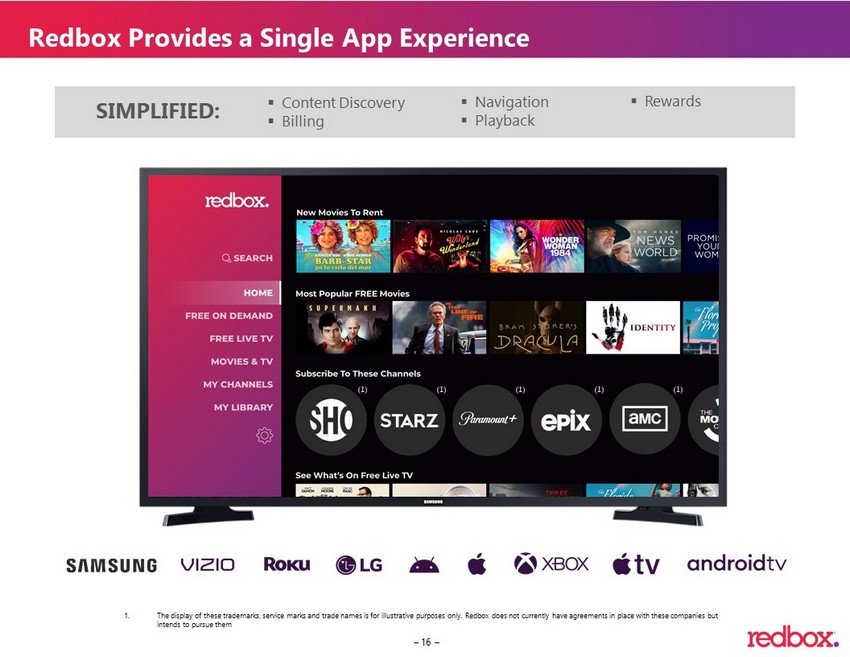
– 16 – ▪ Content Discovery ▪ Billing ▪ Navigation ▪ Playback ▪ Rewards SIMPLIFIED: Redbox Provides a Single App Experience 1. The display of these trademarks, service marks and trade names is for illustrative purposes only. Redbox does not currently h ave agreements in place with these companies but intends to pursue them (1) (1) (1) (1) (1)
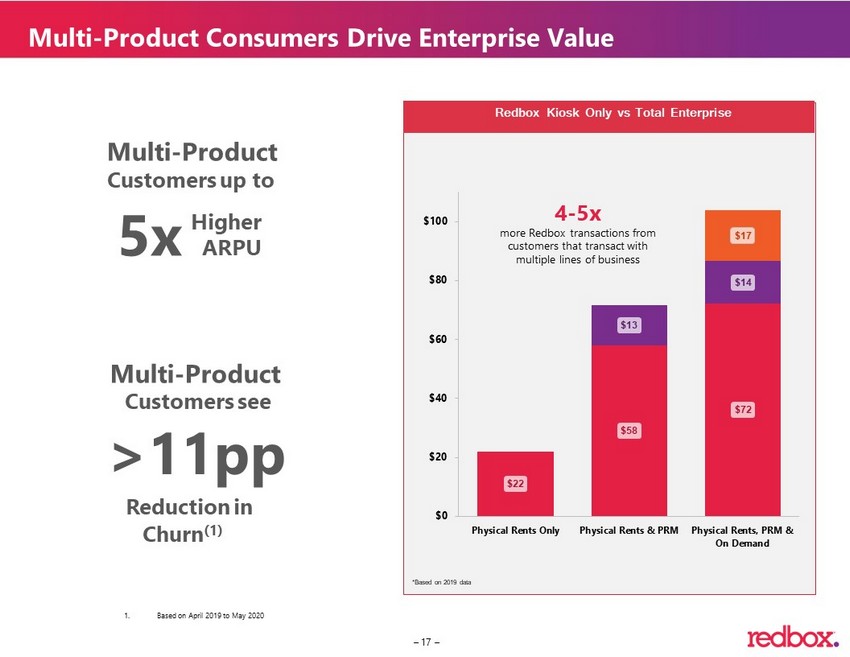
– 17 – $22 $58 $72 $13 $14 $17 $0 $20 $40 $60 $80 $100 Physical Rents Only Physical Rents & PRM Physical Rents, PRM & On Demand *Based on 2019 data Redbox Kiosk Only vs Total Enterprise 4 - 5x more Redbox transactions from customers that transact with multiple lines of business Multi - Product Customers up to Higher ARPU 5x Multi - Product Customers see Reduction in >11pp Churn (1) Multi - Product Consumers Drive Enterprise Value 1. Based on April 2019 to May 2020
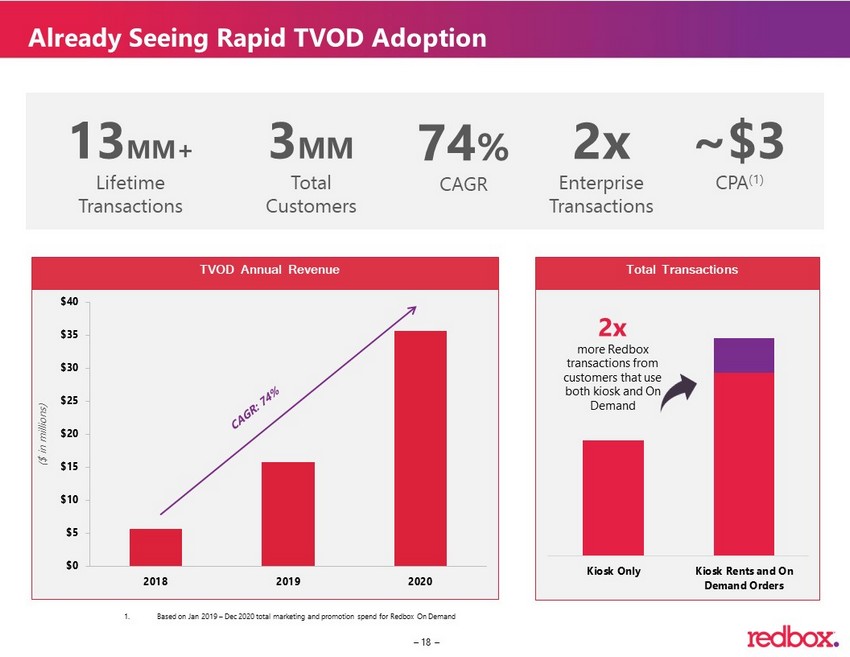
– 18 – Kiosk Only Kiosk Rents and On Demand Orders 2x more Redbox transactions from customers that use both kiosk and On Demand $0 $5 $10 $15 $20 $25 $30 $35 $40 2018 2019 2020 ($ in millions) 13 MM+ Lifetime Transactions 3 MM Total Customers 74 % CAGR ~$3 CPA (1) 2x Enterprise Transactions Already Seeing Rapid TVOD Adoption TVOD Annual Revenue Total Transactions 1. Based on Jan 2019 – Dec 2020 total marketing and promotion spend for Redbox On Demand
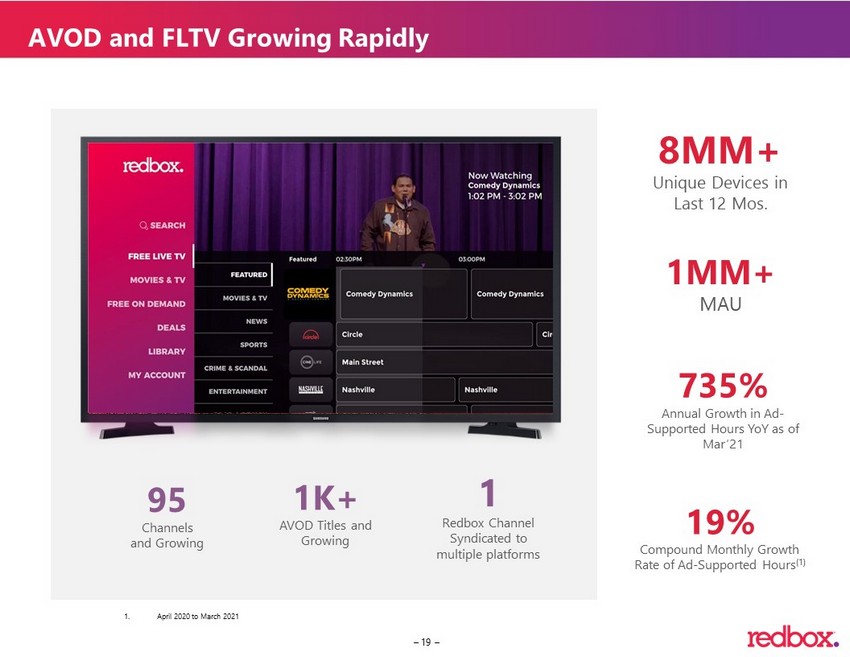
– 19 – 95 Channels and Growing 1K+ AVOD Titles and Growing 1 Redbox Channel Syndicated to multiple platforms 735% Annual Growth in Ad - Supported Hours YoY as of Mar’21 8MM+ Unique Devices in Last 12 Mos. 19% Compound Monthly Growth Rate of Ad - Supported Hours (1) 1MM+ MAU AVOD and FLTV Growing Rapidly 1. April 2020 to March 2021
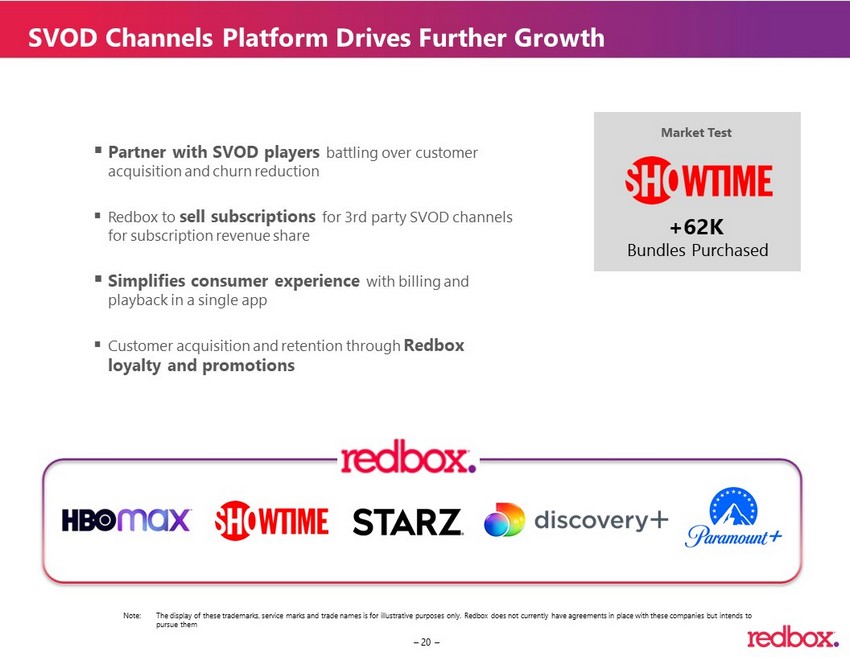
– 20 – ▪ Partner with SVOD players battling over customer acquisition and churn reduction ▪ Redbox to sell subscriptions for 3rd party SVOD channels for subscription revenue share ▪ Simplifies consumer experience with billing and playback in a single app ▪ Customer acquisition and retention through Redbox loyalty and promotions Market Test +62K Bundles Purchased SVOD Channels Platform Drives Further Growth Note: The display of these trademarks, service marks and trade names is for illustrative purposes only. Redbox does not currently h ave agreements in place with these companies but intends to pursue them
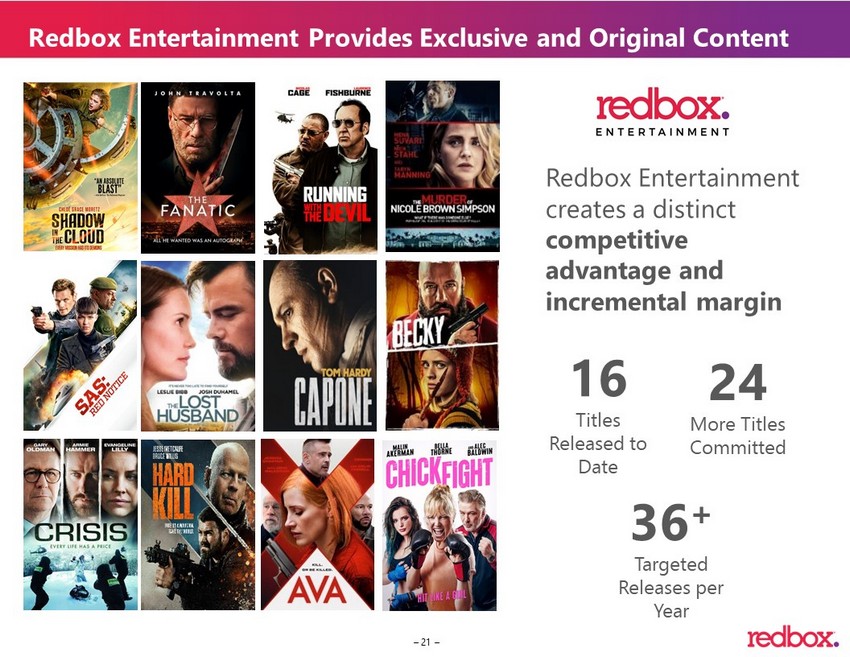
– 21 – Redbox Entertainment creates a distinct competitive advantage and incremental margin 16 Titles Released to Date 24 More Titles Committed 36 + Targeted Releases per Year Redbox Entertainment Provides Exclusive and Original Content
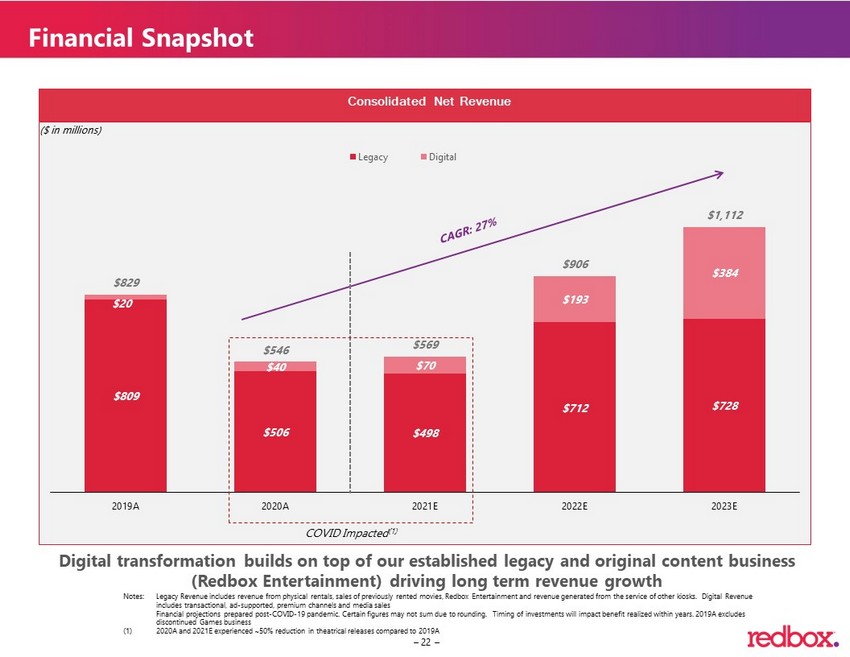
– 22 – $809 $506 $498 $712 $728 $20 $40 $70 $193 $384 $829 $546 $569 $906 $1,112 2019A 2020A 2021E 2022E 2023E Legacy Digital Financial Snapshot Digital transformation builds on top of our established legacy and original content business (Redbox Entertainment) driving long term revenue growth Notes: Legacy Revenue includes revenue from physical rentals, sales of previously rented movies, Redbox Entertainment an d r evenue generated from the service of other kiosks. Digital Revenue includes transactional, ad - supported, premium channels and media sales Financial projections prepared post - COVID - 19 pandemic. Certain figures may not sum due to rounding. Timing of investments will impact benefit realized within years. 2019A excludes discontinued Games business (1) 2020A and 2021E experienced ~50% reduction in theatrical releases compared to 2019A COVID Impacted (1) ($ in millions) Consolidated Net Revenue
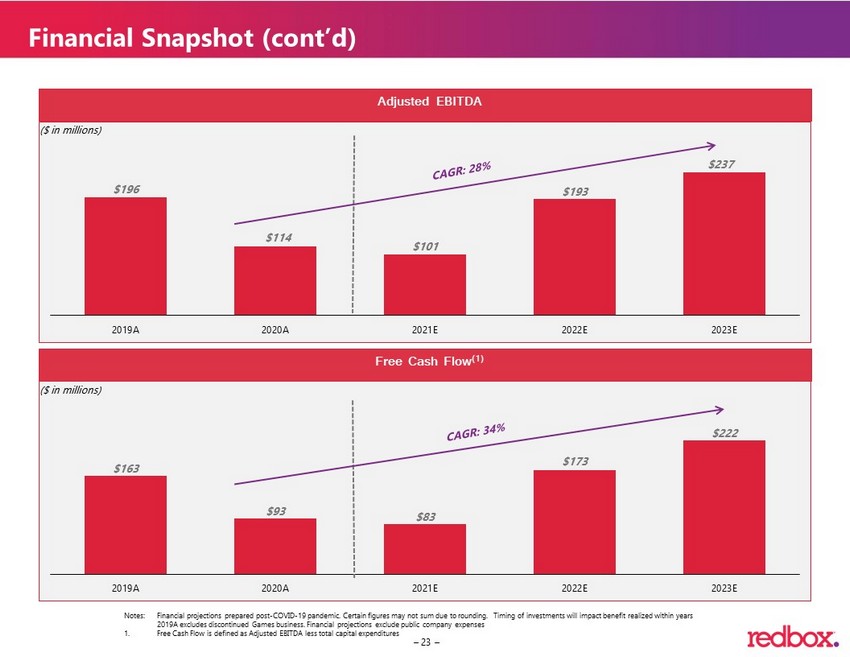
– 23 – $163 $93 $83 $173 $222 2019A 2020A 2021E 2022E 2023E $196 $114 $101 $193 $237 2019A 2020A 2021E 2022E 2023E Financial Snapshot (cont’d) ($ in millions) Notes: Financial projections prepared post - COVID - 19 pandemic. Certain figures may not sum due to rounding. Timing of investment s will impact benefit realized within years 2019A excludes discontinued Games business. Financial projections exclude public company expenses 1. Free Cash Flow is defined as Adjusted EBITDA less total capital expenditures ($ in millions) Adjusted EBITDA Free Cash Flow (1)
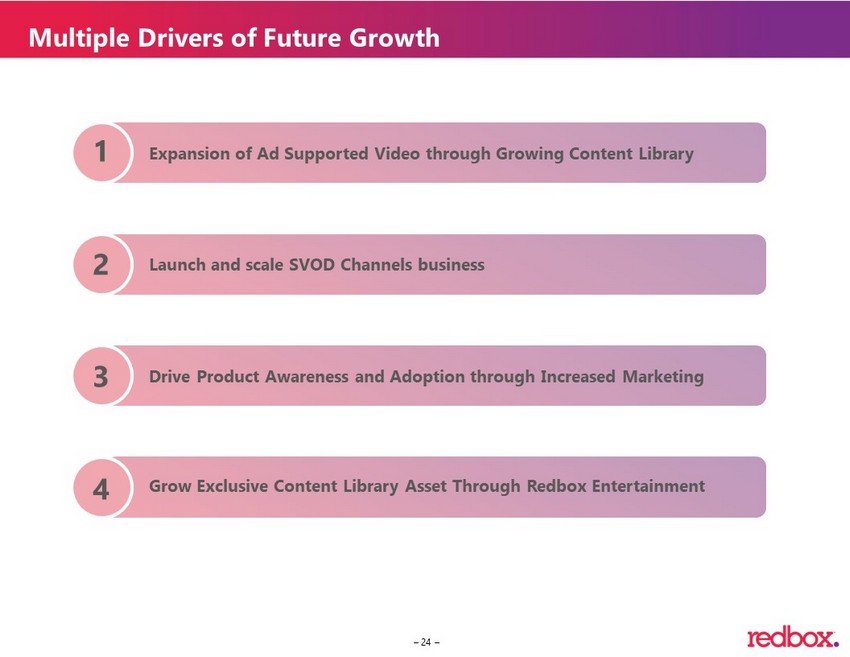
– 24 – Multiple Drivers of Future Growth Expansion of Ad Supported Video through Growing Content Library Launch and scale SVOD Channels business Drive Product Awareness and Adoption through Increased Marketing Grow Exclusive Content Library Asset Through Redbox Entertainment 1 2 3 4
A PPENDIX
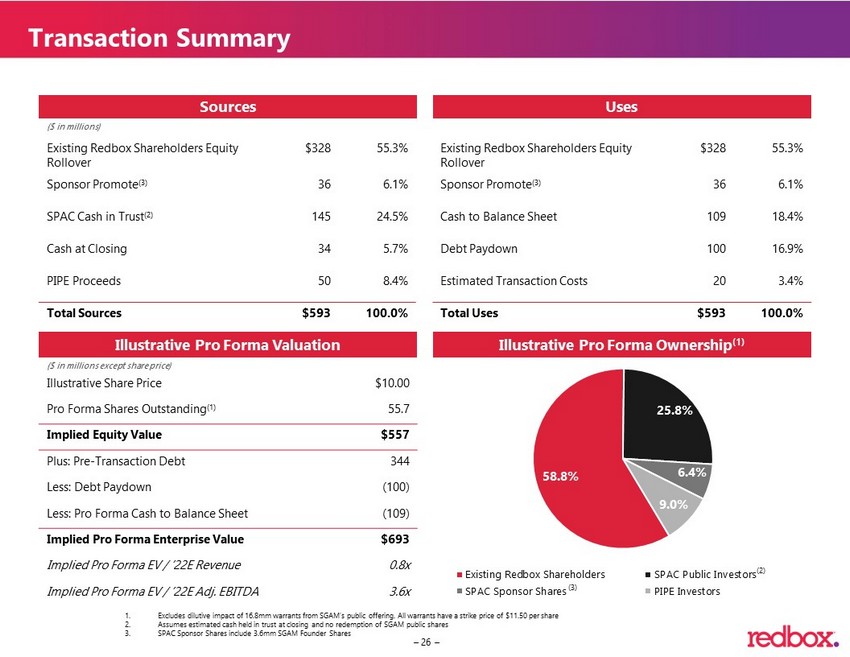
– 26 – Sources Uses Illustrative Pro Forma Valuation Illustrative Pro Forma Ownership (1) ($ in millions) 58.8% 25.8% 6.4% 9.0% Existing Redbox Shareholders SPAC Public Investors SPAC Sponsor Shares PIPE Investors (2) (3) Existing Redbox Shareholders Equity Rollover $328 55.3% Sponsor Promote (3) 36 6.1% SPAC Cash in Trust (2) 145 24.5% Cash at Closing 34 5.7% PIPE Proceeds 50 8.4% Total Sources $593 100.0% Existing Redbox Shareholders Equity Rollover $328 55.3% Sponsor Promote (3) 36 6.1% Cash to Balance Sheet 109 18.4% Debt Paydown 100 16.9% Estimated Transaction Costs 20 3.4% Total Uses $593 100.0% Illustrative Share Price $10.00 Pro Forma Shares Outstanding (1) 55.7 Implied Equity Value $557 Plus: Pre - Transaction Debt 344 Less: Debt Paydown (100) Less: Pro Forma Cash to Balance Sheet (109) Implied Pro Forma Enterprise Value $693 Implied Pro Forma EV / ’22E Revenue 0.8x Implied Pro Forma EV / ’22E Adj. EBITDA 3.6x Transaction Summary ($ in millions except share price) 1. Excludes dilutive impact of 16.8mm warrants from SGAM’s public offering. All warrants have a strike price of $11.50 per share 2. Assumes estimated cash held in trust at closing and no redemption of SGAM public shares 3. SPAC Sponsor Shares include 3.6mm SGAM Founder Shares
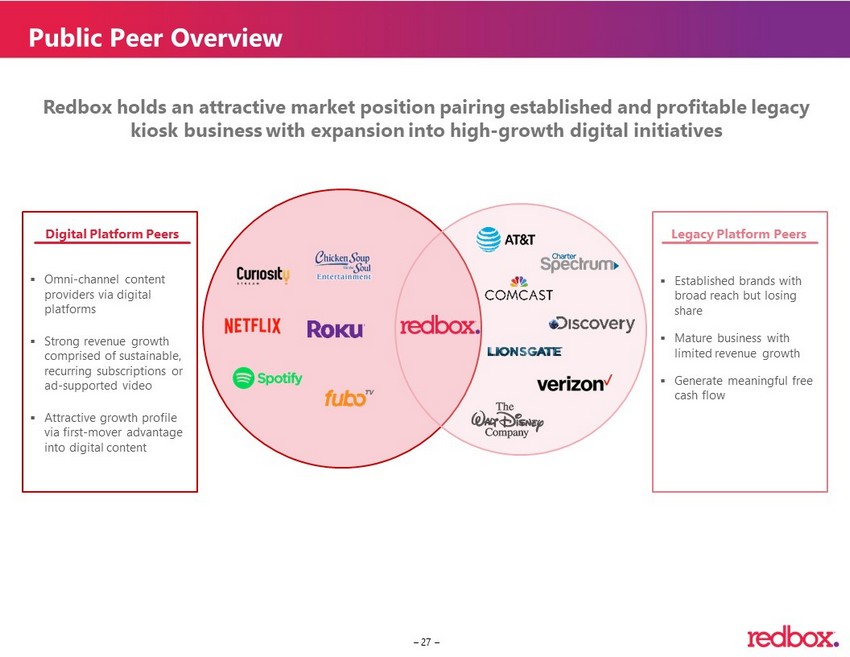
– 27 – Public Peer Overview Digital Platform Peers Legacy Platform Peers ▪ Omni - channel content providers via digital platforms ▪ Strong revenue growth comprised of s ustainable, recurring subscriptions or ad - supported video ▪ Attractive growth profile via first - mover advantage into digital content ▪ Established brands with broad reach but losing share ▪ Mature business with limited revenue growth ▪ Generate meaningful free cash flow Redbox holds an attractive market position pairing established and profitable legacy kiosk business with expansion into high - growth digital initiatives
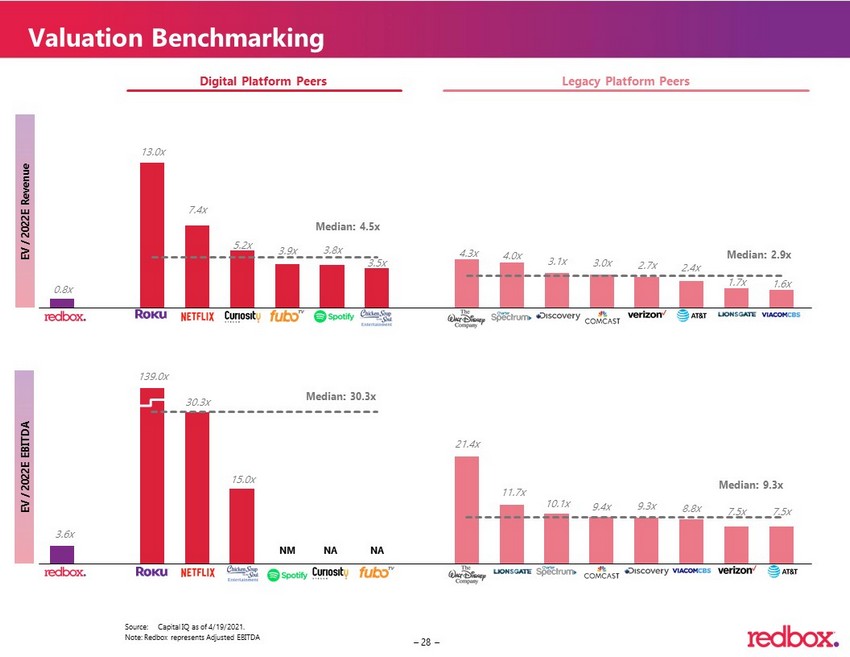
– 28 – 3.6x 30.3x 15.0x 21.4x 11.7x 10.1x 9.4x 9.3x 8.8x 7.5x 7.5x 0.8x 13.0x 7.4x 5.2x 3.9x 3.8x 3.5x 4.3x 4.0x 3.1x 3.0x 2.7x 2.4x 1.7x 1.6x EV / 2022E Revenue Source: Capital IQ as of 4/19/2021. Median: 2.9x Median: 9.3x Valuation Benchmarking Median: 4.5x Median: 30.3x NA NM NA 139.0x Digital Platform Peers Legacy Platform Peers EV / 2022E EBITDA Note: Redbox represents Adjusted EBITDA
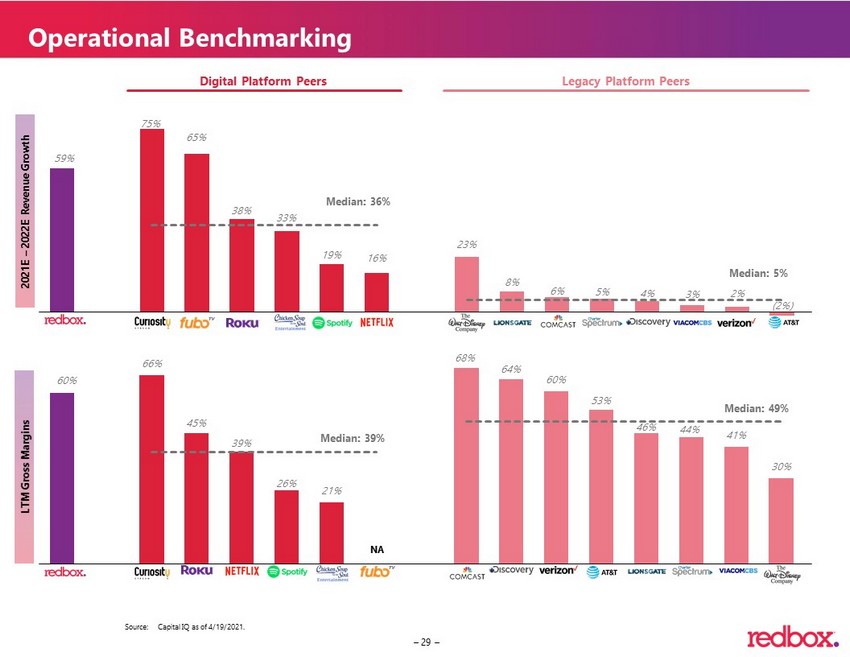
– 29 – 59% 75% 65% 38% 33% 19% 16% 23% 8% 6% 5% 4% 3% 2% (2%) 60% 66% 45% 39% 26% 21% 68% 64% 60% 53% 46% 44% 41% 30% Median: 5% Median: 49% Source: Capital IQ as of 4/19/2021. Operational Benchmarking Median: 36% Median: 39% NA Digital Platform Peers Legacy Platform Peers 2021E – 2022E Revenue Growth LTM Gross Margins
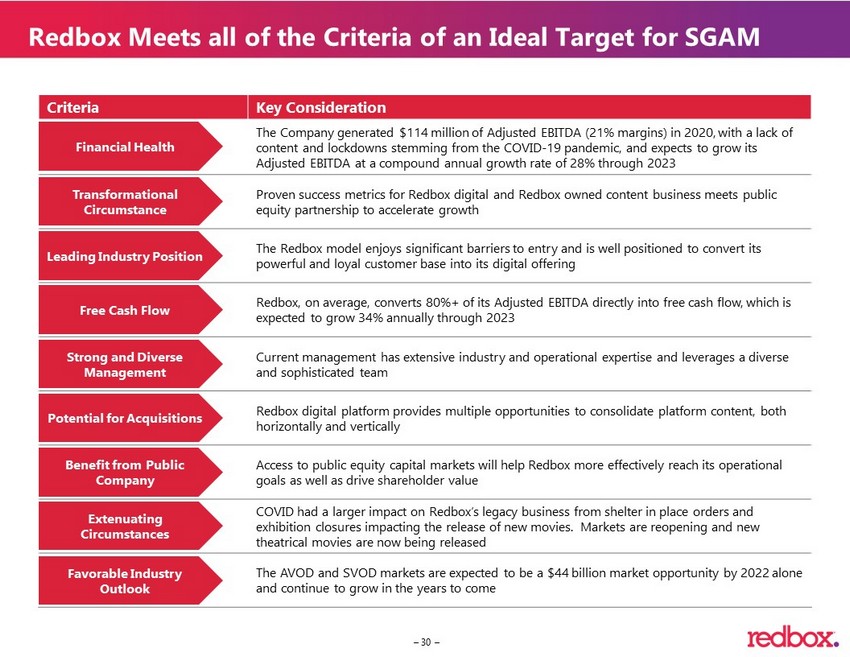
– 30 – Redbox Meets all of the Criteria of an Ideal Target for SGAM Criteria Key Consideration The Company generated $114 million of Adjusted EBITDA (21% margins) in 2020, with a lack of content and lockdowns stemming from the COVID - 19 pandemic, and expects to grow its Adjusted EBITDA at a compound annual growth rate of 28% through 2023 Proven success metrics for Redbox digital and Redbox owned content business meets public equity partnership to accelerate growth The Redbox model enjoys significant barriers to entry and is well positioned to convert its powerful and loyal customer base into its digital offering Redbox, on average, converts 80%+ of its Adjusted EBITDA directly into free cash flow, which is expected to grow 34% annually through 2023 Current management has extensive industry and operational expertise and leverages a diverse and sophisticated team Redbox digital platform provides multiple opportunities to consolidate platform content, both horizontally and vertically Access to public equity capital markets will help Redbox more effectively reach its operational goals as well as drive shareholder value COVID had a larger impact on Redbox’s legacy business from shelter in place orders and exhibition closures impacting the release of new movies. Markets are reopening and new theatrical movies are now being released The AVOD and SVOD markets are expected to be a $44 billion market opportunity by 2022 alone and continue to grow in the years to come Financia l Health Transformational Circumstance Leading Industry Position Free Cash Flow Strong and Diverse Management Potential for Acquisitions Benefit from Public Company Extenuating Circumstances Favorable Industry Outlook
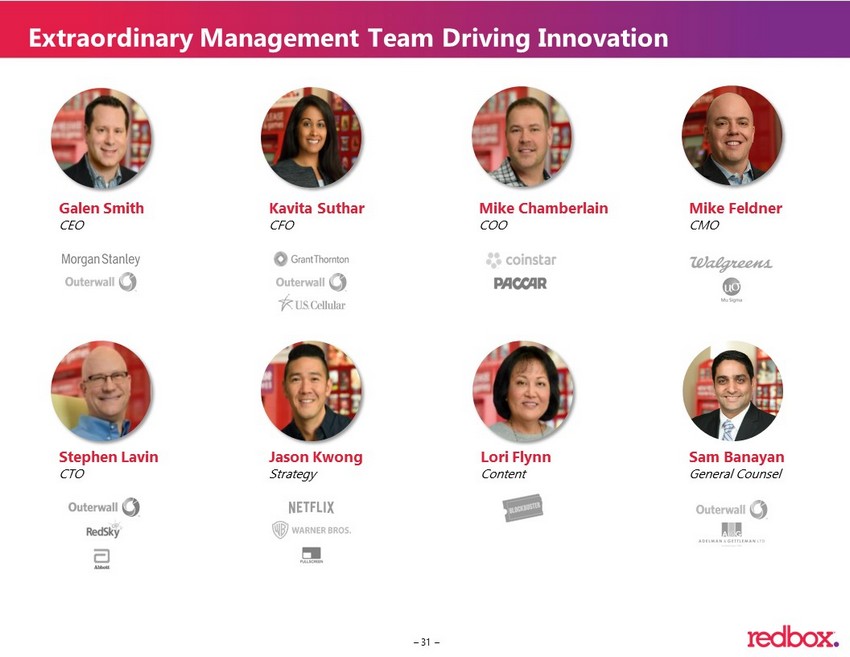
– 31 – Extraordinary Management Team Driving Innovation Jason Kwong Strategy Mike Feldner CMO Galen Smith CEO Stephen Lavin CTO Lori Flynn Content Mike Chamberlain COO Sam Banayan General Counsel Kavita Suthar CFO
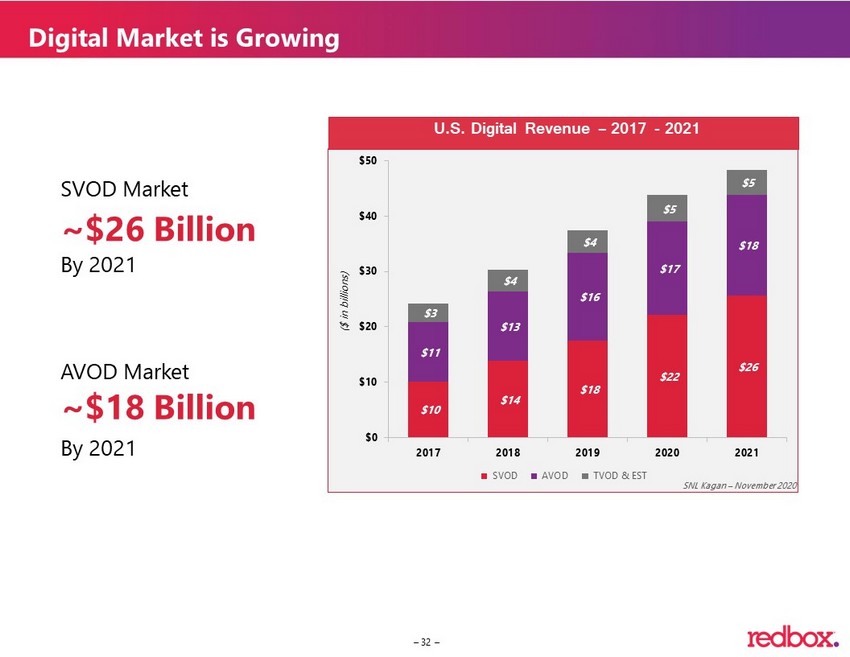
– 32 – $10 $14 $18 $22 $26 $11 $13 $16 $17 $18 $3 $4 $4 $5 $5 $0 $10 $20 $30 $40 $50 2017 2018 2019 2020 2021 ($ in billions) SVOD AVOD TVOD & EST 32 SNL Kagan – November 2020 SVOD Market ~$26 Billion By 2021 AVOD Market ~$18 Billion By 2021 Digital Market is Growing U.S. Digital Revenue – 2017 - 2021
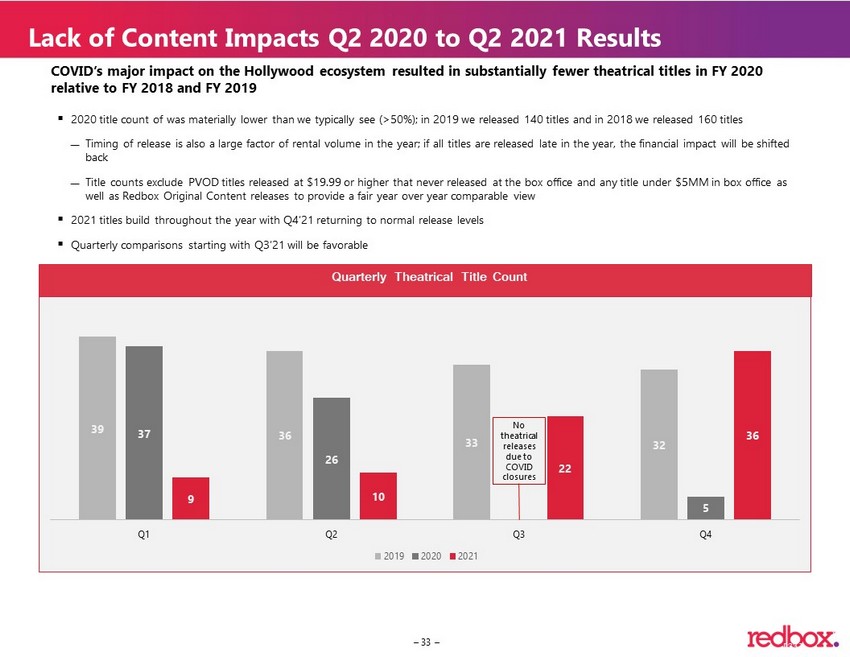
– 33 – 39 36 33 32 37 26 5 9 10 22 36 Q1 Q2 Q3 Q4 2019 2020 2021 COVID’s major impact on the Hollywood ecosystem resulted in substantially fewer theatrical titles in FY 2020 relative to FY 2018 and FY 2019 ▪ 2020 title count of was materially lower than we typically see (> 50 %); in 2019 we released 140 titles and in 2018 we released 160 titles Timing of release is also a large factor of rental volume in the year; if all titles are released late in the year, the finan cia l impact will be shifted back Title counts exclude PVOD titles released at $19.99 or higher that never released at the box office and any title under $5MM in box office as well as Redbox Original Content releases to provide a fair year over year comparable view ▪ 2021 titles build throughout the year with Q4’21 returning to normal release levels ▪ Quarterly comparisons starting with Q3’21 will be favorable No theatrical r eleases due to COVID closures [ 33 ] Lack of Content Impacts Q2 2020 to Q2 2021 Results Quarterly Theatrical Title Count
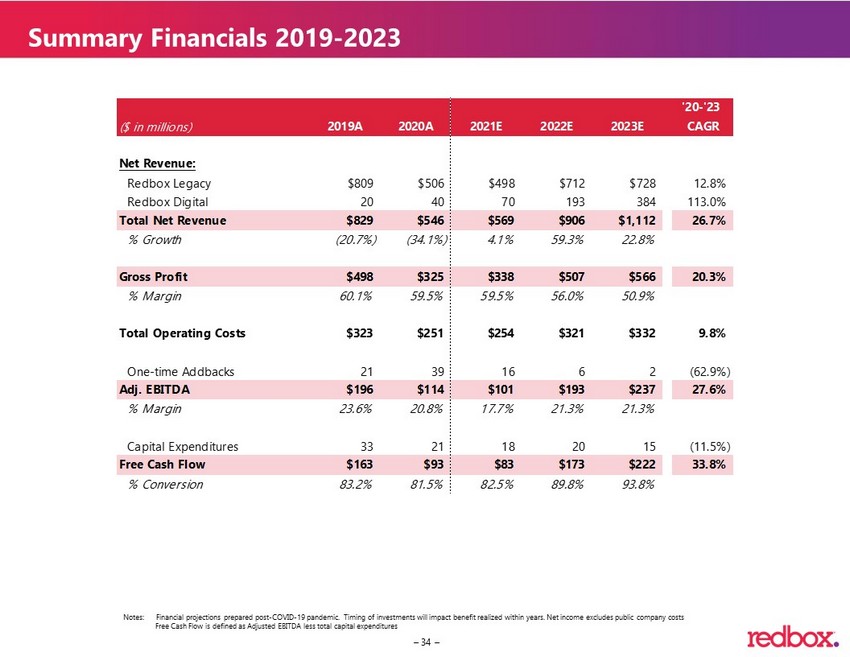
– 34 – Notes: Financial projections prepared post - COVID - 19 pandemic. Timing of investments will impact benefit realized within years. Net income excludes public company costs Free Cash Flow is defined as Adjusted EBITDA less total capital expenditures Summary Financials 2019 - 2023 '20-'23 ($ in millions) 2019A 2020A 2021E 2022E 2023E CAGR Net Revenue: Redbox Legacy $809 $506 $498 $712 $728 12.8% Redbox Digital 20 40 70 193 384 113.0% Total Net Revenue $829 $546 $569 $906 $1,112 26.7% % Growth (20.7%) (34.1%) 4.1% 59.3% 22.8% Gross Profit $498 $325 $338 $507 $566 20.3% % Margin 60.1% 59.5% 59.5% 56.0% 50.9% Total Operating Costs $323 $251 $254 $321 $332 9.8% One-time Addbacks 21 39 16 6 2 (62.9%) Adj. EBITDA $196 $114 $101 $193 $237 27.6% % Margin 23.6% 20.8% 17.7% 21.3% 21.3% Capital Expenditures 33 21 18 20 15 (11.5%) Free Cash Flow $163 $93 $83 $173 $222 33.8% % Conversion 83.2% 81.5% 82.5% 89.8% 93.8%
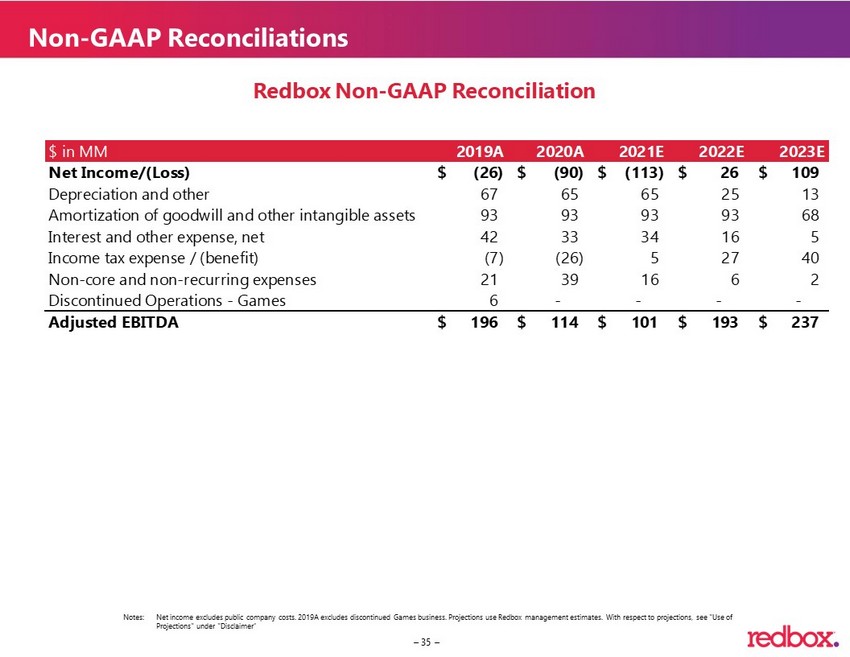
– 35 – Non - GAAP Reconciliations Notes: Net income excludes public company costs. 2019A excludes discontinued Games business. Projections use Redbox management estim ate s. With respect to projections, see "Use of Projections" under "Disclaimer“ Redbox Non - GAAP Reconciliation $ in MM 2019A 2020A 2021E 2022E 2023E Net Income/(Loss) (26)$ (90)$ (113)$ 26$ 109$ Depreciation and other 67 65 65 25 13 Amortization of goodwill and other intangible assets 93 93 93 93 68 Interest and other expense, net 42 33 34 16 5 Income tax expense / (benefit) (7) (26) 5 27 40 Non-core and non-recurring expenses 21 39 16 6 2 Discontinued Operations - Games 6 - - - - Adjusted EBITDA 196$ 114$ 101$ 193$ 237$
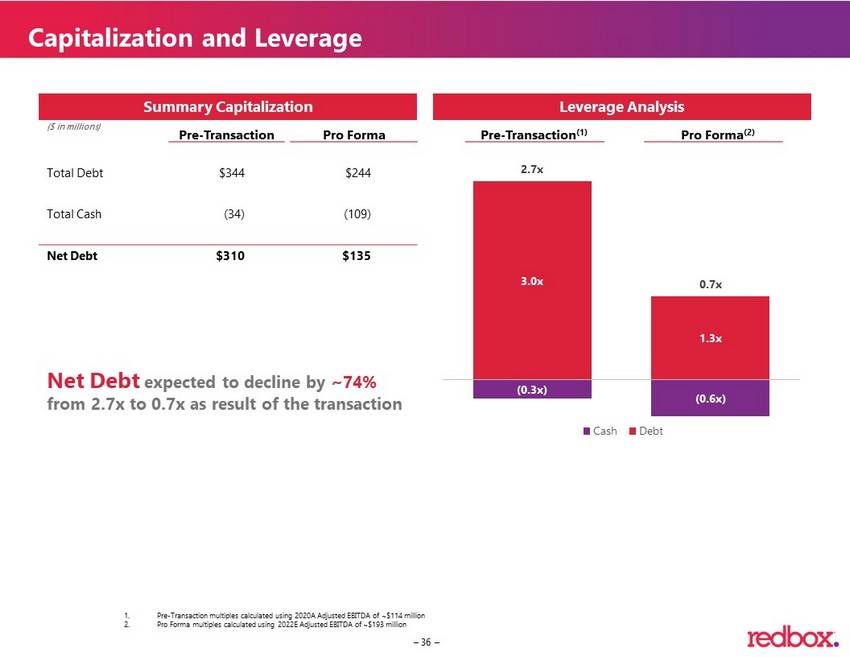
– 36 – Summary Capitalization Leverage Analysis Pre - Transaction (1) Pro Forma (2) ($ in millions) Total Debt $344 $244 Total Cash (34) (109) Net Debt $310 $135 Capitalization and Leverage Pre - Transaction Pro Forma Net Debt expected to decline by ~74% from 2.7x to 0.7x as result of the transaction 1. Pre - Transaction multiples calculated using 2020A Adjusted EBITDA of ~$114 million 2. Pro Forma multiples calculated using 2022E Adjusted EBITDA of ~$193 million 3.0x 1.3x (0.3x) (0.6x) 2.7x 0.7x Cash Debt
– 37 – Risk Factors • Redbox faces competitive pressures from many other sources, including those using other distribution channels, having more ex per ience, larger or more appealing inventory, better financing, and better relationships with those in the physical and streaming movie and telev isi on industries. • The home video distribution market is rapidly evolving as newer technologies and distribution channels compete for market sha re, and we have experienced a secular decline in the physical rental market. • Decreased quantity and quality of movie content availability for physical and digital distribution due to changes in quantity of new releases by studios, movie content failing to appeal to consumers’ tastes, increased focus on digital sales and rentals, and other genera l i ndustry - related factors, including financial disruptions, and labor conflicts may impact our revenue. • The termination, non - renewal or renegotiation on materially adverse terms of our contracts or relationships with one or more of our significant retailers or studios could seriously harm our business, financial condition and results of operations. • Our inability to obtain licenses to digital movie or television content for home entertainment viewing could adversely affect ou r business. • We rely upon a number of partners to make our digital service available on their devices. Their performance may, including a ny outages, could negatively impact our results. • We face risks, such as unforeseen costs and potential liability in connection with content we acquire, produce, license and/o r d istribute through our service. • If the technology we use in operating our business fails, is unavailable, or does not operate to expectations, our business a nd results of operation could be adversely impacted. • Demand for our products and services may be sensitive to pricing changes. • As our business expands to provide new products and services, and as we continue our efforts to enhance the Redbox customer e xpe rience, we are increasing the amount of consumer data that we collect, transfer, retain and use as part of our business. These activities ar e s ubject to laws and regulations, as well as industry standards, in the jurisdictions in which our products and services are or may be made availa ble . • Our future operating results will depend significantly on our ability to continue to drive new and repeat use of our Redbox k ios ks, continued development of digital offerings, our ability to develop and commercialize new products and services, such as third - party kiosk servicing line of business, and the costs incurred to do so. • Failure to adequately comply with privacy notices, information security policies, standards or legal requirements or to adequ ate ly safeguard against breaches of such policies, standards or requirements could adversely affect our operations and could damage our business, rep uta tion, financial position and results of operations. • Any significant disruption in or unauthorized access to our computer systems or those of third parties that we utilize in our op erations, including those relating to cybersecurity or arising from cyber - attacks, could result in a loss or degradation of service, unauthorized di sclosure of data, including member and corporate information, or theft of intellectual property, including digital content assets, which could adversely imp act our business. • The application of existing laws and regulations, changes in laws or enactment of new laws and regulations, that apply, or ma y i n the future apply, to our current or future products or services, changes in governmental authorities’ interpretation of the application of various go vernment regulations to our business, or the failure or inability to gain and retain required permits and approvals could materially and adversely af fec t our business. • Events outside of our control, including the economic environment, or business interruption created by natural disasters or g lob al pandemics, have negatively affected, and could continue to negatively affect, consumers’ use of our products and services. • The loss of key personnel or the inability of replacements to quickly and successfully perform in their new roles could adver sel y affect our business. • Our ability to obtain additional funding in the future, if and as needed, through equity issuances or loans, or otherwise mee t o ur current obligations to third parties, could be adversely affected if the economic environment continues to be difficult. • We have debt outstanding and may incur additional debt in the future, which may adversely affect our financial condition and fut ure financial results. • If we are unable to meet our debt obligations, we could be forced to restructure or refinance such obligations, seek addition al equity financing or sell assets, which we may not be able to do on satisfactory terms or at all.
– 38 – ▪ ARPU – Average Revenue per User ▪ AVOD – Advertising Video On Demand ▪ CPA – Cost Per Acquisition ▪ CRM – Customer Relationship Management ▪ EST – Electronic Sell Through ▪ FLTV – Free Live TV ▪ LOB – Line of Business ▪ LTD – Life - to - Date ▪ MAU – Monthly Active Users ▪ MVPD – Multichannel Video Programming Distributor ▪ vMVPD – Virtual Multichannel Video Programming Distributor ▪ PIPE – Private Investment in Public Equity ▪ PRM – Previously Rented Movie ▪ PVOD – Premium Video on Demand ▪ SVOD – Subscription Video on Demand ▪ TAM – Total Addressable Market ▪ TVOD – Transactional Video On Demand ▪ VOD – Video on Demand Acronym Definitions