Attached files
| file | filename |
|---|---|
| EX-99.1 - EXHIBIT 99.1 - Golden Nugget Online Gaming, Inc. | tm2116713d1_ex99-1.htm |
| 8-K - FORM 8-K - Golden Nugget Online Gaming, Inc. | tm2116713d1_8k.htm |
Exhibit 99.2

Q1 2021 Earnings Presentation May 17th, 2021
DISCLAIMER 2 Forward - Looking Statements This presentation contains forward - looking statements within the meaning of Section 27A of the Securities Act of 1933, as amende d, or the Securities Act, and Section 21E of the Securities Exchange Act of 1934, as amended, or the Exchange Act, about us and our industry that involve substantial risks and uncertainties. All statements other than statements of historical fact s c ontained in this presentation, including guidance, our expected results of operations or financial condition, business strate gy and plans, user growth and engagement, product initiatives, and objectives of management for future operations, and the impac t o f COVID - 19 on our business and the economy as a whole, are forward - looking statements. In some cases, you can identify forward - looking statements because they contain words such as "anticipate," "believe," "contemplate," "continue," "could," "es timate," "expect," "expectations," "forecast," "going to," "intend," "may," "plan," "potential," "predict," "project," "pro pos e," "should," "target," "will," or "would" or the negative of these words or other similar terms or expressions. We caution y ou that the foregoing may not include all of the forward - looking statements made in this presentation. The financial results included in this presentation are preliminary, estimated and unaudited. The preliminary financial resul ts included in this presentation reflect management’s estimates based solely upon information available to management as of the date of this presentation and are subject to change upon the completion of GNOG’s financial closing procedures, final adj ust ments and other developments, including audit and review by GNOG’s independent registered public accounting firm, that may arise between now and the time the financial results for the fourth quarter and year - end are finalized. During the course of that process, GNOG may identify items that would require it to make adjustments, which may be material, to the information in this presentation. As a result, the preliminary unaudited financial information included in this presentation is forward - looking information and is subject to risks and uncertainties, including possible material adjustments to the preliminary financial information and the other risks and uncertainties described below under “Forward - Looking Statements.” Acco rdingly, you should not place undue reliance on these estimates. The information presented herein should not be considered a substitute for the financial information to be filed with the SEC in GNOG’s Annual Report on Form 10 - K for the fisc al year ended December 31, 2020 once it becomes available. You should not rely on forward - looking statements as predictions of future events. We have based the forward - looking statements contained in this Presentation primarily on our current expectations and projections about future events and trends, including the ongoing COVID - 19 pandemic that we believe may affect our business, financial condition, results of operations, and prospects. These forward - looking statements are not guarantees of future performance, conditions or results, and involve a number of known and unknown risks, uncertainties, assumptions and other important factors, many of which are outside GNOG's co ntrol, that could cause actual results or outcomes to differ materially from those discussed in the forward - looking statements. Important factors, among others, that may affect actual results or outcomes include the inability to recognize the anticipated benefits of GNOG's acquisition transaction; costs related to the acquisition transaction; the inability to maintain the listing of GNOG's shares on Nasdaq; GNOG's ability to manage growth; GNOG's ability to execute its business plan a nd meet its projections; potential litigation involving GNOG; changes in applicable laws or regulations, particularly with respect to gaming; general economic and market conditions impacting demand for GNOG's products and services, and in particu lar economic and market conditions in the media / entertainment / gaming / software industry in the markets in which GNOG's operates; the potential adverse effects of the ongoing global coronavirus (COVID - 19) pandemic on capital markets, genera l economic conditions, unemployment and GNOG's liquidity, operations and personnel, as well as risks, uncertainties, and other factors described in the section entitled "Risk Factors" in GNOG's filings with the SEC, which are available on t he SEC's website at www.sec.gov. Additional information will be made available in other filings that we make from time to time with the SEC. In addition, any forward - looking statements contained in this presentation are based on assumptions that we believ e to be reasonable as of this date. We undertake no obligation to update any forward - looking statements to reflect events or circumstances after the date of this presentation or to reflect new information or the occurrence of unanticipated events, in cluding future developments related to the COVID - 19 pandemic, except as required by law. Non - GAAP Financial Measures EBITDA and adjusted EBITDA are supplemental non - GAAP financial measures that are used by management and external users of our fi nancial statements, such as industry analysts, investors, lenders and rating agencies. We define "EBITDA" as earnings (or loss) before interest, taxes, depreciation, and amortization, and we define "Adjusted EBITDA" as EBITDA before stock - based c ompensation, acquisition transaction related expenses, debt extinguishment expenses and other non - recurring items. Neither EBITDA nor Adjusted EBITDA is a measure of net income as determined by U.S. generally accepted accounting principles ("G AAP"). Management believes EBITDA and Adjusted EBITDA are useful because they allow management to more effectively evaluate our oper ati ng performance and compare the results of our operations from period to period and against our peers without regard to our financing methods or capital structure or non - recurring, non - cash transactions. We exclude the items listed above in calculating EBITDA and Adjusted EBITDA because these amounts can vary substantially from company to company depending upon capital structures and the method by which assets were acquired. None of EBITDA or Adjusted EBITDA should be c ons idered an alternative to, or more meaningful than, net income (loss), the most closely comparable financial measure calculated in accordance with GAAP. Certain items excluded from EBITDA and Adjusted EBITDA are significant components in unde rst anding and assessing a company's financial performance, such as a company's return on assets, cost of capital and tax structure. Our presentation EBITDA and Adjusted EBITDA should not be construed as an inference that our results will be unaff ect ed by unusual or non - recurring items. Our computations of EBITDA and Adjusted EBITDA may not be comparable to other similarly titled measures of other companies.
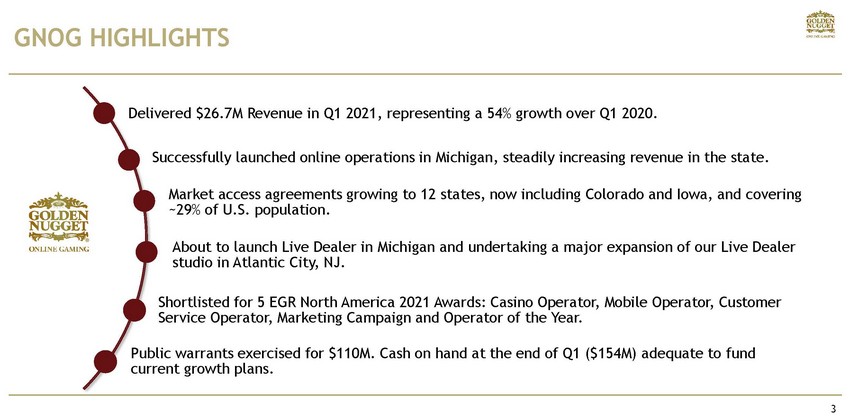
GNOG HIGHLIGHTS 3 Delivered $26.7M Revenue in Q1 2021, representing a 54% growth over Q1 2020. Successfully launched online operations in Michigan, steadily increasing revenue in the state. Market access agreements growing to 12 states, now including Colorado and Iowa, and covering ~29% of U.S. population. About to launch Live Dealer in Michigan and undertaking a major expansion of our Live Dealer studio in Atlantic City, NJ. Shortlisted for 5 EGR North America 2021 Awards: Casino Operator, Mobile Operator, Customer Service Operator, Marketing Campaign and Operator of the Year. Public warrants exercised for $110M. Cash on hand at the end of Q1 ($154M) adequate to fund current growth plans.
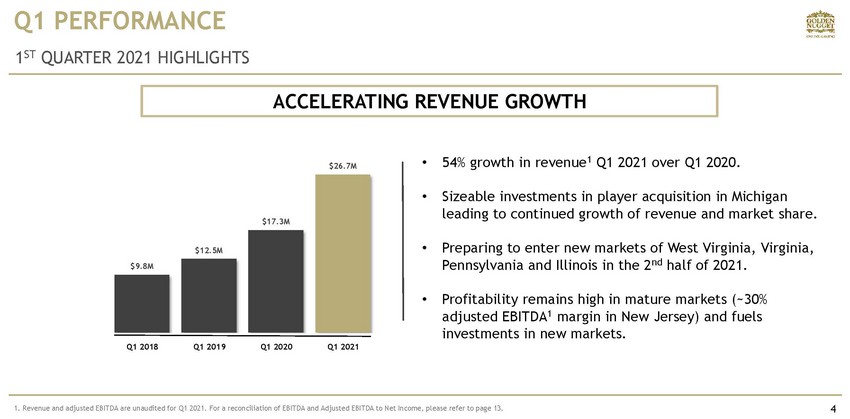
$9.8M $12.5M $17.3M $26.7M 4 Q1 PERFORMANCE 1 ST QUARTER 2021 HIGHLIGHTS ACCELERATING REVENUE GROWTH Q1 2020 Q1 2021 • 54% growth in revenue 1 Q1 2021 over Q1 2020. • Sizeable investments in player acquisition in Michigan leading to continued growth of revenue and market share. • Preparing to enter new markets of West Virginia, Virginia, Pennsylvania and Illinois in the 2 nd half of 2021. • Profitability remains high in mature markets (~30% adjusted EBITDA 1 margin in New Jersey) and fuels investments in new markets. Q1 2019 Q1 2018 1. Revenue and adjusted EBITDA are unaudited for Q1 2021. For a reconciliation of EBITDA and Adjusted EBITDA to Net Income, p lea se refer to page 13.
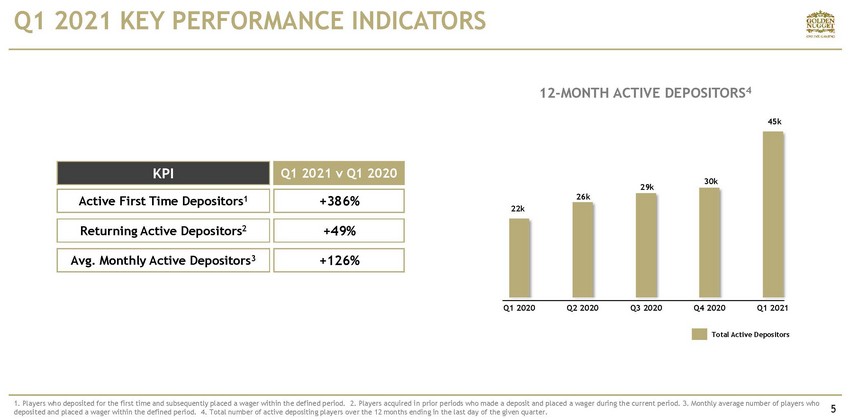
Q1 2020 Q2 2020 Q3 2020 Q4 2020 Q1 2021 1. Players who deposited for the first time and subsequently placed a wager within the defined period. 2. Players acquired i n p rior periods who made a deposit and placed a wager during the current period. 3. Monthly average number of players who deposited and placed a wager within the defined period. 4. Total number of active depositing players over the 12 months endi ng in the last day of the given quarter. Q1 2021 KEY PERFORMANCE INDICATORS 5 Active First Time Depositors 1 Returning Active Depositors 2 Avg. Monthly Active Depositors 3 KPI Q1 2021 v Q1 2020 +386% +49% +126% 12 - MONTH ACTIVE DEPOSITORS 4 Total Active Depositors 22k 26k 29k 30k 45k
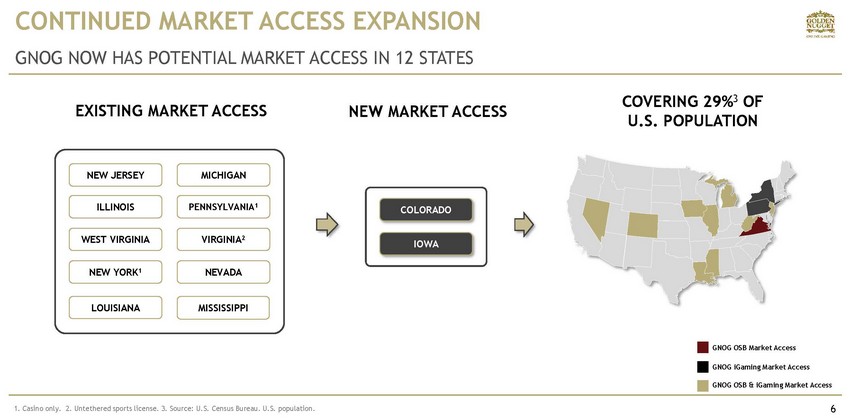
CONTINUED MARKET ACCESS EXPANSION 6 GNOG NOW HAS POTENTIAL MARKET ACCESS IN 12 STATES 1. Casino only. 2. Untethered sports license. 3. Source: U.S. Census Bureau. U.S. population. EXISTING MARKET ACCESS NEW MARKET ACCESS COVERING 29% 3 OF U.S. POPULATION IOWA COLORADO GNOG OSB & iGaming Market Access GNOG OSB Market Access GNOG iGaming Market Access NEW JERSEY MICHIGAN PENNSYLVANIA 1 WEST VIRGINIA VIRGINIA 2 NEW YORK 1 MISSISSIPPI ILLINOIS LOUISIANA NEVADA
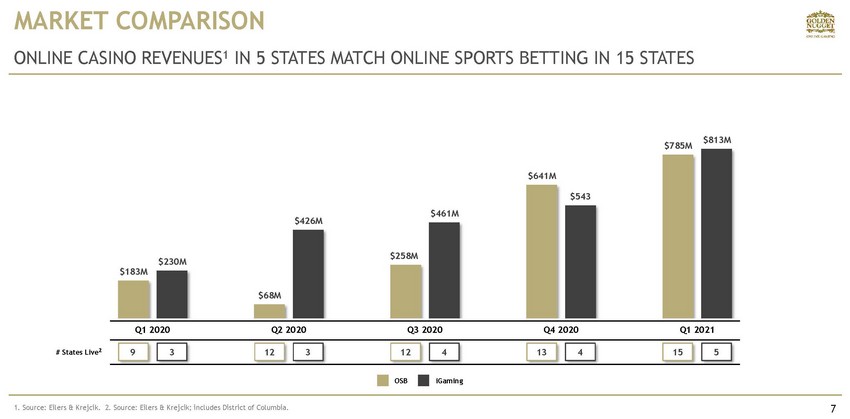
MARKET COMPARISON 7 ONLINE CASINO REVENUES 1 IN 5 STATES MATCH ONLINE SPORTS BETTING IN 15 STATES 1. Source: Eilers & Krejcik . 2. Source: Eilers & Krejcik ; includes District of Columbia. $183M $68M $258M $641M $785M $230M $426M $461M $543 $813M Q1 2020 Q2 2020 Q3 2020 Q4 2020 Q1 2021 # States Live 2 9 3 12 3 12 4 13 4 15 5 iGaming OSB
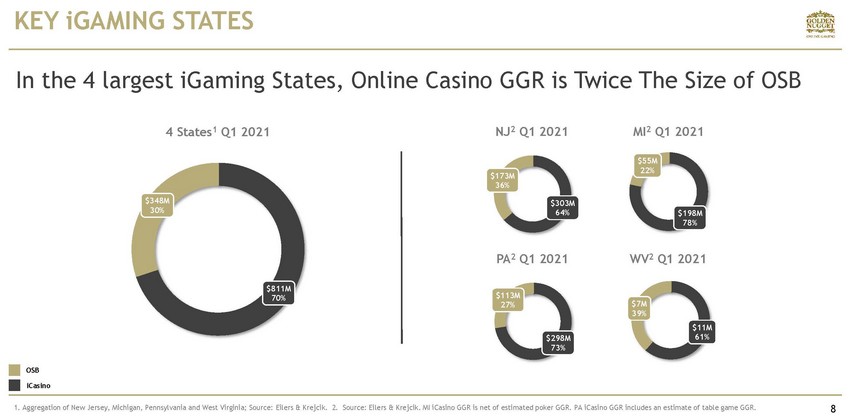
KEY iGAMING STATES 8 1. Aggregation of New Jersey, Michigan, Pennsylvania and West Virginia; Source: Eilers & Krejcik . 2. Source: Eilers & Krejcik . MI iCasino GGR is net of estimated poker GGR. PA iCasino GGR includes an estimate of table game GGR. $811M 70% $348M 30% 4 States 1 Q1 2021 iCasino OSB $198M 78% $55M 22% MI 2 Q1 2021 $303M 64% $173M 36% NJ 2 Q1 2021 $298M 73% $113M 27% PA 2 Q1 2021 $11M 61% $7M 39% WV 2 Q1 2021 In the 4 largest iGaming States, Online Casino GGR is Twice The Size of OSB
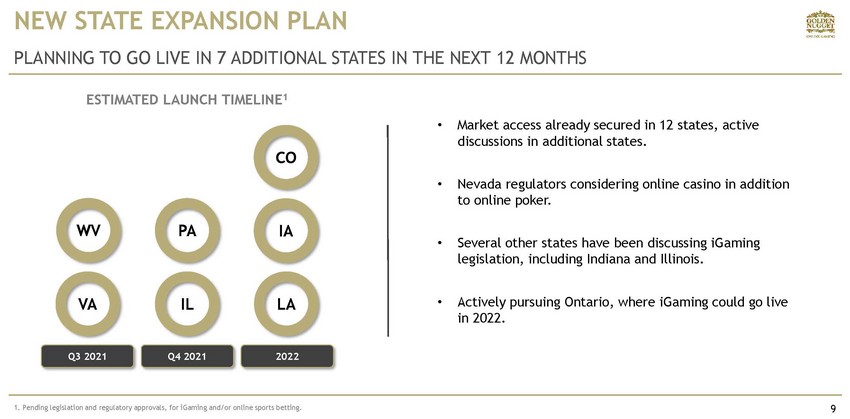
NEW STATE EXPANSION PLAN 9 PLANNING TO GO LIVE IN 7 ADDITIONAL STATES IN THE NEXT 12 MONTHS 1. Pending legislation and regulatory approvals, for iGaming and/or online sports betting. • Market access already secured in 12 states, active discussions in additional states. • Nevada regulators considering online casino in addition to online poker. • Several other states have been discussing iGaming legislation, including Indiana and Illinois. • Actively pursuing Ontario, where iGaming could go live in 2022. ESTIMATED LAUNCH TIMELINE 1 Q3 2021 Q4 2021 2022 CO WV VA PA IL IA LA
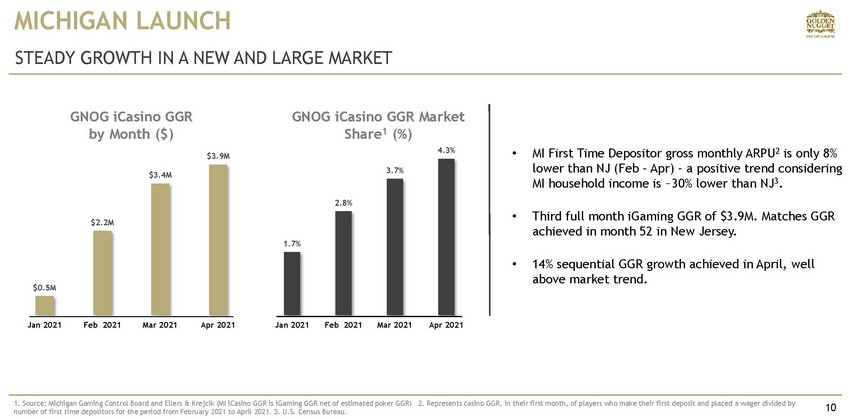
10 STEADY GROWTH IN A NEW AND LARGE MARKET MICHIGAN LAUNCH • MI First Time Depositor gross monthly ARPU 2 is only 8% lower than NJ (Feb – Apr) – a positive trend considering MI household income is ~30% lower than NJ 3 . • Third full month iGaming GGR of $3.9M. Matches GGR achieved in month 52 in New Jersey. • 14% sequential GGR growth achieved in April, well above market trend. 1. Source: Michigan Gaming Control Board and Eilers & Krejcik (MI iCasino GGR is iGaming GGR net of estimated poker GGR) 2. Represents casino GGR, in their first month, of players who make their fi rs t deposit and placed a wager divided by number of first time depositors for the period from February 2021 to April 2021. 3. U.S. Census Bureau. $0.5M $2.2M $3.4M $3.9M Jan 2021 Feb 2021 Mar 2021 Apr 2021 GNOG iCasino GGR by Month ($) GNOG iCasino GGR Market Share 1 (%) 1.7% 2.8% 3.7% 4.3% Jan 2021 Feb 2021 Mar 2021 Apr 2021

11 2021 PRODUCT ROADMAP • Michigan: Live Dealer launch with Evolution Gaming. (Q2) • Michigan: Launching 100+ new games from new content providers including Evolution Gaming, IGT, AGS, Inspired Gaming and Spin Games. (Q2) • New Jersey: Building an 1,800 square feet expansion of our live dealer studio, increasing capacity from 18 to 33 tables. (Q3) • New portal User Interface to be released , first in West Virginia. (Q3) • Mobile Apps: submitted Android App to Google Play Store. • Business Intelligence: in - house development of new BI solution. (Q3)
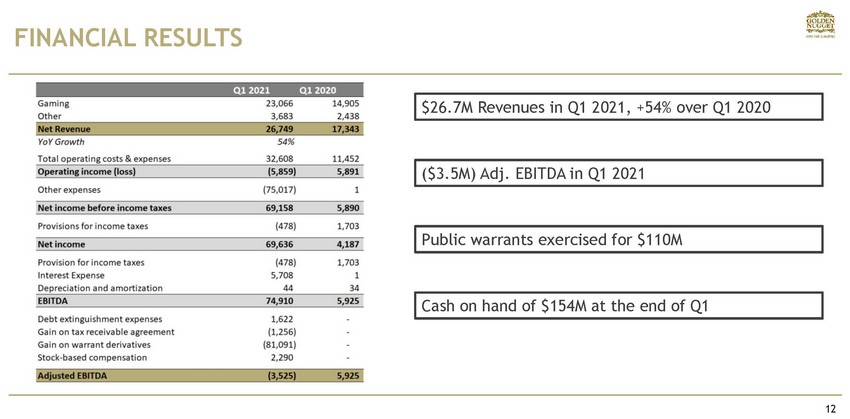
FINANCIAL RESULTS 12 $26.7M Revenues in Q1 2021, +54% over Q1 2020 Public warrants exercised for $110M Cash on hand of $154M at the end of Q1 ($3.5M) Adj. EBITDA in Q1 2021
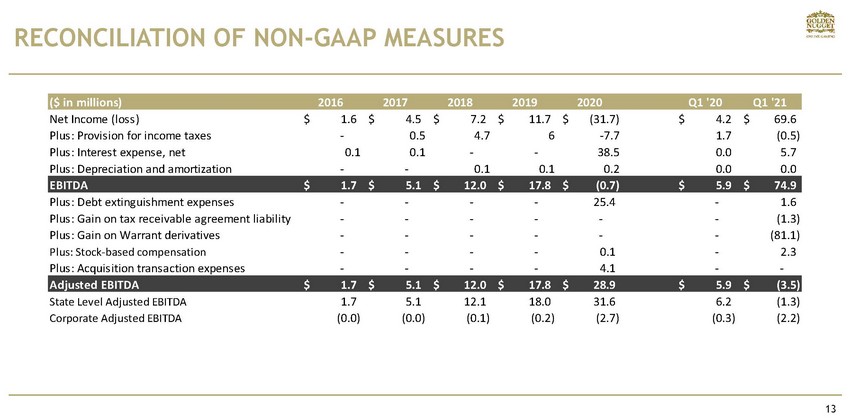
RECONCILIATION OF NON - GAAP MEASURES 13 ($ in millions) 2016 2017 2018 2019 2020 Q1 '20 Q1 '21 Net Income (loss) 1.6$ 4.5$ 7.2$ 11.7$ (31.7)$ 4.2$ 69.6$ Plus: Provision for income taxes - 0.5 4.7 6 -7.7 1.7 (0.5) Plus: Interest expense, net 0.1 0.1 - - 38.5 0.0 5.7 Plus: Depreciation and amortization - - 0.1 0.1 0.2 0.0 0.0 EBITDA 1.7$ 5.1$ 12.0$ 17.8$ (0.7)$ 5.9$ 74.9$ Plus: Debt extinguishment expenses - - - - 25.4 - 1.6 Plus: Gain on tax receivable agreement liability - - - - - - (1.3) Plus: Gain on Warrant derivatives - - - - - - (81.1) Plus: Stock-based compensation - - - - 0.1 - 2.3 Plus: Acquisition transaction expenses - - - - 4.1 - - Adjusted EBITDA 1.7$ 5.1$ 12.0$ 17.8$ 28.9$ 5.9$ (3.5)$ State Level Adjusted EBITDA 1.7 5.1 12.1 18.0 31.6 6.2 (1.3) Corporate Adjusted EBITDA (0.0) (0.0) (0.1) (0.2) (2.7) (0.3) (2.2)
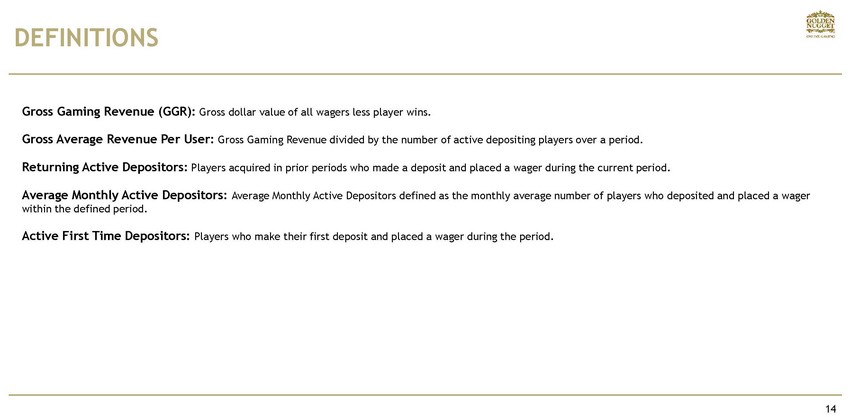
14 DEFINITIONS Gross Gaming Revenue (GGR): Gross dollar value of all wagers less player wins. Gross Average Revenue Per User: Gross Gaming Revenue divided by the number of active depositing players over a period. Returning Active Depositors : Players acquired in prior periods who made a deposit and placed a wager during the current period. Average Monthly Active Depositors: Average Monthly Active Depositors defined as the monthly average number of players who deposited and placed a wager within the defined period. Active First Time Depositors: Players who make their first deposit and placed a wager during the period.