Attached files
| file | filename |
|---|---|
| 8-K - FORM 8-K - BM Technologies, Inc. | ea141086-8k_bmtech.htm |
Exhibit 99.1

A Banking - as - a - Service pioneer, enabling non - banks to build financial services for their customers Investor Presentation May 2021 A Banking - as - a - Service pioneer, enabling non - banks to build financial services for their customers Q1 2021

2 | Disclaimer BM Technologies is not a bank, and it does not provide banking services. The BankMobile platform facilitates deposits and ban kin g services between a customer and an FDIC - insured partner bank. Any reference in this presentation to “banking” or “banking serv ices” is in reference to the BankMobile technology providing services between customers and a partner bank. The BankMobile brand and tra demark is only used in reference to services being provided between a customer and an FDIC - insured partner bank. This presentation is for informational purposes only and should not be relied on for any other purpose. No representations or wa rranties, express or implied are given in, or with respect to, this Presentation. Industry and market data used in this Prese nta tion have been obtained from third - party industry sources as well as from research reports prepared for other purposes. The Company has n ot independently verified the data obtained from these sources and cannot assure you of the data’s accuracy and completeness. Th is data is subject to change. This Presentation and the contents hereof are confidential. No Offer or Solicitation This Presentation is for informational purposes only and is neither an offer to sell or purchase, nor a solicitation of an of fer to sell, buy or subscribe for any securities, nor shall there be any sale, issuance or transfer of securities in any jurisdic ti on in contravention of applicable law. No offering of securities shall be made except by means of a prospectus meeting the requirements of section 1 0 o f the Securities Act of 1933, as amended (the “Securities Act”), or an exemption therefrom. Forward - Looking Statements This Presentation includes “forward - looking statements” within the meaning of Section 27A of the Securities Act and Section 21E of the Securities Exchange Act of 1934, as amended. This information is, where applicable, based on estimates, assumptions an d a nalysis that management believes, as of the date hereof, provide a reasonable basis for the information contained herein. Forward - looki ng statements can generally be identified by the use of forward - looking words such as “may,” “will,” “would,” “could,” “expect,” “intend,” “plan,” “aim,” “estimate,” “target,” “anticipate,” “believe,” “continue,” “objectives,” “outlook,” “guidance” or other simila r w ords, and include statements regarding plans, strategies, objectives, targets, estimates, projections, and expected financial pe rformance. These forward - looking statements involve known and unknown risks, uncertainties and other factors. Actual results, performance o r achievements may differ materially, and potentially adversely, from any projections and forward - looking statements and the assumptions on which those projections and forward - looking statements are based. There can be no assurance that the data contain ed herein is reflective of future performance to any degree. You are cautioned not to place undue reliance on forward - looking statements as a predictor of future performance as projected financial information, cost savings, synergies and other informa tio n are based on estimates and assumptions that are inherently subject to various significant risks, uncertainties and other fa cto rs. There can be no assurance that the estimates and assumptions made in preparing the financial projections and forecasts will prove accur ate , that the projected results will be realized or that actual results will not be significantly higher or lower than projected . T he Company's financial performance and results of operations will be subject to a variety of risks, including but not limited to general e con omic conditions, consumer adoption, technology and competition, the ability to enter into new partnerships, regulatory risks, ri sks associated with the higher education industry and financing, and the operations and performance of its partners, including white - label part ners. These risks and uncertainties include, but are not limited to, those factors described in the section entitled “Risk Fa cto rs” and in the Company’s periodic filings with the SEC. The Company’s SEC filings are available publicly on the SEC website at www.sec.gov . All information herein speaks only as of the date hereof unless otherwise specified. Management undertakes no duty to update, ad d to or otherwise revise or correct any of the information contained herein, whether as a result of new information supplied, fu ture events, inaccuracies that become apparent after the date hereof or otherwise. Forecasts and estimates regarding industry and end markets are based on sources believed to be reliable, however, there can be no assurance these forecasts and estimates will p ro ve accurate in whole or in part. Use of Projections This Presentation contains financial forecasts with respect to, among other things, income sources, revenue growth, and equit y v alues. These unaudited financial projections should not be relied upon as being necessarily indicative of future results. The in clusion of the unaudited financial projections in this Presentation is not an admission or representation that such information is material. Th e assumptions and estimates underlying the unaudited financial projections are inherently uncertain and are subject to a wide va riety of significant business, economic and competitive risks and uncertainties that could cause actual results to differ materially f rom those contained in the unaudited financial projections. There can be no assurance that the prospective results are indicative o f future performance or that actual results will not differ materially from those presented in the unaudited financial projections. In clu sion of the unaudited financial projections in this Presentation should not be regarded as a representation by any person tha t t he results contained in the unaudited financial projections will be achieved. Non - GAAP Financial Measures This Presentation includes certain non - GAAP financial measures that management reviews to evaluate its business, measure its per formance and make strategic decisions. Management believes that such non - GAAP financial measures provide useful information to investors and others in understanding and evaluating its operating results in the same manner as management. EBITDA is a non - GAA P financial measure that represents net income prior to interest expense, net, other expense, net, income taxes, and deprecia tio n and amortization, as adjusted to add back certain non - cash and non - recurring charge. EBITDA and any other ratio or metrics derived t herefrom are financial measures not calculated in accordance with GAAP and should not be considered as substitutes for revenu e, net income, operating profit, or any other operating performance measure calculated in accordance with GAAP. Using these non - GAAP fi nancial measures to analyze the business would have material limitations because their calculations are based on the subjecti ve determination of management regarding the nature and classification of events and circumstances that investors may find signi fic ant. In addition, although other companies in its industry may report measures titled EBITDA or similar measures, such non - GAAP financial measures may be calculated differently from how management calculates its non - GAAP financial measures, which reduces t heir overall usefulness as comparative measures. Because of these limitations, you should consider EBITDA alongside other fin anc ial performance measures, including net income and other financial results presented in accordance with GAAP.
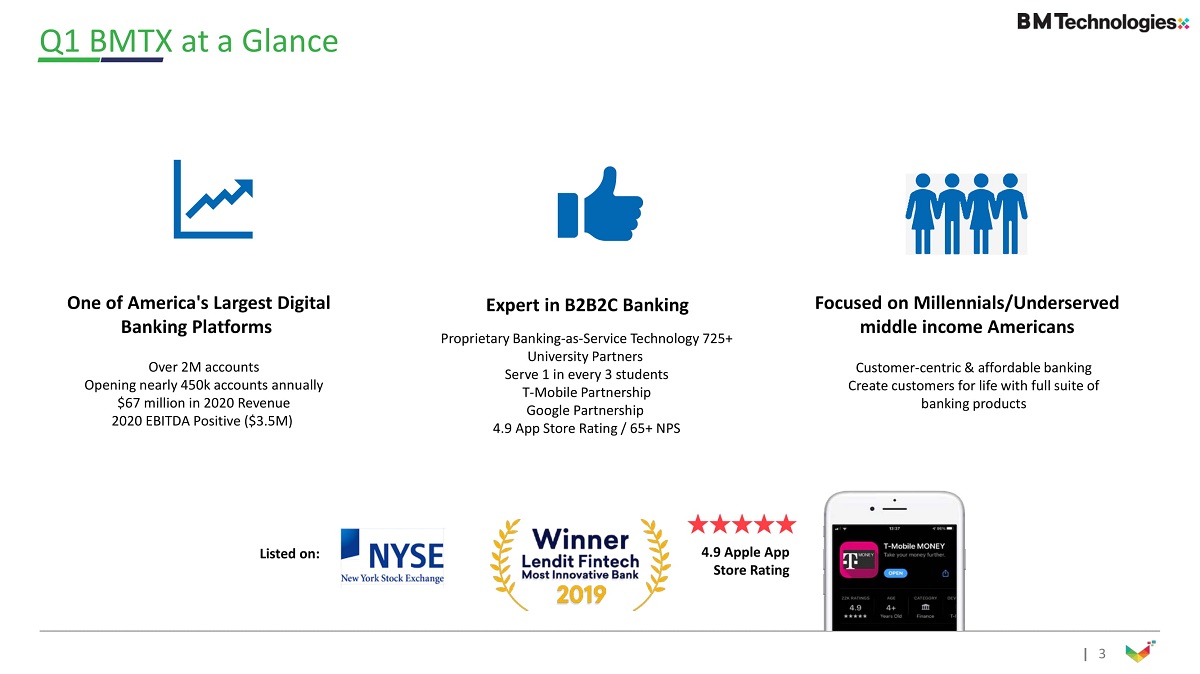
3 | Q1 BMTX at a Glance Focused on Millennials/Underserved middle income Americans Customer - centric & affordable banking Create customers for life with full suite of banking products One of America's Largest Digital Banking Platforms Over 2M accounts Opening nearly 450k accounts annually $67 million in 2020 Revenue 2020 EBITDA Positive ($3.5M) Expert in B2B2C Banking Proprietary Banking - as - Service Technology 725+ University Partners Serve 1 in every 3 students T - Mobile Partnership Google Partnership 4.9 App Store Rating / 65+ NPS Listed on: 4.9 Apple App Store Rating մմմմմ

4 | Q1 Financial Highlights: Record First Quarter #1 • Q1 Core EBITDA (1) : $ 8 .7mm • Core EBITDA Up (1) $9.6M YoY • Compare s favorably with FY 2020 EBTIDA of $3.5M Core EBITDA Up 10X YoY #2 • Q1 Core Revenue of $24.1M (2) • $8.5M improvement over Q1 2020 ($15.6M) Core Revenues Improved 54% YoY • Approximately 100K accounts opened in Q1 #3 New Accounts Opened (1) Note: Core EBITDA is a Non - GAAP Measure, see slide 18 for further detail (2) Note: Core Revenue is a Non - GAAP Measure, see slide 18 for further detail
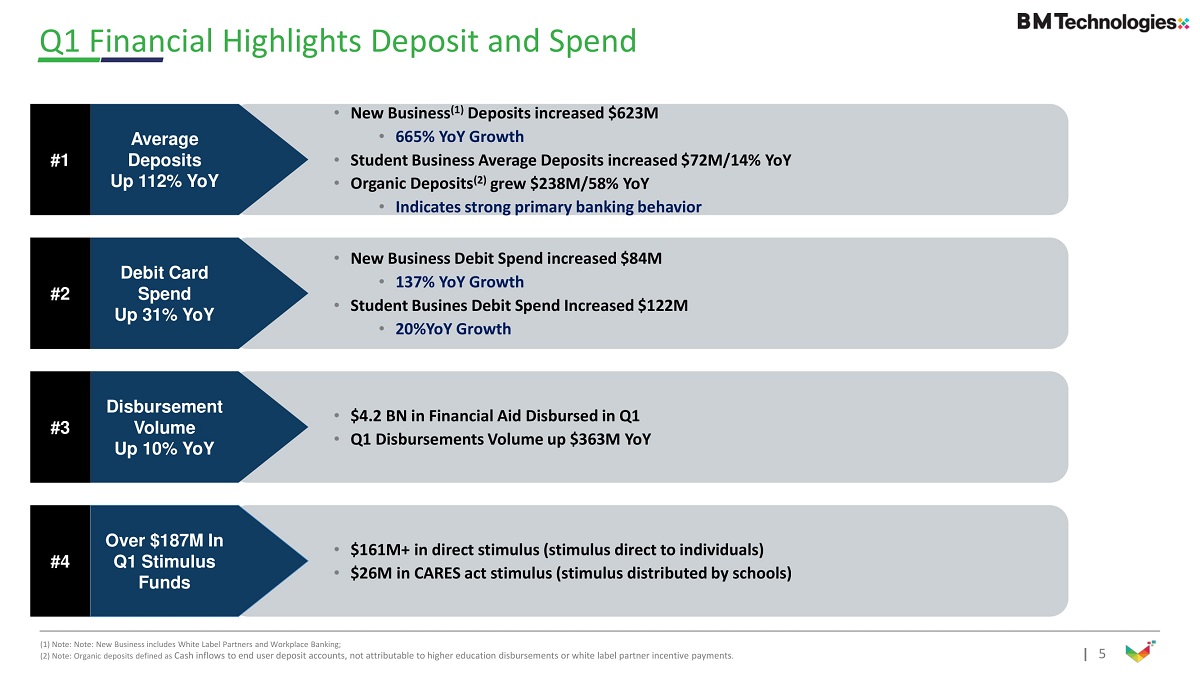
5 | • New Business (1) Deposits increased $623M • 665% YoY Growth • Student Business Average Deposits increased $72M/14% YoY • Organic Deposits ( 2 ) grew $238M/58% YoY • Indicates strong primary banking behavior Q1 Financial Highlights Deposit and Spend #1 Average Deposits Up 112% YoY • New Business Debit Spend increased $84M • 137% YoY Growth • Student Busines Debit Spend Increased $122M • 20%YoY Growth #2 Debit Card Spend Up 31% YoY • $4.2 BN in Financial Aid Disbursed in Q1 • Q1 Disbursements Volume up $363M YoY #3 Disbursement Volume Up 10% YoY • $161M+ in direct stimulus (stimulus direct to individuals) • $26M in CARES act stimulus (stimulus distributed by schools) #4 Over $187M In Q1 Stimulus Funds (1) Note: Note: New Business includes White Label Partners and Workplace Banking; (2) Note: Organic deposits defined as Cash inflows to end user deposit accounts, not attributable to higher education disbursements or white label partner incentiv e p ayments .

6 | Per Account Metrics (1) Q1’ 2020 Q1’ 2021 $30 $42 42% Growth % $1,296 $2,723 110% $963 $1,221 $1,475 $6,037 309% 27% $1,476 $2,015 30% $1,269 $1,644 37% $1,408 $1,820 29% Deposits/Account Spend/Account New Business Deposits/Account Spend/Account Student Business Deposits/Account Spend/Account BMTX BMTX Revenue / Account 1) All metrics are per 90 - Day active accounts

7 | Number of Accounts (TTM) New Business Verticals Performance EOP Serviced Deposit Balances (TTM) ($MM) Card Spend (TTM) ($MM) Q4’20 Q2’20 Q3’20 Q4’20 Q2’20 Q3’20 9% 74% 12% 123% 21% 79% 86% 579% 52% 250% 84% 343% QoQ Growth YoY Growth • Q uarterly card spend has increased 137% over Q1 2020 and the number of accounts opened has increased 61%. • Ending serviced deposit balances are growing exponentially, increasing 734% in the last twelve months. • Overall growth is driven by both increasing number of accounts and average account performance • New Business Account Level Metrics: • Avg Serviced Deposits Balances up 309% YoY per Account • Quarterly Card Spend up 27 % YoY per Account Q4’20 Q2’20 Q3’20 7% 129% 44% 540% 23% 180% Account Level Performance of the New Business Verticals AVG Serviced Deposit Balances per Active Account ($) Card Spend per Quarter p er Active Account ($) QoQ Growth YoY Growth QoQ Growth YoY Growth Q1’21 9% 61% Q1’21 61 % 734% 26 % 137% Q1’21 Apr May Jun Jul Aug Sep Oct Nov Dec Jan Feb Mar 2020 2021 Apr May Jun Jul Aug Sep Oct Nov Dec Jan Feb Mar 2020 2021 Q1 20 Q2 20 Q3 20 Q4 20 Q1 21 New Business Total BMTX Higher Ed Q1 20 Q2 20 Q3 20 Q4 20 Q1 21 New Business Total BMTX Higher Ed

8 | 0.63% 0.84% 2020 Q1 2021 Q1 Demonstrating Strong Performance Across Key Metrics Key Performance Indicators – Metrics of Company Success University Retention Vs. 3 Year Average Q1 TTM retention is above average of trailing 3 years’ retention Calculated as one minus the annual SSE attrition over beginning of the year SSE count Interchange Rate Q1 Rebound from depressed Covid levels Represents the amount of revenue for each debit card transaction, including interchange maintenance paid by partner bank, net of network costs, as a % of debit spend The aggregate amount of spend on debit cards in Q1 2021 vs Q1 2020 Debit Card spend grew 31% YoY in Q1 2021. EoP Serviced Deposits Q1 ($M) Growth driven by increase in accounts, organic deposits, and boosted by federal stimulus programs Aggregate, end of period balance of serviced customer deposits across all business lines Organic Deposits YTD ($B) Cash inflows to end user deposit accounts, not attributable to higher education disbursements or white label partner incentive payments 155% 31 % 58 % +21bps Growth driven by stronger performing accounts and boosted by federal stimulus programs Comments: Definition: Card Spend Q1 ($M) 1 % $675 $881 Q1 2020 Q1 2021 $610 $1,557 Q1 2020 Q1 2021 $413 $651 Q1 2020 Q1 2021 98.5% 99.5% 3-Yr Avg Q1 TTM

9 | Income Statement – Historical 1) 2019 financials are shown pro forma for BM Technologies’ current deposit servicing and expense agreements with Customers Bank; see page 16 for reconciliations to Pro Forma Core Financials 2) EBITDA is a Non - GAAP financial measure; see page 17 for reconciliations to Non - GAAP financial measures Historical Income Statement Revenue Breakout by Major Categories Card Revenue Account Fees Other Fees University Fees Deposit Servicing Fees Interchange and MasterCard incentive income based on card activity and out - of - network ATM fees Monthly account fees, wire fees and card replacement fees Various nominal other fees, including fees associated with cash deposits Subscription and transactional fees charged to colleges based on enrollment size, competitive marketplace and disbursement channels and options Fee charged to partner bank(s) based on average balances of serviced deposits Highly Attractive Business Model 39% % of Total 2020 Revenues 33% 17% 8% 2% 2019 Pro Forma Core (1) 2020 Pro Forma Core (1) 2021 'Q1 Interchange and Card Revenue 28.1 26.3 8.4 Servicing Fees From Customers Bank 16.5 22.3 9.1 Account Fees 10.9 11.3 2.7 University Fees 5.0 5.3 1.3 Other Fees 0.9 1.5 2.7 Pro Forma Core Revenues ($mm) $61.3 $66.7 $24.1 Less: Pro Forma Core OpEx (Excl. Deprec. & Amort.) ($mm) 63.6 63.1 15.4 Pro Forma Core EBITDA ($mm) ($2.2) $3.5 $8.7 Less: Interest Expense ($mm) 0.5 1.4 0.05 Less: Deprec. & Amort. ($mm) 9.3 11.9 2.96 Pro Forma Core Pre-Tax Income ($mm) ($12.1) ($9.8) $5.7 Less: Tax Expense ($mm) 0.0 0.0 1.8 Pro Forma Core Net Income ($mm) ($12.1) ($9.8) $3.9 Average Serviced Deposits ($mm) $549 $750 $1,317 YoY Growth Average Serviced Deposits 37% 112% Pro Forma Core Revenues 9% 54% Pro Forma Core OpEx (Excl. Depreciation & Amortization) (1%) (7%)

10 | 2021E Rev. 2021E EBITDA Digital Financial Platform Comparables SoFi 11.2x 27.0x Moneylion 16.1x NM Median 13.7x 27.0x Bank Tech Comparables FIS 8.2x 18.2x Intuit 11.2x 30.7x Fiserv 6.1x 15.4x ADP 5.4x 21.5x Jack Henry 6.5x 20.1x Temenos 11.7x 26.2x Q2 10.8x NM ACI Worldwide 4.3x 15.1x Bottomline Tech. 3.6x 17.7x Median 6.5x 19.2x Payment Technology and Software Solutions Comparables PayPal 11.1x 37.1x Square 4.7x NM Repay 8.9x 20.6x Global Payments 8.8x 18.7x i3 Verticals 4.3x 16.2x Shift4 Payments 3.7x 28.4x Paya, Inc. 5.3x 19.6x Median 5.3x 20.1x B2B / Card Issuers & Processors Comparables FleetCor 9.9x 17.8x WEX 6.2x 16.6x Alliance Data Systems 4.6x 14.2x Worldline 5.1x 19.7x EML Payments 8.1x 27.2x Median 6.2x 17.8x Enterprise Value / Public Comparable Companies (1) ▪ Enterprise Value multiples are valued at a significant discount when looking at 2021E EBITDA and revenue EV / 2021E EBITDA Multiples EV / 2021E Revenue Multiples Source: Capital IQ & FactSet Research Systems, Inc.; Market data as of 5/14/2021 Note: Multiples exclude valuations less than 0.0x and greater than 50.0x; Peer data reflects consensus estimates 1) Reflects median values for comparable companies in each respective industry 2) Forecast EBTIDA is based on managements $21.5M EBITDA guidance. Pro forma core revenue based on consensus estimates from S&P Capital IQ ▪ Private market valuations for US and Int’l Neobanks using disclosed valuations and number of accounts (3) Public Comparable Companies (1) Average: $ 543 per Customer Valuation ($mm) Accounts (3) (millions) $108.9mm $ 25,000 mm $3,500mm $5,500mm $1,548mm $ 1,400 mm ~2mm 34 mm 5mm 10mm 4.8mm 5mm Valuation / Customers 3) FT Partners Research, “The Rise of Challenger Banks”, Business Insider, TechCrunch and Bloomberg; References to number of customers is assumed to apply accounts; BMT account data as of 12/31/2020 $1,000mm 2mm $14,500mm 12 mm (2) Valuation Overview (2) 1.1x 4.6x

11 | • BMTX continues to build strong relationships and focus on university customer loyalty Q1 Higher Education Business Highlights #1 99%+ University Retention • In February, BMTX logged it’s one millionth SSE (Signed School Enrollment), providing access to 1 million more student to potentially convert to new BMTX customers. #2 Expanded Access to 1M+ Additional Students • BMTX introduced a new vendor payments product and signed a contract with a higher education services company that should significantly expand our reach to new colleges and universities. #3 New Student Payment Solutions • BMTX is developing co - branded BankMobile Google Plex account, which we expect will result in more students choosing a BankMobile account to receive their refund. #4 New Strategic Partnerships

12 | • Highly active users: 14% of new business accounts • Have a spend/account of $19,500 (vs. $14,700 1 year ago) • Have an average balance/acct of $1,200 (vs. $570 1 year ago) New Business Highlights (White Label & Workplace Banking) #1 Strong Performance Metrics • Actively working a pipeline of prospective new white label customers, enabling them to offer BMTX’s proprietary technology stack. • We continue to be in discussions with retailers, fintechs , and banks among others and hope to announce a partnership in the coming months. #2 Active White Label Pipeline • In late 2020, we announced partnerships with Prudential Financial, Inc., and BenefitHub to provide financial wellness services as part of the Workplace Banking offering. • Continuing to expand a pipeline of partnerships with HR Brokers, Digital Benefit Platforms, and Fintech companies focused on financial wellness and employee benefits. #3 Workplace Banking Pipeline

13 | Tremendous Platform Growth Opportunity Multiple Levers to Accelerate Growth Expand Student Adoption and Create Long - Term Customer Relationships by Expanding Access to Credit Products Continue to Add New White - Label Partners Strategic M&A Expand Distribution Channels and Product Offerings x Drive strong organic growth by successfully executing on our customer acquisition and engagement strategies x Continue RFP process and strategic discussions with vetted blue - chip, white - label partners to tap into their loyal customer bases x Distribute the platform through new channels to open up incremental TAM x Capitalize on robust universe of marketplace lenders, Personal Financial Management (“PFM”) players, and vertical higher - ed software acquisition targets Further Expand Within Existing White - Label Partnerships x Continue to add new SSEs x Increase adoption rates through new partnerships x Expand bank partnerships to expand access to credit

14 | Crypto Investing Advice Lending Looking Forward: 5 Pillars Of the BMTX Banking Platform Next 6 - 18 Months Banking Next 6 - 18 Months Next 6 - 18 Months

15 | Key Investment Highlights Established Customer Base 2m+ Accounts Strong Existing Partnerships 725 University Partners T - Mobile, Google Record Financial Results Q1 Core EBITDA (1) UP 10X YoY Q1 Core Revenue (1) Up 54% YoY Account Growth Approximately 100K Accounts Opened in Q1 Deep Customer Engagement 42% Revenue Per Active Account YoY Increase Higher Balances & Spend Proprietary Digital Banking Platform Ready to roll out to White Label and Workplace Banking partners in pipeline Attractive Valuation Deep Discount to Public and Private Peer Set (1) Note: Core EBITDA and Revenue are Non - GAAP measures, see slide 18 for further detail

16 | Q&A Questions

17 | Note: Analysis assumes $27.7 million cash held in the trust account by MFAC related to existing MFAC public stockholders (reflects cur rent amount following the November 2020 shareholder redemption period), shares will remain outstanding and cash will be avail abl e for use in the SPAC merger transaction 1) C ore EBITDA set forth on “Reconciliation to Non - GAAP Financial Measures” on slide 18 2) Revenue based on consensus estimates from S&P Capital IQ Capitalization and Ownership Equity Capitalization Summary Share Count % of (millions) Total Shares Issued to CUBI Shareholders 4.9 40.0% Former MFAC Public Shareholders 2.7 21.7% PIPE Investors 1.9 15.7% BMTX Employees 1.3 11.1% MFAC Sponsors 1.2 9.9% MFAC Advisors 0.2 1.6% Total 12.2 100.0% Party Capitalization at Closing Share Price (as of 5/14/21) $9.16 Total Shares Outstanding 12.2 BMTX Equity Value $111.8 (+) Debt 5.4 (-) Cash 17.4 Enterprise Value $99.8 BMTX 2020 Core EBITDA ($mm) (1) $3.5 BMTX 2021E Core EBITDA ($mm) (1) $21.5 BMTX 2021E Core Revenue ($mm) (2) $90.2 EV / 2020 Core EBITDA 28.5x EV / 2021E Core EBITDA 4.6x EV / 2021 Core Revenue 1.1x

18 | Reconciliation to Pro Forma Core Financials Pro Forma Core Adjustments 1 Pro Forma adjustment to revenue to reflect BMT’s current deposit servicing agreement in all periods, whereby BMT receives of 1.50% for deposit servicing plus 1.50% for NIM Sharing, plus f raud reimbursement , less certain interest expense. 2 3 Adjustment to remove non - cash WIP Write - down for discontinued product, net of partner cost reimbursements 1 2 3 4 Pro Forma Core Revenues minus Pro Forma Core Operating Expenses Revenues and expenses have been presented on a “pro forma core” basis to illustrate past periods as if the current deposit servicing agreement had been in place, and to remove non - recurring, one - time costs for merger expenses and Department of Education settlement Adjustment to remove non - core/nonrecurring merger and Department of Education settlement expenses related to legacy Higher One business now assumed by BM Technologies Pro Forma Core Financial Reconciliation Full Year Quarterly Quarterly ($ shown in 000s) 2019 Q1' 20 Q2' 20 Q3' 20 Q4' 20 Q1' 21 Revenues $72,307 $15,758 $15,431 $18,338 $17,331 $24,383 Deposit Servicing Fee Adjustment - Revenue (10,970) (123) 120 (96) (80) (283) Pro Forma Core Revenues $61,337 $15,635 $15,551 $18,242 $17,251 $24,100 Operating Expense 79,608 19,891 19,144 17,728 20,470 18,616 Merger / Dept of ED Settlement Expenses (2,100) (50) (25) (377) (287) 0 Non-Cash WIP Write-down, Net of Cost Reimbursement 0 (1,248) Service Fee Adjustment - Expense (4,653) (123) 120 (96) (80) (283) Pro Forma Core Operating Expenses $72,855 $19,718 $19,239 $17,255 $18,855 $18,333 Pro Forma Core Income / (Loss) Before Taxes & Interest ($11,518) ($4,083) ($3,688) $987 ($1,604) $5,767 Interest Expense 535 394 399 353 249 54 Pro Forma Core Pre-Tax Income / (Loss) ($12,053) ($4,477) ($4,087) $634 ($1,853) $5,713 Taxes 27 7 7 7 2 1,827 Pro Forma Core Net Income / (Loss) ($12,080) ($4,484) ($4,094) $627 ($1,855) $3,886 Pro Forma Core Financial Reconciliation Full Year Quarterly Quarterly ($ shown in 000s) 2019 Q1' 20 Q2' 20 Q3' 20 Q4' 20 Q1' 20 Pro Forma Core Pre-Tax Income ($12,053) ($4,477) ($4,087) $634 ($1,853) $5,713 Addback Interest 535 394 399 353 249 54 Addback of Depreciation & Amortization 9,288 3,180 3,045 2,785 2,927 2,960 Pro Forma Core EBITDA ($2,230) ($903) ($643) $3,772 $1,323 $8,727 4

19 | Source: BM Technologies management projections 1) Refer to Reconciliation to Pro Forma Core Financials on page 16 2) Reflects cost of debt Reconciliation to Non - GAAP Financial Measures ($ shown in millions) 2019 Pro Forma Core (1) 2020 2021Q1 Pro Forma Core Pre-Tax Income ($12.1) ($9.8) $5.7 Addback of Interest Expense (2) 0.5 1.4 0.05 Addback of Depreciation & Amortization 9.3 11.9 3.0 Pro Forma Core EBITDA ($2.2) $3.5 $8.7 Pro Forma Core EBITDA ($2.2) $3.5 $8.7 Pro Forma Core Revenue 61.3 66.7 24.1 Pro Forma Core EBITDA Margin (4%) 5% 36%