Attached files
| file | filename |
|---|---|
| 8-K - 8-K - FIRST FINANCIAL BANCORP /OH/ | ffbc-20210514.htm |
Investor Presentation First Quarter 2021 Exhibit 99.1
Forward Looking Statement Disclosure 2 Certain statements contained in this report which are not statements of historical fact constitute forward-looking statements within the meaning of the Private Securities Litigation Reform Act of 1995. Words such as ‘‘believes,’’ ‘‘anticipates,’’ “likely,” “expected,” “estimated,” ‘‘intends’’ and other similar expressions are intended to identify forward-looking statements but are not the exclusive means of identifying such statements. Examples of forward-looking statements include, but are not limited to, statements we make about (i) our future operating or financial performance, including revenues, income or loss and earnings or loss per share, (ii) future common stock dividends, (iii) our capital structure, including future capital levels, (iv) our plans, objectives and strategies, and (v) the assumptions that underlie our forward-looking statements. As with any forecast or projection, forward-looking statements are subject to inherent uncertainties, risks and changes in circumstances that may cause actual results to differ materially from those set forth in the forward-looking statements. Forward-looking statements are not historical facts but instead express only management’s beliefs regarding future results or events, many of which, by their nature, are inherently uncertain and outside of management’s control. It is possible that actual results and outcomes may differ, possibly materially, from the anticipated results or outcomes indicated in these forward-looking statements. Important factors that could cause actual results to differ materially from those in our forward-looking statements include the following, without limitation: • economic, market, liquidity, credit, interest rate, operational and technological risks associated with the Company’s business; • future credit quality and performance, including our expectations regarding future loan losses and our allowance for credit losses; • the effect of and changes in policies and laws or regulatory agencies, including the Dodd-Frank Wall Street Reform and Consumer Protection Act and other legislation and regulation relating to the banking industry; (iv) management’s ability to effectively execute its business plans; • mergers and acquisitions, including costs or difficulties related to the integration of acquired companies; • the possibility that any of the anticipated benefits of the Company’s acquisitions will not be realized or will not be realized within the expected time period; • the effect of changes in accounting policies and practices; • changes in consumer spending, borrowing and saving and changes in unemployment; • changes in customers’ performance and creditworthiness; • the costs and effects of litigation and of unexpected or adverse outcomes in such litigation; • current and future economic and market conditions, including the effects of declines in housing prices, high unemployment rates, U.S. fiscal debt, budget and tax matters, geopolitical matters, and any slowdown in global economic growth; • the adverse impact on the U.S. economy, including the markets in which we operate, of the novel coronavirus, which causes the Coronavirus disease 2019 (“COVID-19”), global pandemic, and the impact of a slowing U.S. economy and increased unemployment on the performance of our loan and lease portfolio, the market value of our investment securities, the availability of sources of funding and the demand for our products; • our capital and liquidity requirements (including under regulatory capital standards, such as the Basel III capital standards) and our ability to generate capital internally or raise capital on favorable terms;
Forward Looking Statement Disclosure 3 • financial services reform and other current, pending or future legislation or regulation that could have a negative effect on our revenue and businesses, including the Dodd-Frank Act and other legislation and regulation relating to bank products and services; • the effect of the current interest rate environment or changes in interest rates or in the level or composition of our assets or liabilities on our net interest income, net interest margin and our mortgage originations, mortgage servicing rights and mortgage loans held for sale; • the effect of a fall in stock market prices on our brokerage, asset and wealth management businesses; • a failure in or breach of our operational or security systems or infrastructure, or those of our third-party vendors or other service providers, including as a result of cyber attacks; • the effect of changes in the level of checking or savings account deposits on our funding costs and net interest margin; and • our ability to develop and execute effective business plans and strategies. Additional factors that may cause our actual results to differ materially from those described in our forward-looking statements can be found in our Form 10-K for the year ended December 31, 2020, as well as our other filings with the SEC, which are available on the SEC website at www.sec.gov. All forward-looking statements included in this filing are made as of the date hereof and are based on information available at the time of the filing. Except as required by law, the Company does not assume any obligation to update any forward-looking statement.
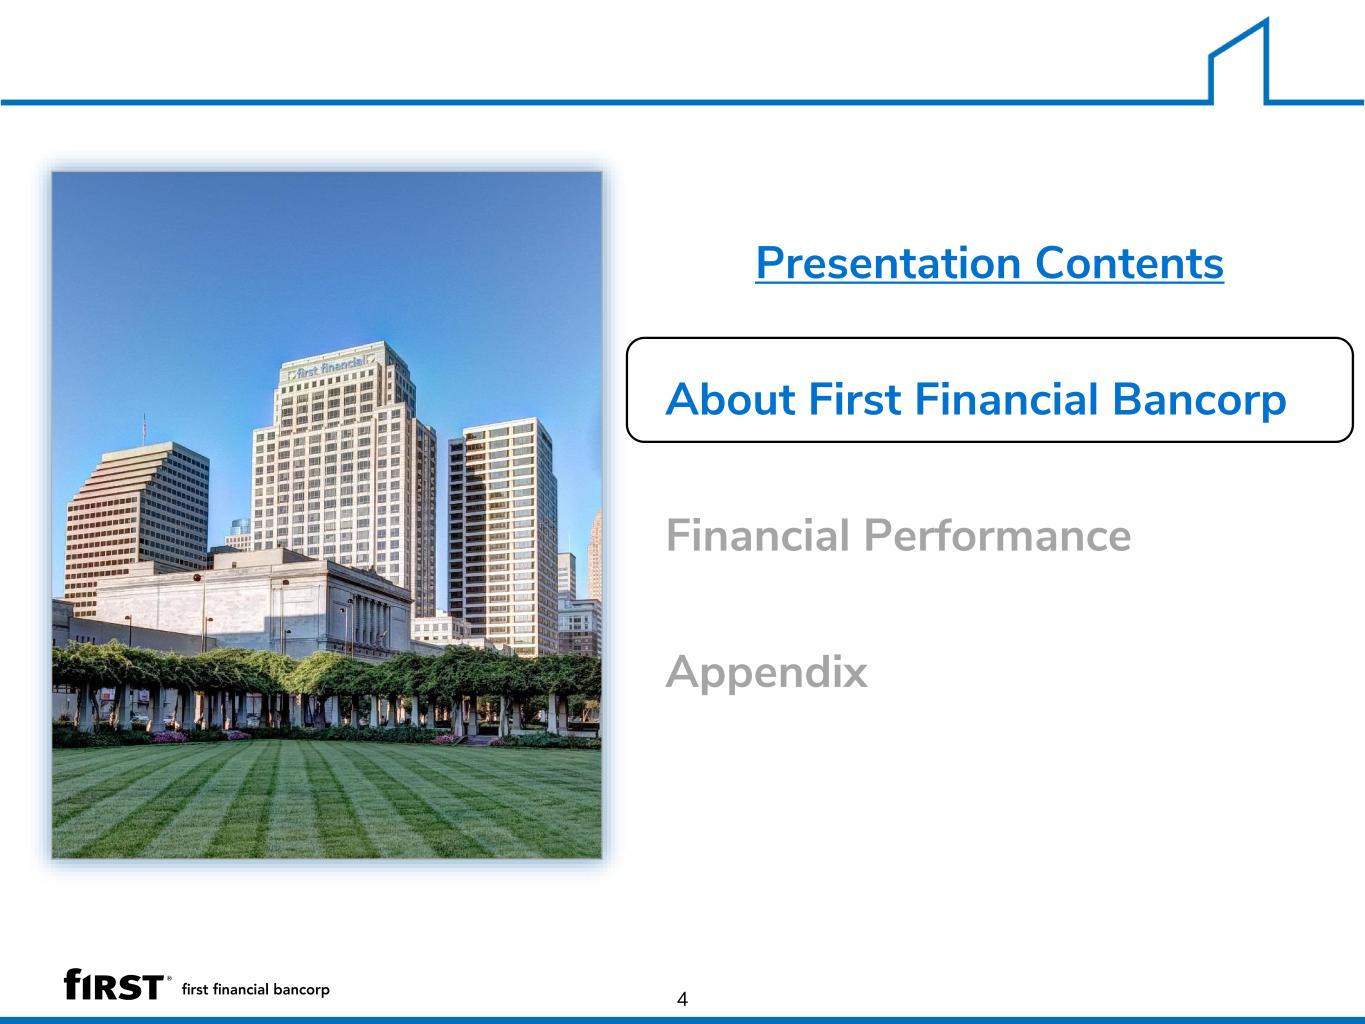
Presentation Contents About First Financial Bancorp Financial Performance Appendix 4
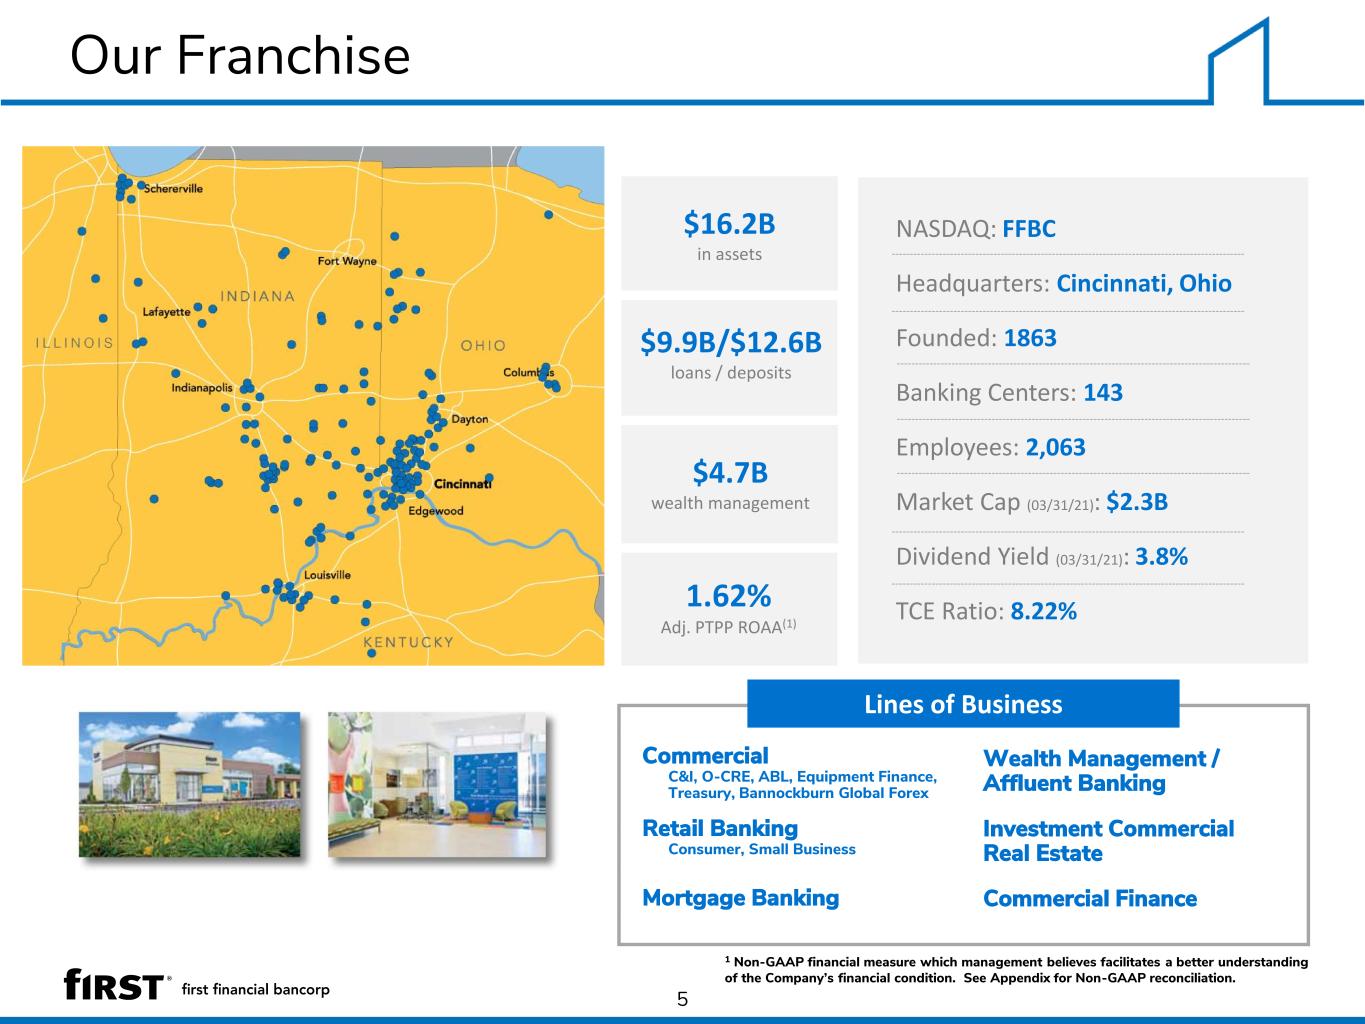
Our Franchise 5 Commercial C&I, O-CRE, ABL, Equipment Finance, Treasury, Bannockburn Global Forex Retail Banking Consumer, Small Business Mortgage Banking NASDAQ: FFBC Headquarters: Cincinnati, Ohio Founded: 1863 Banking Centers: 143 Employees: 2,063 Market Cap (03/31/21): $2.3B Dividend Yield (03/31/21): 3.8% TCE Ratio: 8.22% Wealth Management / Affluent Banking Investment Commercial Real Estate Commercial Finance Lines of Business 1.62% Adj. PTPP ROAA(1) $16.2B in assets $9.9B/$12.6B loans / deposits $4.7B wealth management 1 Non-GAAP financial measure which management believes facilitates a better understanding of the Company’s financial condition. See Appendix for Non-GAAP reconciliation.
Key Investment Highlights Proven & sustainable business model spanning 150+ years • Well managed through past credit cycles • Conservative operating philosophy • Consistent profitability – 122 consecutive quarters Premier Midwest franchise with top quartile performance High quality balance sheet & robust capital position (11.81% CET1 / 8.22% TCE) Prudent risk management & credit culture with strong asset quality Increased scale to continue investments in technology Track record of well-executed acquisitions with a well-defined M&A strategy Experienced and proven management team 6
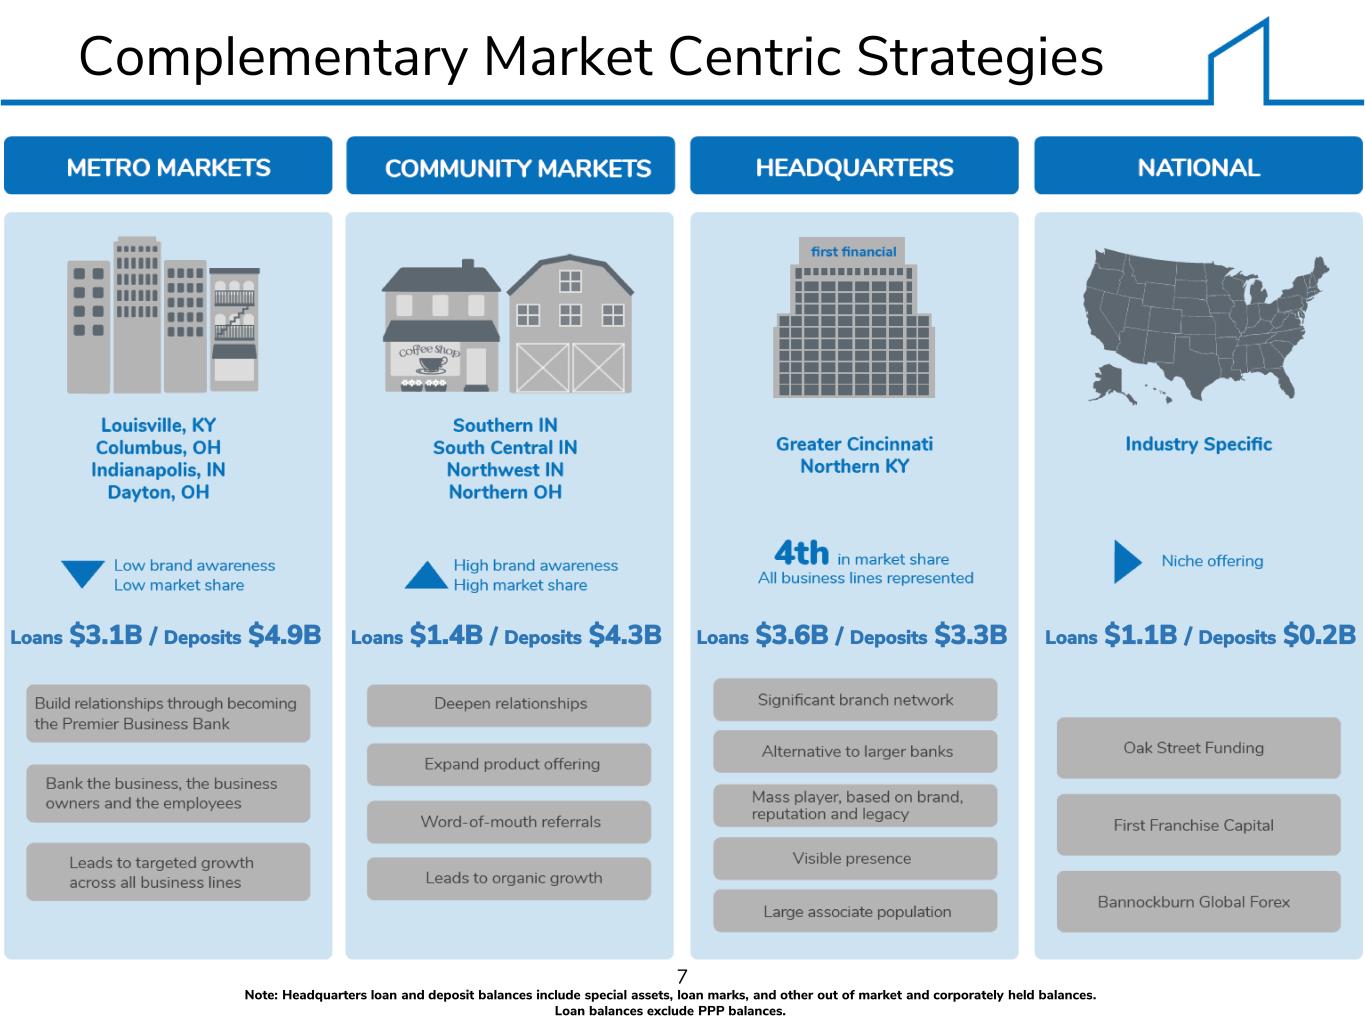
Complementary Market Centric Strategies Loans $3.1B / Deposits $4.9B Loans $1.4B / Deposits $4.3B Loans $3.6B / Deposits $3.3B 7 Note: Headquarters loan and deposit balances include special assets, loan marks, and other out of market and corporately held balances. Loan balances exclude PPP balances. Loans $1.1B / Deposits $0.2B
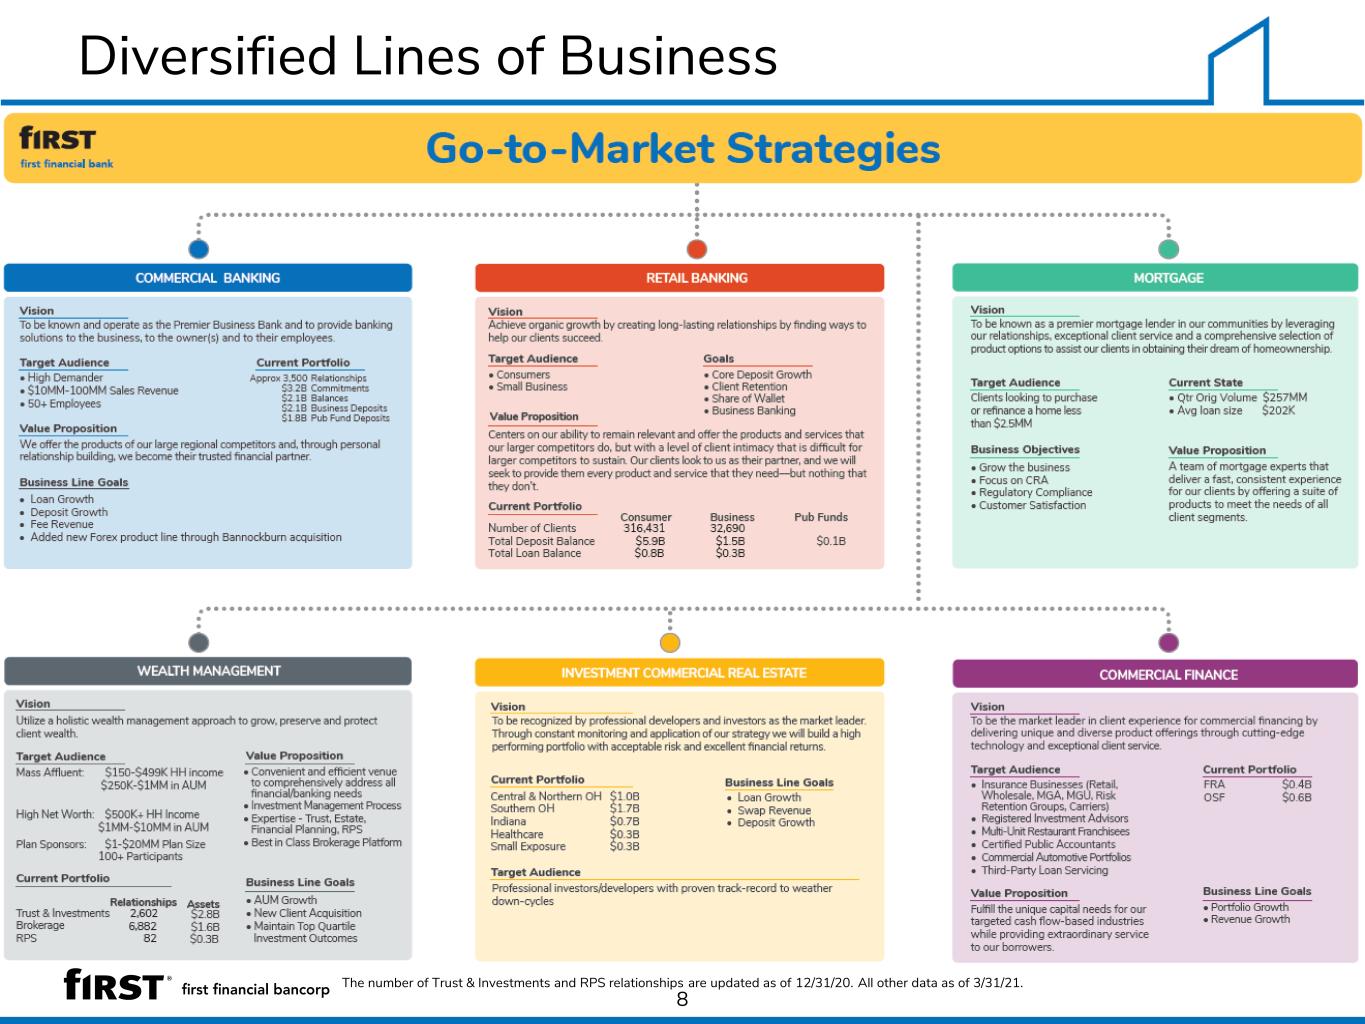
8 Diversified Lines of Business The number of Trust & Investments and RPS relationships are updated as of 12/31/20. All other data as of 3/31/21.
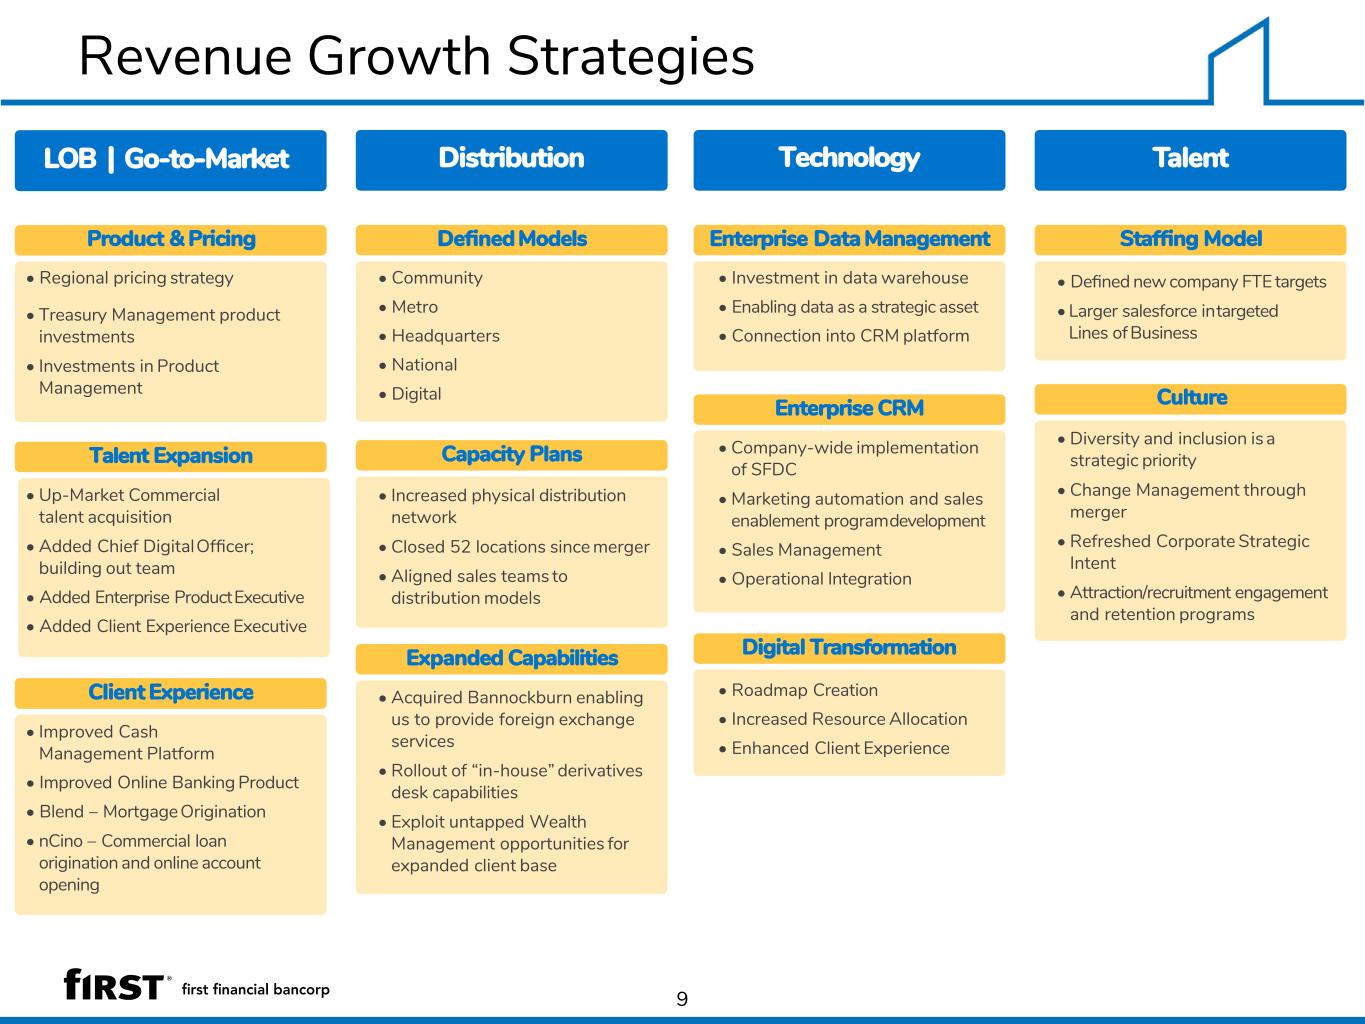
9 Revenue Growth Strategies Distribution Technology Talent Product & Pricing • Regional pricing strategy • Treasury Management product investments • Investments in Product Management DefinedModels • Community • Metro • Headquarters • National • Digital Enterprise Data Management • Investment in data warehouse • Enabling data as a strategic asset • Connection into CRM platform StaffingModel • Defined new company FTE targets • Larger salesforce intargeted Lines of Business Culture • Diversity and inclusion is a strategic priority • Change Management through merger • Refreshed Corporate Strategic Intent • Attraction/recruitment engagement and retention programs Capacity Plans • Increased physical distribution network • Closed 52 locations since merger • Aligned sales teams to distribution models Expanded Capabilities • Acquired Bannockburn enabling us to provide foreign exchange services • Rollout of “in-house” derivatives desk capabilities • Exploit untapped Wealth Management opportunities for expanded client base Talent Expansion • Up-Market Commercial talent acquisition • Added Chief DigitalOfficer; building out team • Added Enterprise ProductExecutive • Added Client Experience Executive Enterprise CRM • Company-wide implementation of SFDC • Marketing automation and sales enablement programdevelopment • Sales Management • Operational Integration Client Experience • Improved Cash Management Platform • Improved Online Banking Product • Blend – MortgageOrigination • nCino – Commercial loan origination and online account opening Digital Transformation • Roadmap Creation • Increased Resource Allocation • Enhanced Client Experience LOB | Go-to-Market
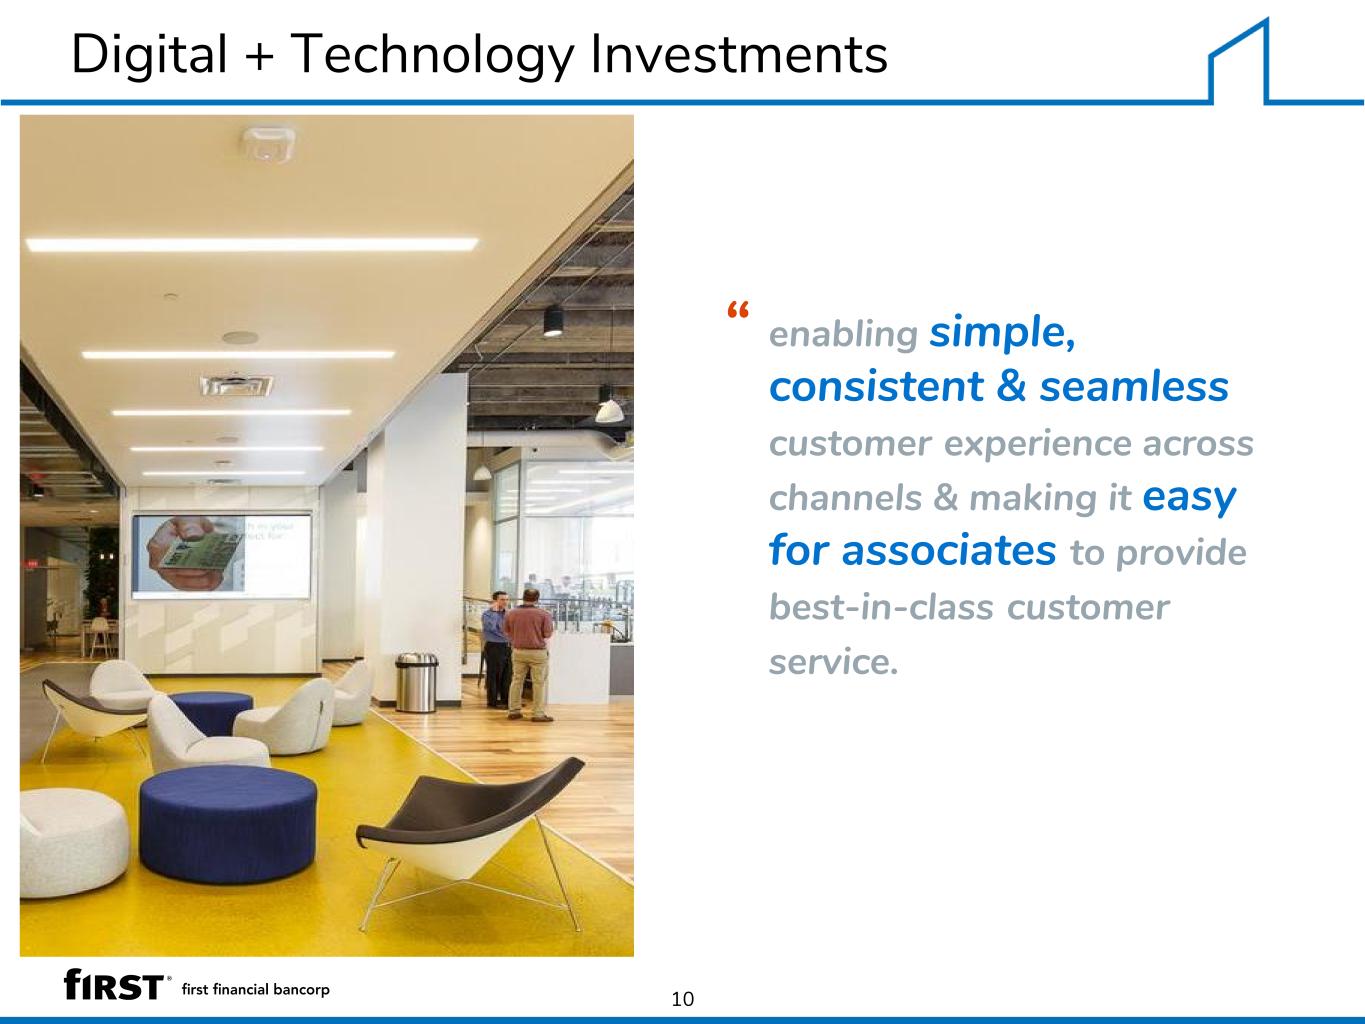
10 enabling simple, consistent & seamless customer experience across channels & making it easy for associates to provide best-in-class customer service. “ Digital + Technology Investments
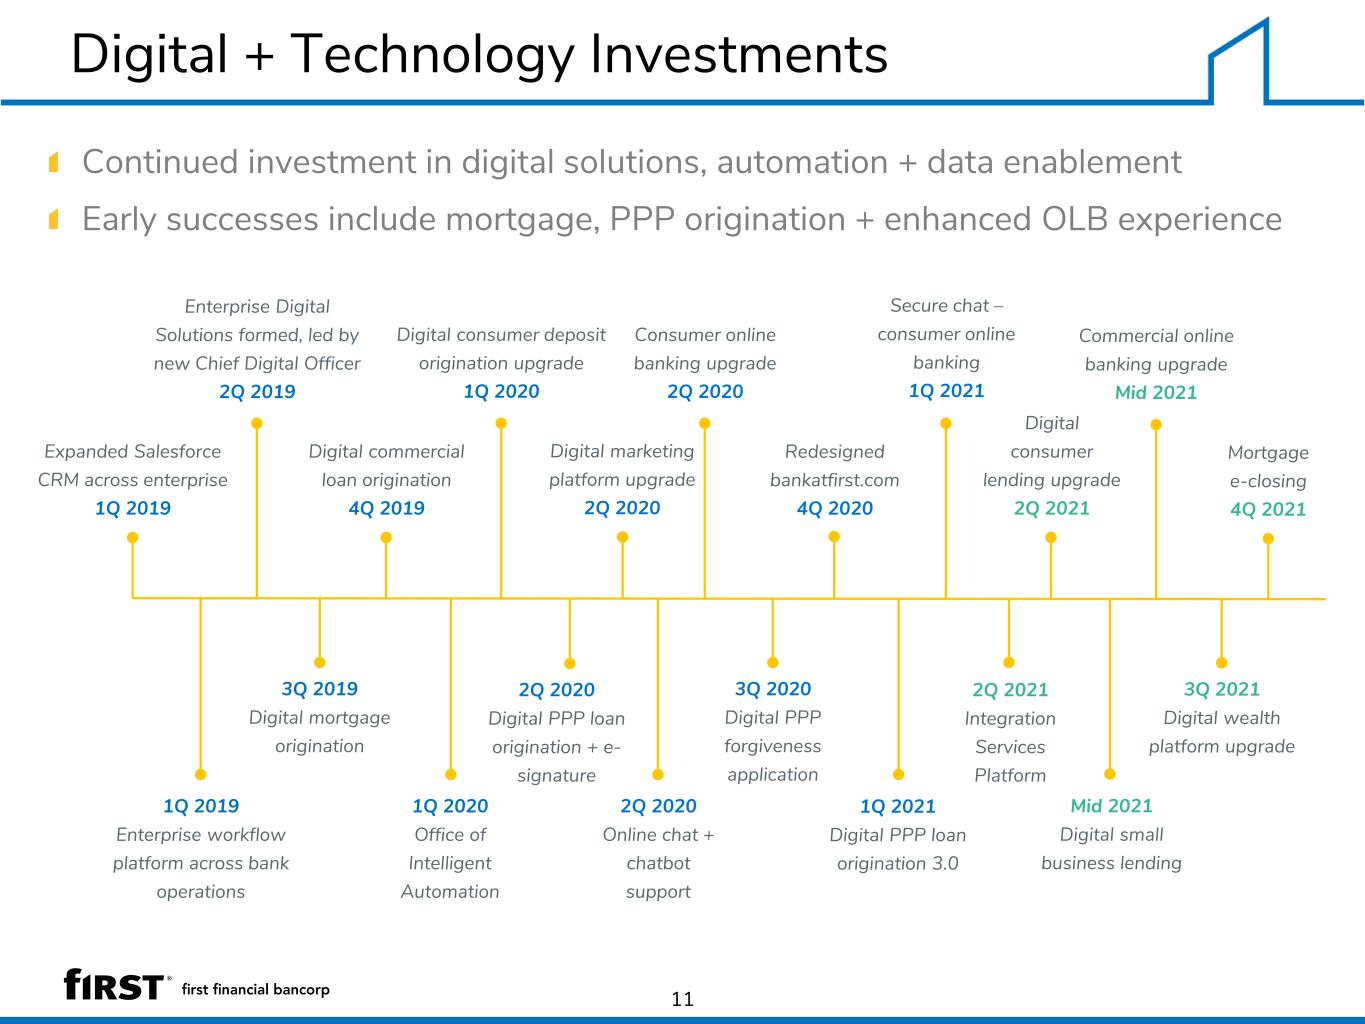
11 Expanded Salesforce CRM across enterprise 1Q 2019 Enterprise Digital Solutions formed, led by new Chief Digital Officer 2Q 2019 Digital commercial loan origination 4Q 2019 Digital consumer lending upgrade 2Q 2021 1Q 2019 Enterprise workflow platform across bank operations 3Q 2019 Digital mortgage origination 1Q 2020 Office of Intelligent Automation 3Q 2020 Digital PPP forgiveness application Continued investment in digital solutions, automation + data enablement Early successes include mortgage, PPP origination + enhanced OLB experience Digital + Technology Investments Consumer online banking upgrade 2Q 2020 2Q 2020 Digital PPP loan origination + e- signature Digital consumer deposit origination upgrade 1Q 2020 2Q 2020 Online chat + chatbot support Digital marketing platform upgrade 2Q 2020 1Q 2021 Digital PPP loan origination 3.0 Commercial online banking upgrade Mid 2021 3Q 2021 Digital wealth platform upgrade Redesigned bankatfirst.com 4Q 2020 Secure chat – consumer online banking 1Q 2021 2Q 2021 Integration Services Platform Mid 2021 Digital small business lending Mortgage e-closing 4Q 2021
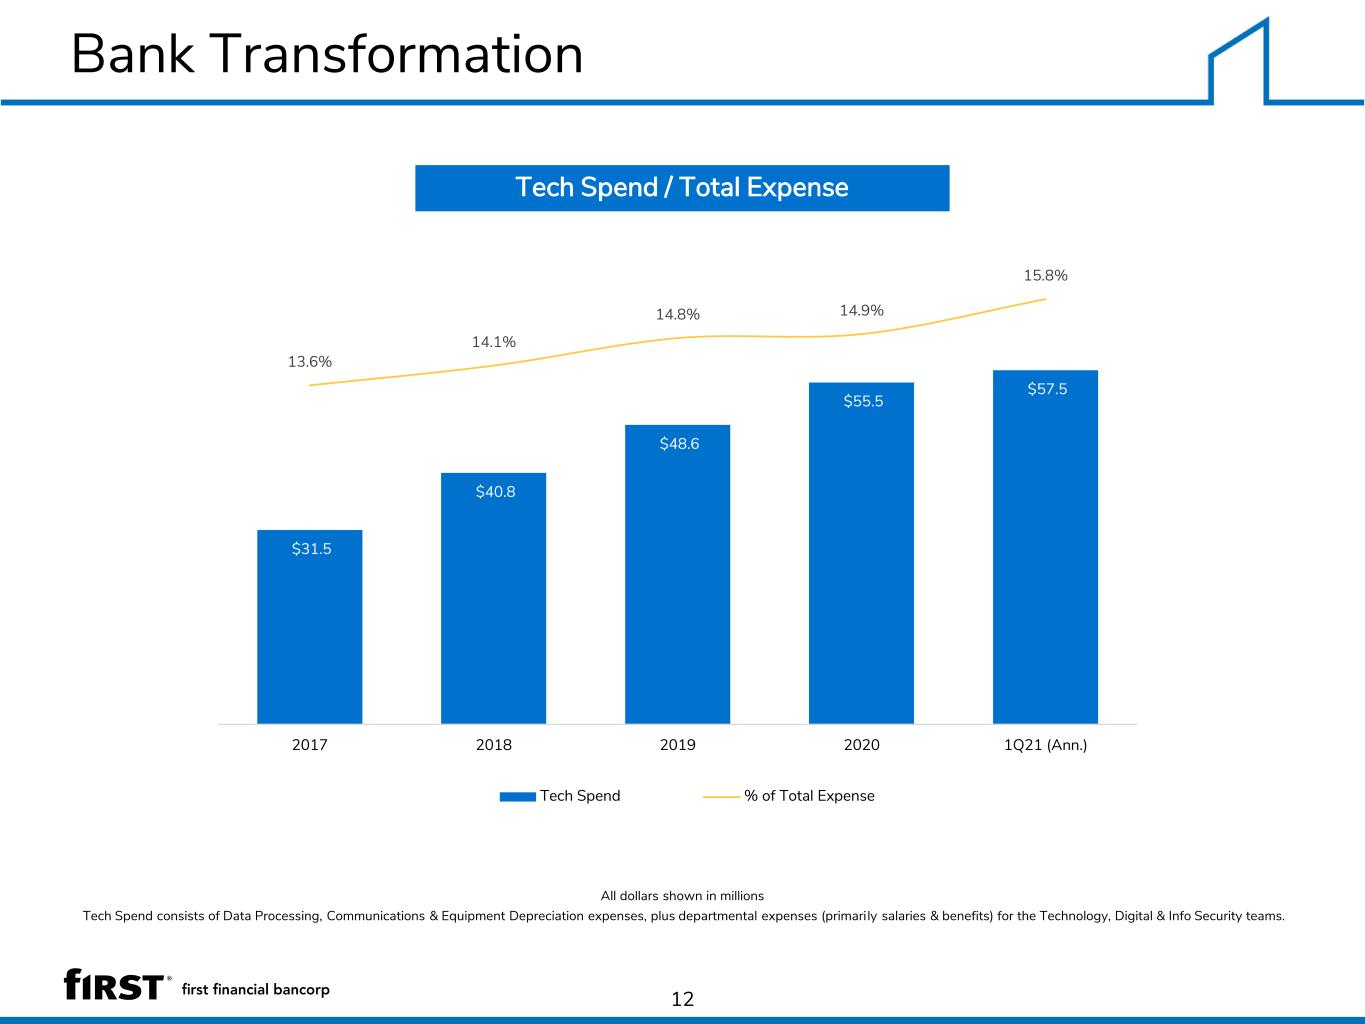
12 Bank Transformation All dollars shown in millions Tech Spend consists of Data Processing, Communications & Equipment Depreciation expenses, plus departmental expenses (primarily salaries & benefits) for the Technology, Digital & Info Security teams. Tech Spend / Total Expense $57.5 $55.5 $48.6 $40.8 $31.5 15.8% 14.9%14.8% 14.1% 13.6% 1Q21 (Ann.)2020201920182017 Tech Spend % of Total Expense
Presentation Contents About First Financial Bancorp Financial Performance Appendix 13
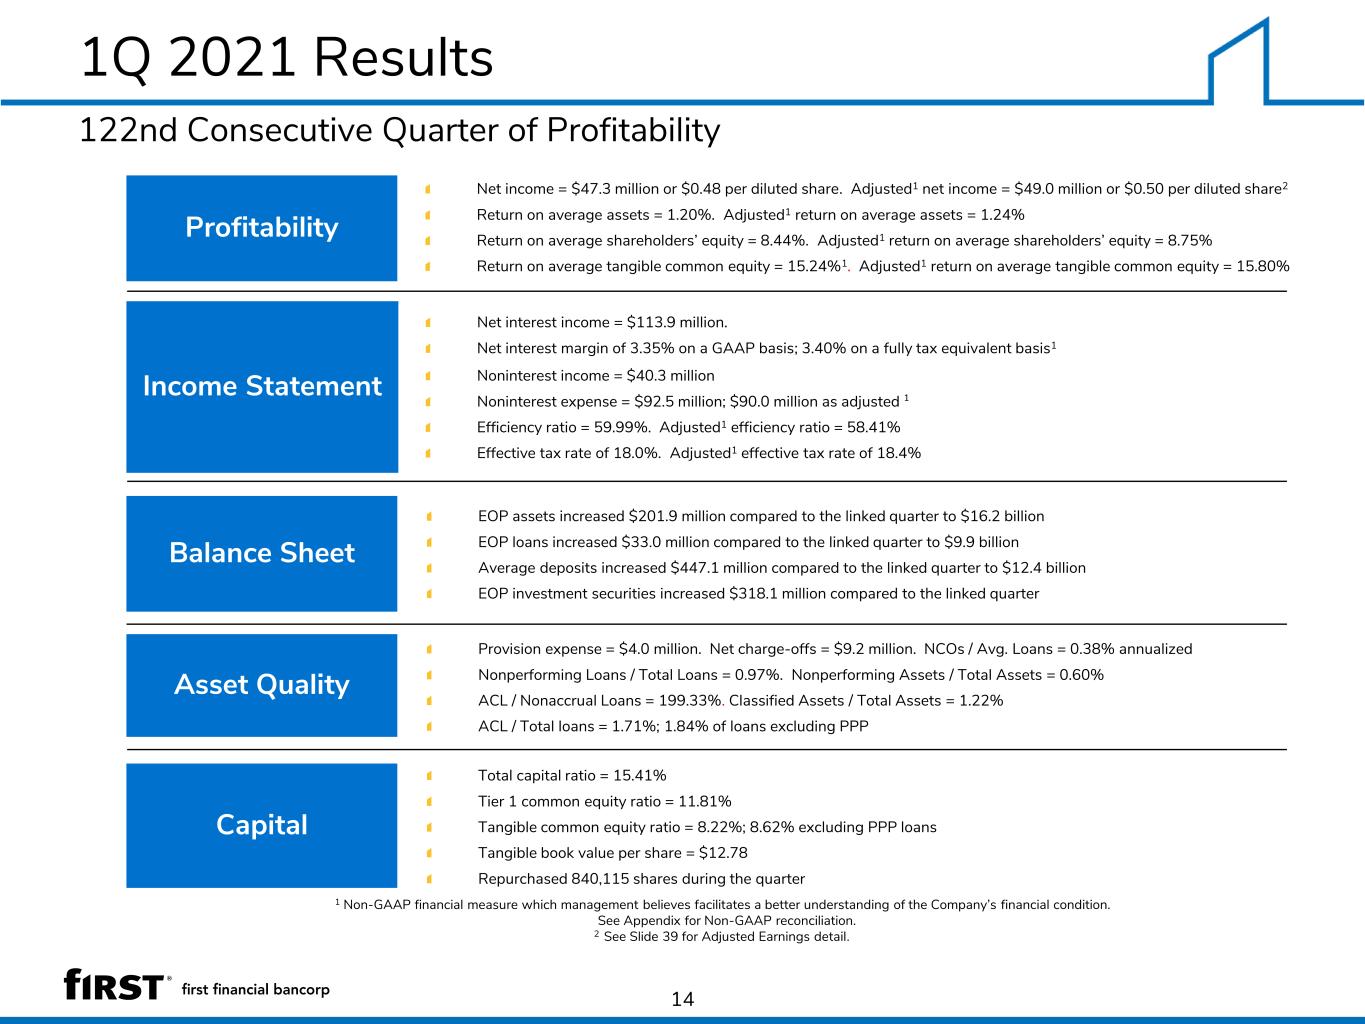
1Q 2021 Results 122nd Consecutive Quarter of Profitability 14 EOP assets increased $201.9 million compared to the linked quarter to $16.2 billion EOP loans increased $33.0 million compared to the linked quarter to $9.9 billion Average deposits increased $447.1 million compared to the linked quarter to $12.4 billion EOP investment securities increased $318.1 million compared to the linked quarter Balance Sheet Profitability Asset Quality Income Statement Capital Noninterest income = $40.3 million Noninterest expense = $92.5 million; $90.0 million as adjusted Efficiency ratio = 59.99%. Adjusted1 efficiency ratio = 58.41% Effective tax rate of 18.0%. Adjusted1 effective tax rate of 18.4% Net interest income = $113.9 million. Net interest margin of 3.35% on a GAAP basis; 3.40% on a fully tax equivalent basis1 Net income = $47.3 million or $0.48 per diluted share. Adjusted1 net income = $49.0 million or $0.50 per diluted share2 Return on average assets = 1.20%. Adjusted1 return on average assets = 1.24% Return on average shareholders’ equity = 8.44%. Adjusted1 return on average shareholders’ equity = 8.75% Return on average tangible common equity = 15.24%1. Adjusted1 return on average tangible common equity = 15.80% Provision expense = $4.0 million. Net charge-offs = $9.2 million. NCOs / Avg. Loans = 0.38% annualized Nonperforming Loans / Total Loans = 0.97%. Nonperforming Assets / Total Assets = 0.60% ACL / Nonaccrual Loans = 199.33%. Classified Assets / Total Assets = 1.22% ACL / Total loans = 1.71%; 1.84% of loans excluding PPP Total capital ratio = 15.41% Tier 1 common equity ratio = 11.81% Tangible common equity ratio = 8.22%; 8.62% excluding PPP loans Tangible book value per share = $12.78 Repurchased 840,115 shares during the quarter 1 Non-GAAP financial measure which management believes facilitates a better understanding of the Company’s financial condition. See Appendix for Non-GAAP reconciliation. 2 See Slide 39 for Adjusted Earnings detail. 1
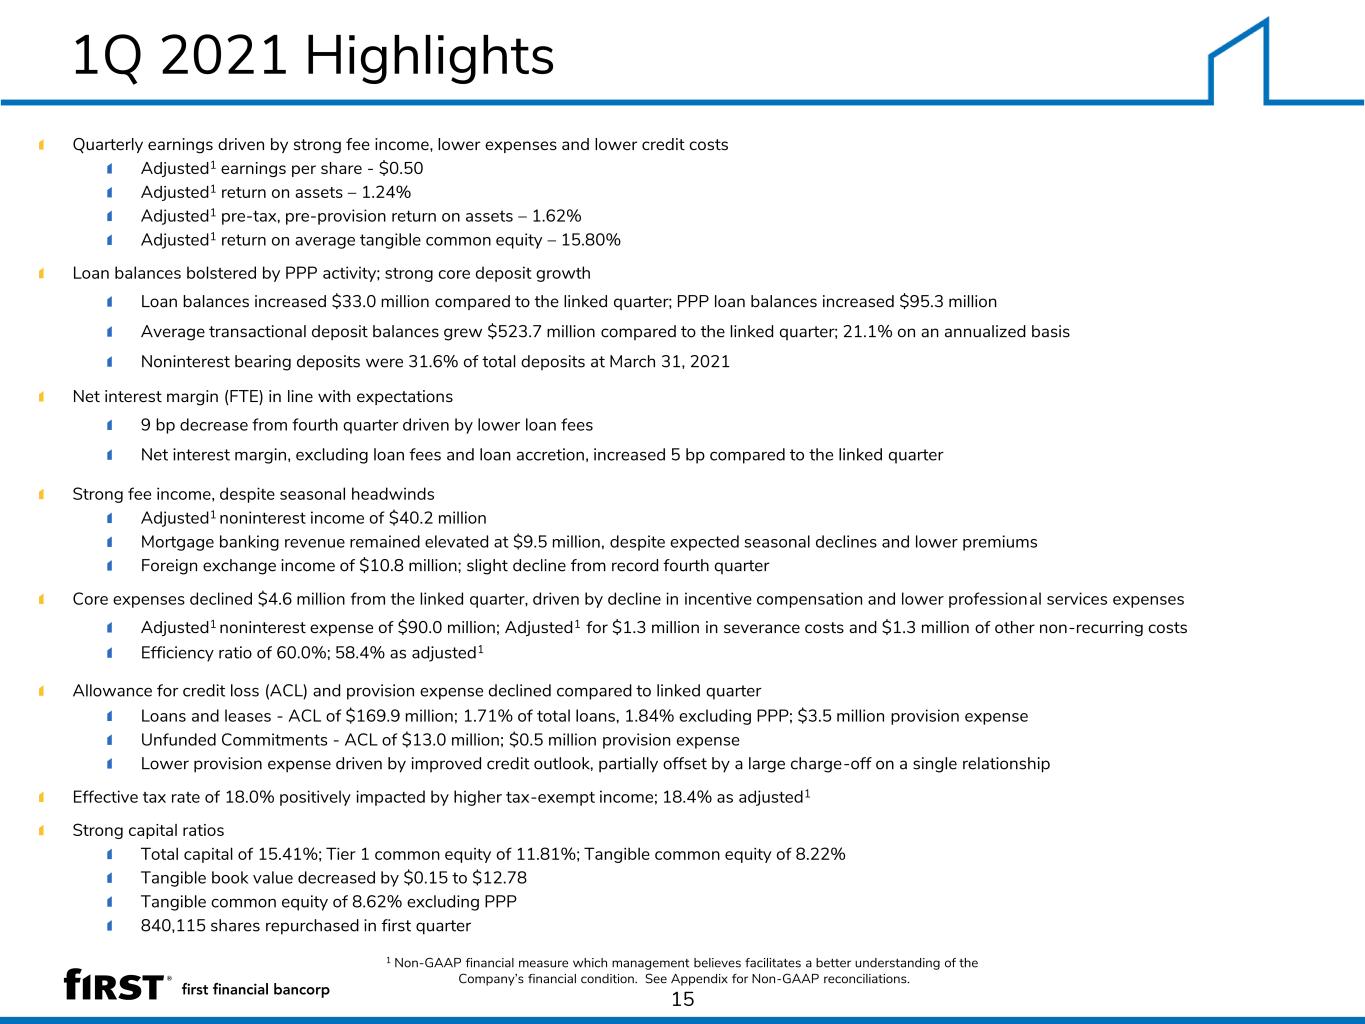
1Q 2021 Highlights Quarterly earnings driven by strong fee income, lower expenses and lower credit costs Adjusted1 earnings per share - $0.50 Adjusted1 return on assets – 1.24% Adjusted1 pre-tax, pre-provision return on assets – 1.62% Adjusted1 return on average tangible common equity – 15.80% Loan balances bolstered by PPP activity; strong core deposit growth Loan balances increased $33.0 million compared to the linked quarter; PPP loan balances increased $95.3 million Average transactional deposit balances grew $523.7 million compared to the linked quarter; 21.1% on an annualized basis Noninterest bearing deposits were 31.6% of total deposits at March 31, 2021 Net interest margin (FTE) in line with expectations 9 bp decrease from fourth quarter driven by lower loan fees Net interest margin, excluding loan fees and loan accretion, increased 5 bp compared to the linked quarter Strong fee income, despite seasonal headwinds Adjusted1 noninterest income of $40.2 million Mortgage banking revenue remained elevated at $9.5 million, despite expected seasonal declines and lower premiums Foreign exchange income of $10.8 million; slight decline from record fourth quarter Core expenses declined $4.6 million from the linked quarter, driven by decline in incentive compensation and lower professional services expenses Adjusted1 noninterest expense of $90.0 million; Adjusted1 for $1.3 million in severance costs and $1.3 million of other non-recurring costs Efficiency ratio of 60.0%; 58.4% as adjusted1 Allowance for credit loss (ACL) and provision expense declined compared to linked quarter Loans and leases - ACL of $169.9 million; 1.71% of total loans, 1.84% excluding PPP; $3.5 million provision expense Unfunded Commitments - ACL of $13.0 million; $0.5 million provision expense Lower provision expense driven by improved credit outlook, partially offset by a large charge-off on a single relationship Effective tax rate of 18.0% positively impacted by higher tax-exempt income; 18.4% as adjusted1 Strong capital ratios Total capital of 15.41%; Tier 1 common equity of 11.81%; Tangible common equity of 8.22% Tangible book value decreased by $0.15 to $12.78 Tangible common equity of 8.62% excluding PPP 840,115 shares repurchased in first quarter 1 Non-GAAP financial measure which management believes facilitates a better understanding of the Company’s financial condition. See Appendix for Non-GAAP reconciliations. 15
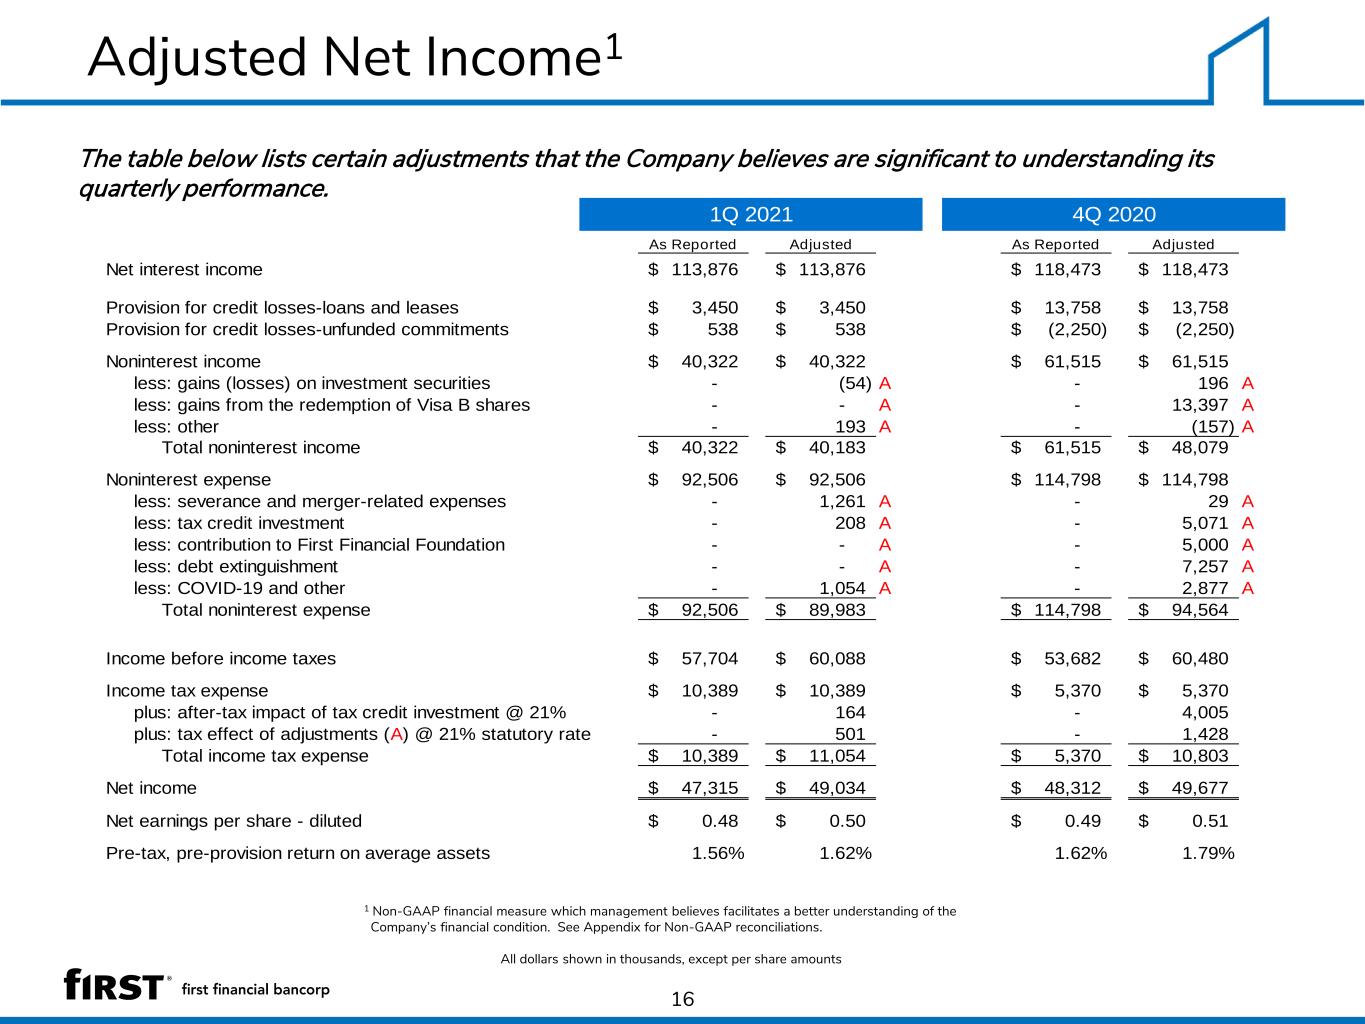
Adjusted Net Income1 16 The table below lists certain adjustments that the Company believes are significant to understanding its quarterly performance. 1 Non-GAAP financial measure which management believes facilitates a better understanding of the Company’s financial condition. See Appendix for Non-GAAP reconciliations. All dollars shown in thousands, except per share amounts As Reported Adjusted As Reported Adjusted Net interest income 113,876$ 113,876$ 118,473$ 118,473$ Provision for credit losses-loans and leases 3,450$ 3,450$ 13,758$ 13,758$ Provision for credit losses-unfunded commitments 538$ 538$ (2,250)$ (2,250)$ Noninterest income 40,322$ 40,322$ 61,515$ 61,515$ less: gains (losses) on investment securities - (54) A - 196 A - - A - 13,397 A less: other - 193 A - (157) A Total noninterest income 40,322$ 40,183$ 61,515$ 48,079$ Noninterest expense 92,506$ 92,506$ 114,798$ 114,798$ less: severance and merger-related expenses - 1,261 A - 29 A less: tax credit investment - 208 A - 5,071 A less: contribution to First Financial Foundation - - A - 5,000 A less: debt extinguishment - - A - 7,257 A less: COVID-19 and other - 1,054 A - 2,877 A Total noninterest expense 92,506$ 89,983$ 114,798$ 94,564$ Income before income taxes 57,704$ 60,088$ 53,682$ 60,480$ Income tax expense 10,389$ 10,389$ 5,370$ 5,370$ plus: after-tax impact of tax credit investment @ 21% - 164 - 4,005 plus: tax effect of adjustments (A) @ 21% statutory rate - 501 - 1,428 Total income tax expense 10,389$ 11,054$ 5,370$ 10,803$ Net income 47,315$ 49,034$ 48,312$ 49,677$ Net earnings per share - diluted 0.48$ 0.50$ 0.49$ 0.51$ Pre-tax, pre-provision return on average assets 1.56% 1.62% 1.62% 1.79% 1Q 2021 4Q 2020 less: gains from the redemption of Visa B shares
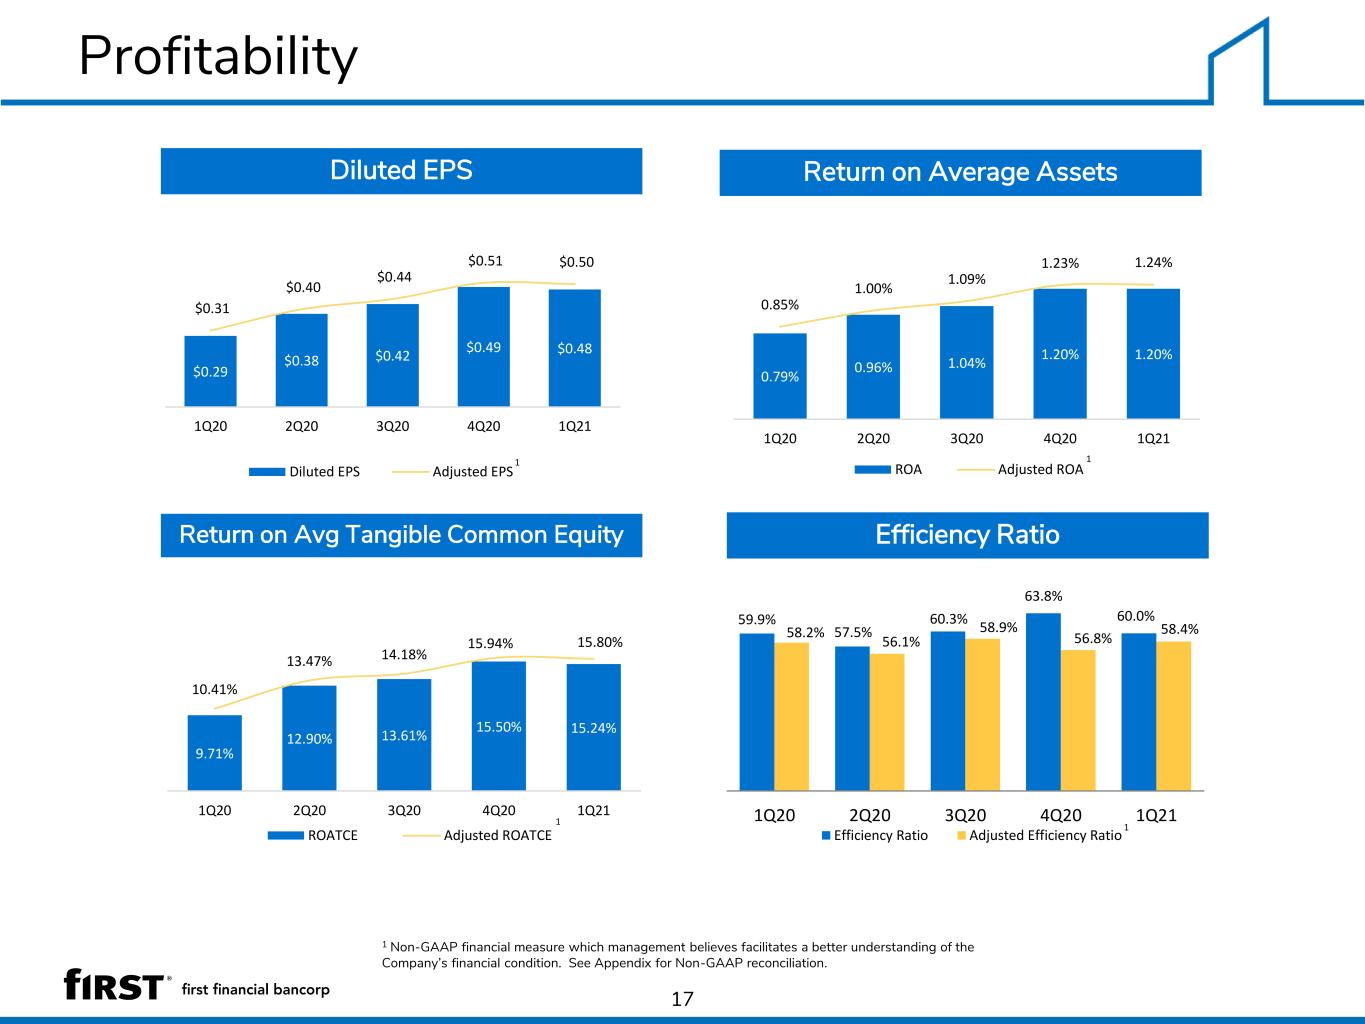
Profitability 17 Return on Average Assets Return on Avg Tangible Common Equity Diluted EPS 1 Non-GAAP financial measure which management believes facilitates a better understanding of the Company’s financial condition. See Appendix for Non-GAAP reconciliation. Efficiency Ratio $0.48$0.49 $0.42$0.38 $0.29 $0.50 $0.51 $0.44 $0.40 $0.31 1Q214Q203Q202Q201Q20 Diluted EPS Adjusted EPS 1 1.20%1.20% 1.04%0.96% 0.79% 1.24%1.23% 1.09% 1.00% 0.85% 1Q214Q203Q202Q201Q20 ROA Adjusted ROA 1 15.24%15.50% 13.61%12.90% 9.71% 15.80%15.94% 14.18%13.47% 10.41% 1Q214Q203Q202Q201Q20 ROATCE Adjusted ROATCE 1 59.9% 57.5% 60.3% 63.8% 60.0% 58.2% 56.1% 58.9% 56.8% 58.4% 1Q20 2Q20 3Q20 4Q20 1Q21 Efficiency Ratio Adjusted Efficiency Ratio 1
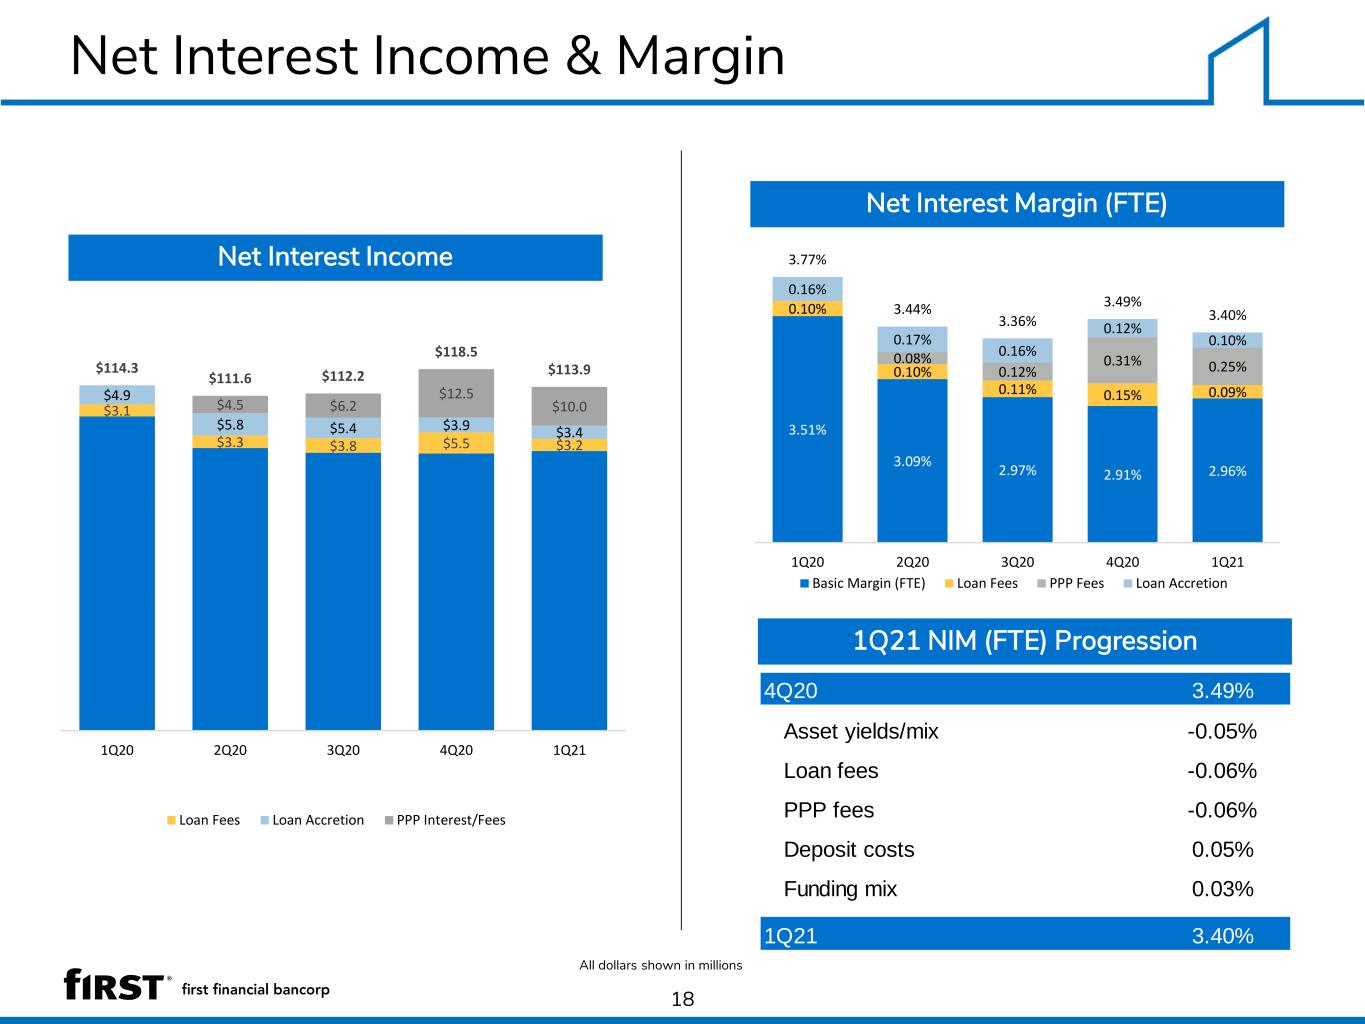
Net Interest Income & Margin 18 Net Interest Margin (FTE) 1Q21 NIM (FTE) Progression Net Interest Income All dollars shown in millions 4Q20 3.49% Asset yields/mix -0.05% Loan fees -0.06% PPP fees -0.06% Deposit costs 0.05% Funding mix 0.03% 1Q21 3.40% $3.2$5.5$3.8$3.3 $3.1 $3.4 $3.9$5.4$5.8 $4.9 $10.0 $12.5 $6.2$4.5 $113.9 $118.5 $112.2$111.6 $114.3 1Q214Q203Q202Q201Q20 Loan Fees Loan Accretion PPP Interest/Fees 2.96%2.91%2.97% 3.09% 3.51% 0.09%0.15%0.11% 0.10% 0.10% 0.25%0.31%0.12% 0.08% 0.10% 0.12% 0.16% 0.17% 0.16% 3.40% 3.49% 3.36% 3.44% 3.77% 1Q214Q203Q202Q201Q20 Basic Margin (FTE) Loan Fees PPP Fees Loan Accretion
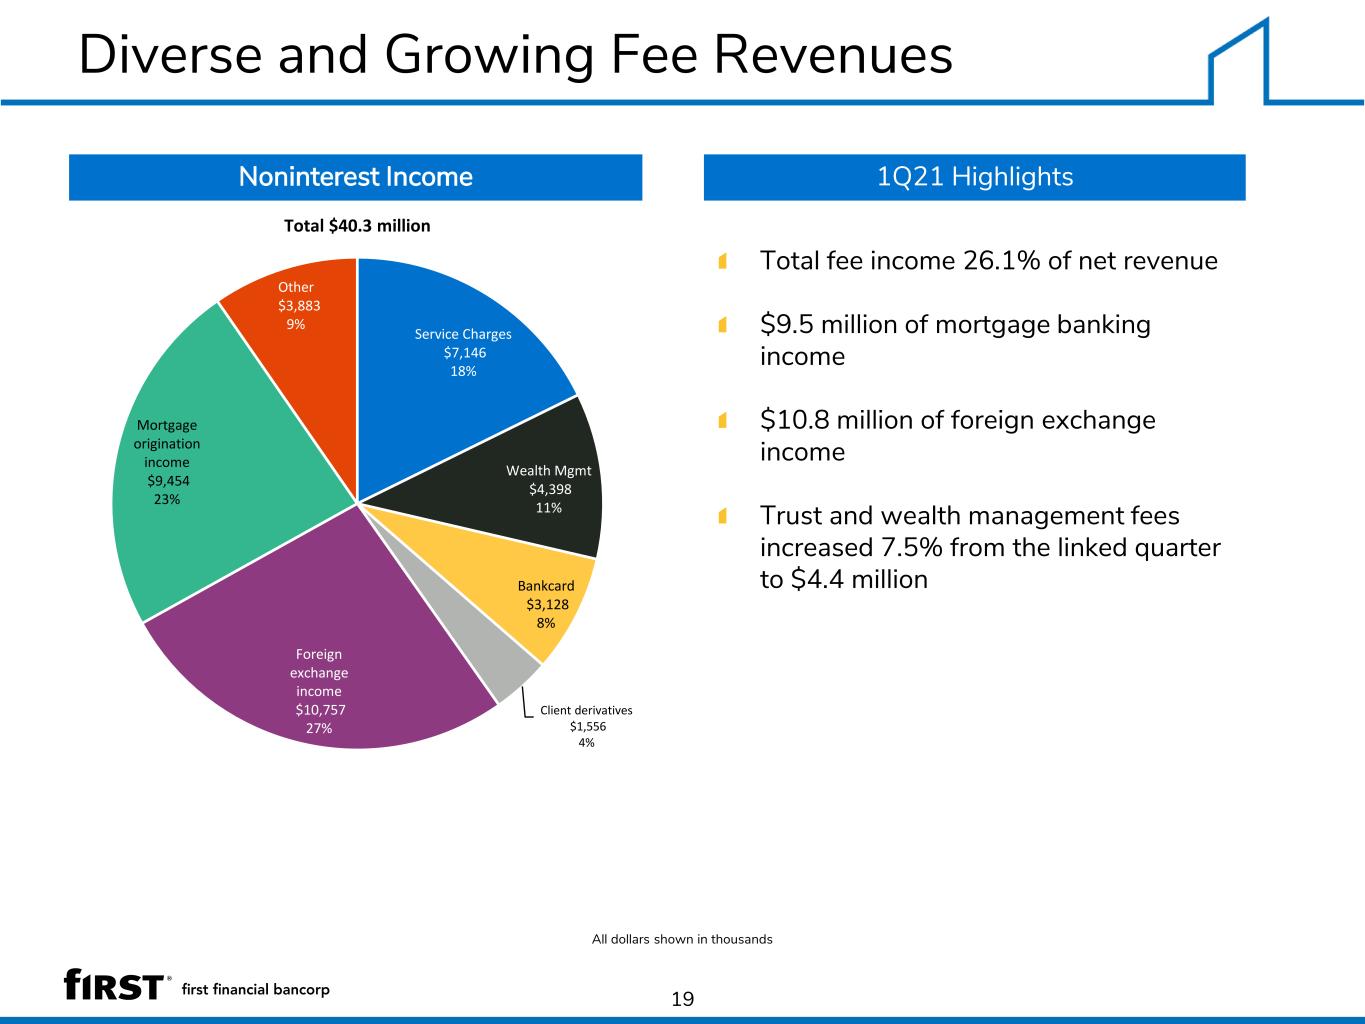
Diverse and Growing Fee Revenues 19 Noninterest Income 1Q21 Highlights All dollars shown in thousands Total fee income 26.1% of net revenue $9.5 million of mortgage banking income $10.8 million of foreign exchange income Trust and wealth management fees increased 7.5% from the linked quarter to $4.4 million Service Charges $7,146 18% Wealth Mgmt $4,398 11% Bankcard $3,128 8% Client derivatives $1,556 4% Foreign exchange income $10,757 27% Mortgage origination income $9,454 23% Gains from redemption of Visa B shares $- 0% Other $3,883 9% Total $40.3 million
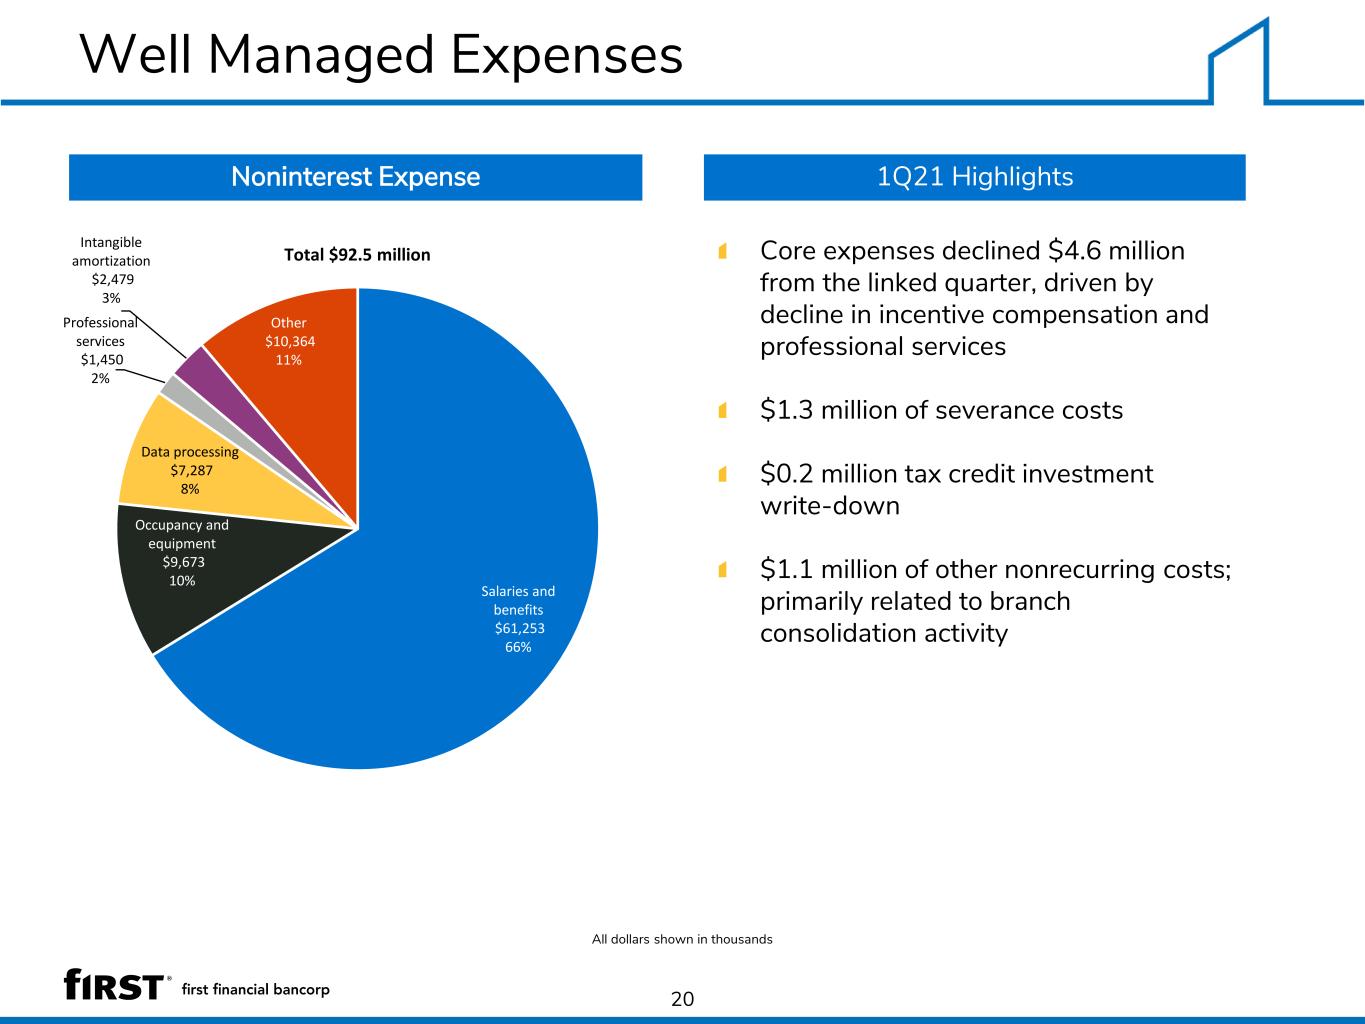
Well Managed Expenses 20 Noninterest Expense 1Q21 Highlights All dollars shown in thousands Core expenses declined $4.6 million from the linked quarter, driven by decline in incentive compensation and professional services $1.3 million of severance costs $0.2 million tax credit investment write-down $1.1 million of other nonrecurring costs; primarily related to branch consolidation activity Salaries and benefits $61,253 66% Occupancy and equipment $9,673 10% Data processing $7,287 8% Professional services $1,450 2% Intangible amortization $2,479 3% Other $10,364 11% Total $92.5 million
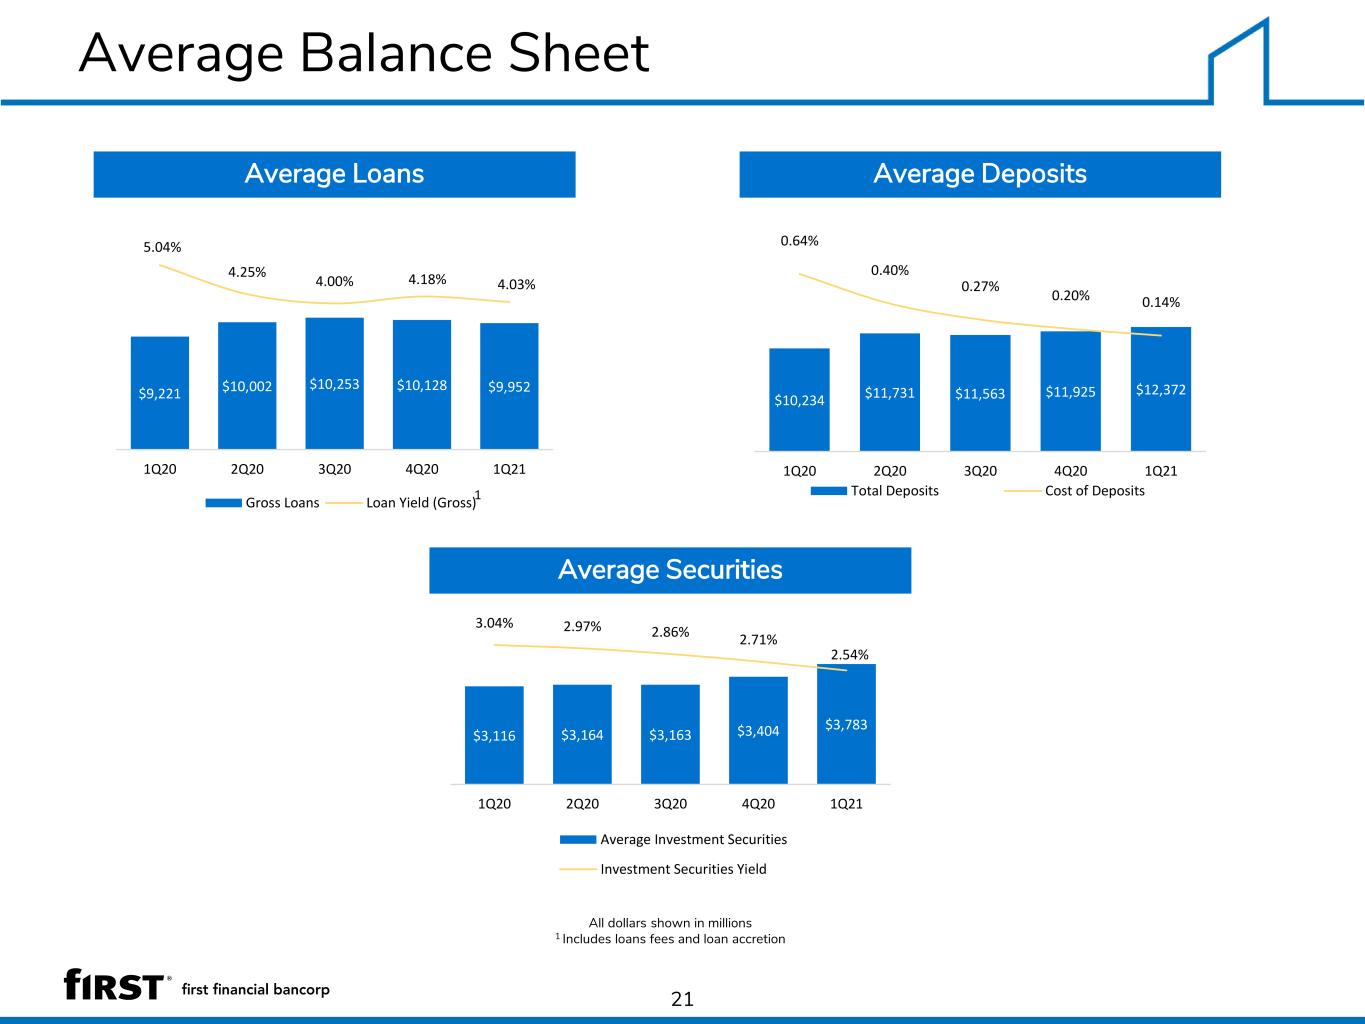
Average Balance Sheet 21 Average Loans Average Securities Average Deposits All dollars shown in millions 1 Includes loans fees and loan accretion $9,952$10,128$10,253$10,002$9,221 4.03%4.18%4.00% 4.25% 5.04% 1Q214Q203Q202Q201Q20 Gross Loans Loan Yield (Gross) 1 $12,372$11,925$11,563$11,731$10,234 0.14%0.20% 0.27% 0.40% 0.64% 1Q214Q203Q202Q201Q20 Total Deposits Cost of Deposits $3,783$3,404$3,163$3,164$3,116 2.54% 2.71% 2.86%2.97% 3.04% 1Q214Q203Q202Q201Q20 Average Investment Securities Investment Securities Yield
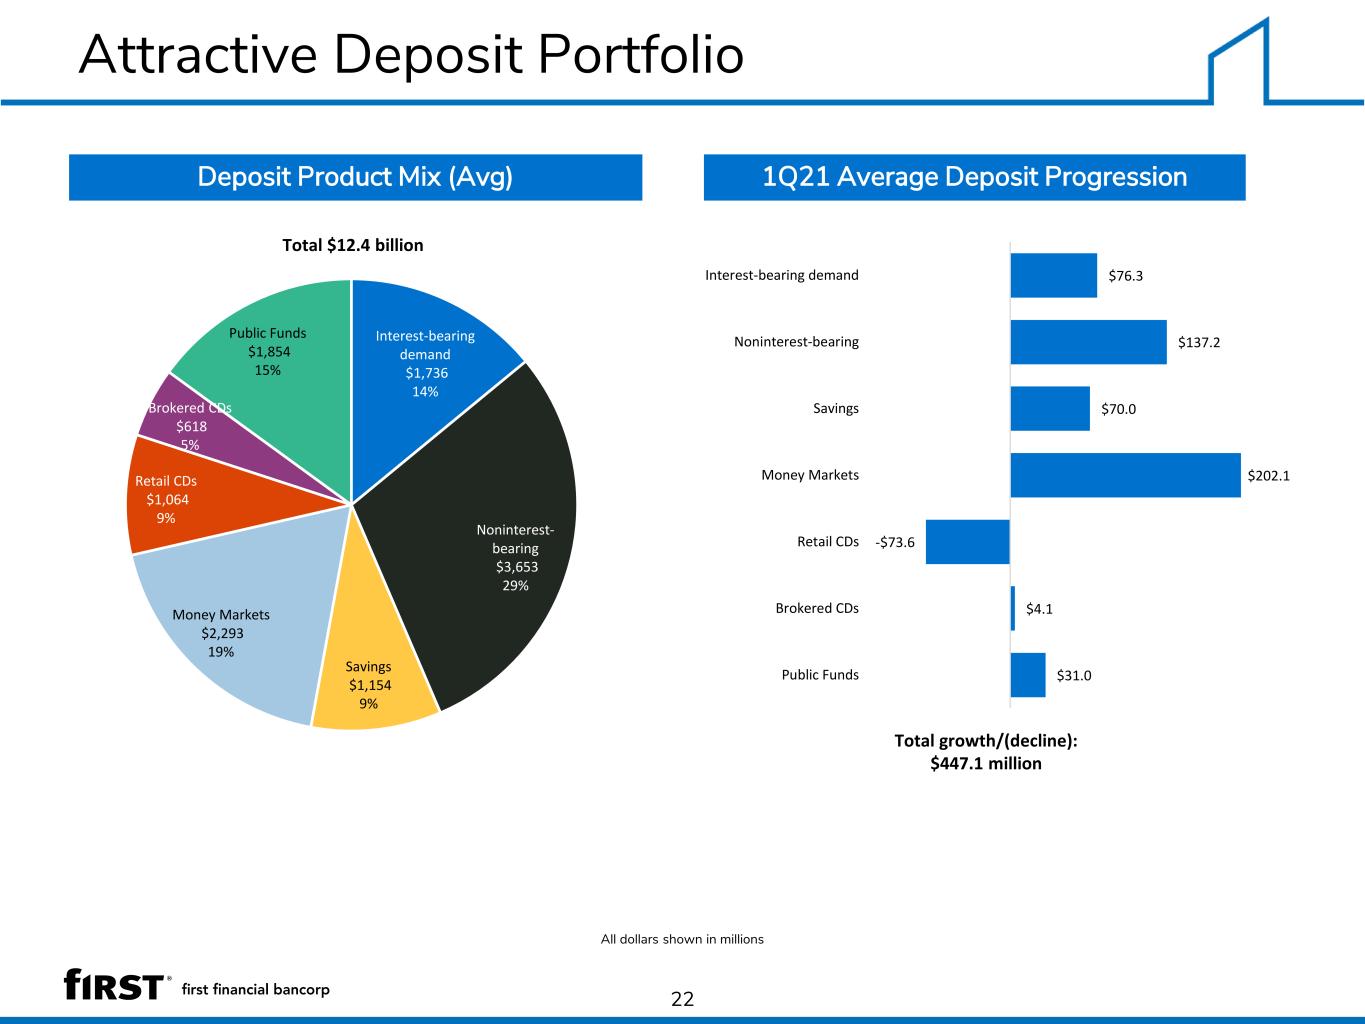
Attractive Deposit Portfolio 22 Deposit Product Mix (Avg) 1Q21 Average Deposit Progression All dollars shown in millions Total growth/(decline): $447.1 million $76.3 $137.2 $70.0 $202.1 -$73.6 $4.1 $31.0 Interest-bearing demand Noninterest-bearing Savings Money Markets Retail CDs Brokered CDs Public Funds Interest-bearing demand $1,736 14% Noninterest- bearing $3,653 29% Savings $1,154 9% Money Markets $2,293 19% Retail CDs $1,064 9% Brokered CDs $618 5% Public Funds $1,854 15% Total $12.4 billion
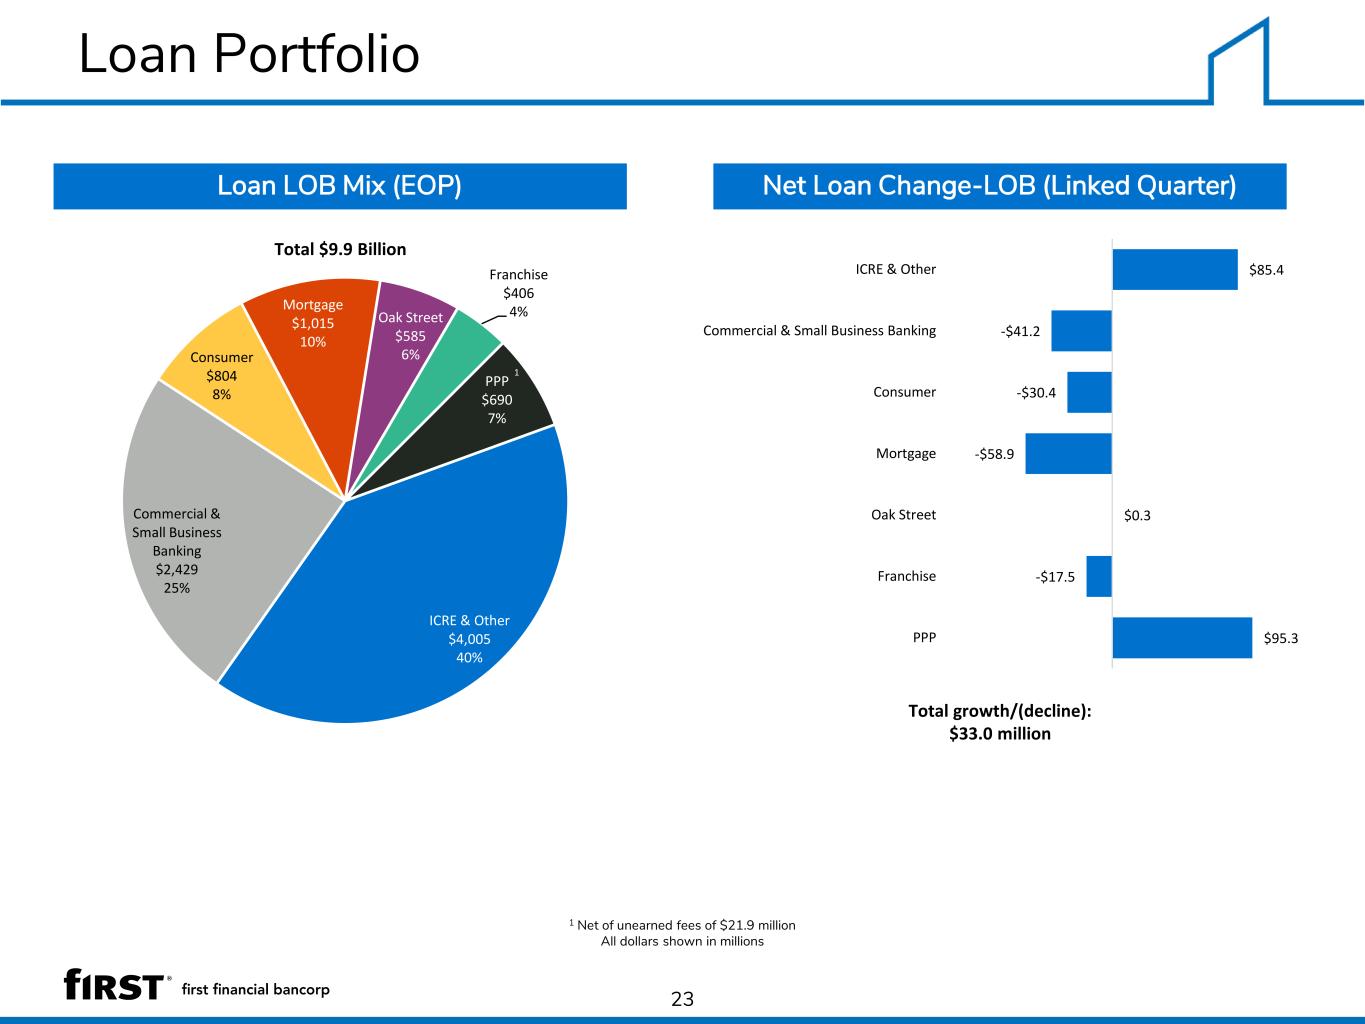
Loan Portfolio 23 Loan LOB Mix (EOP) Net Loan Change-LOB (Linked Quarter) 1 Net of unearned fees of $21.9 million All dollars shown in millions Total growth/(decline): $33.0 million ICRE & Other $4,005 40% Commercial & Small Business Banking $2,429 25% Consumer $804 8% Mortgage $1,015 10% Oak Street $585 6% Franchise $406 4% PPP $690 7% Total $9.9 Billion 1 $85.4 -$41.2 -$30.4 -$58.9 $0.3 -$17.5 $95.3 ICRE & Other Commercial & Small Business Banking Consumer Mortgage Oak Street Franchise PPP
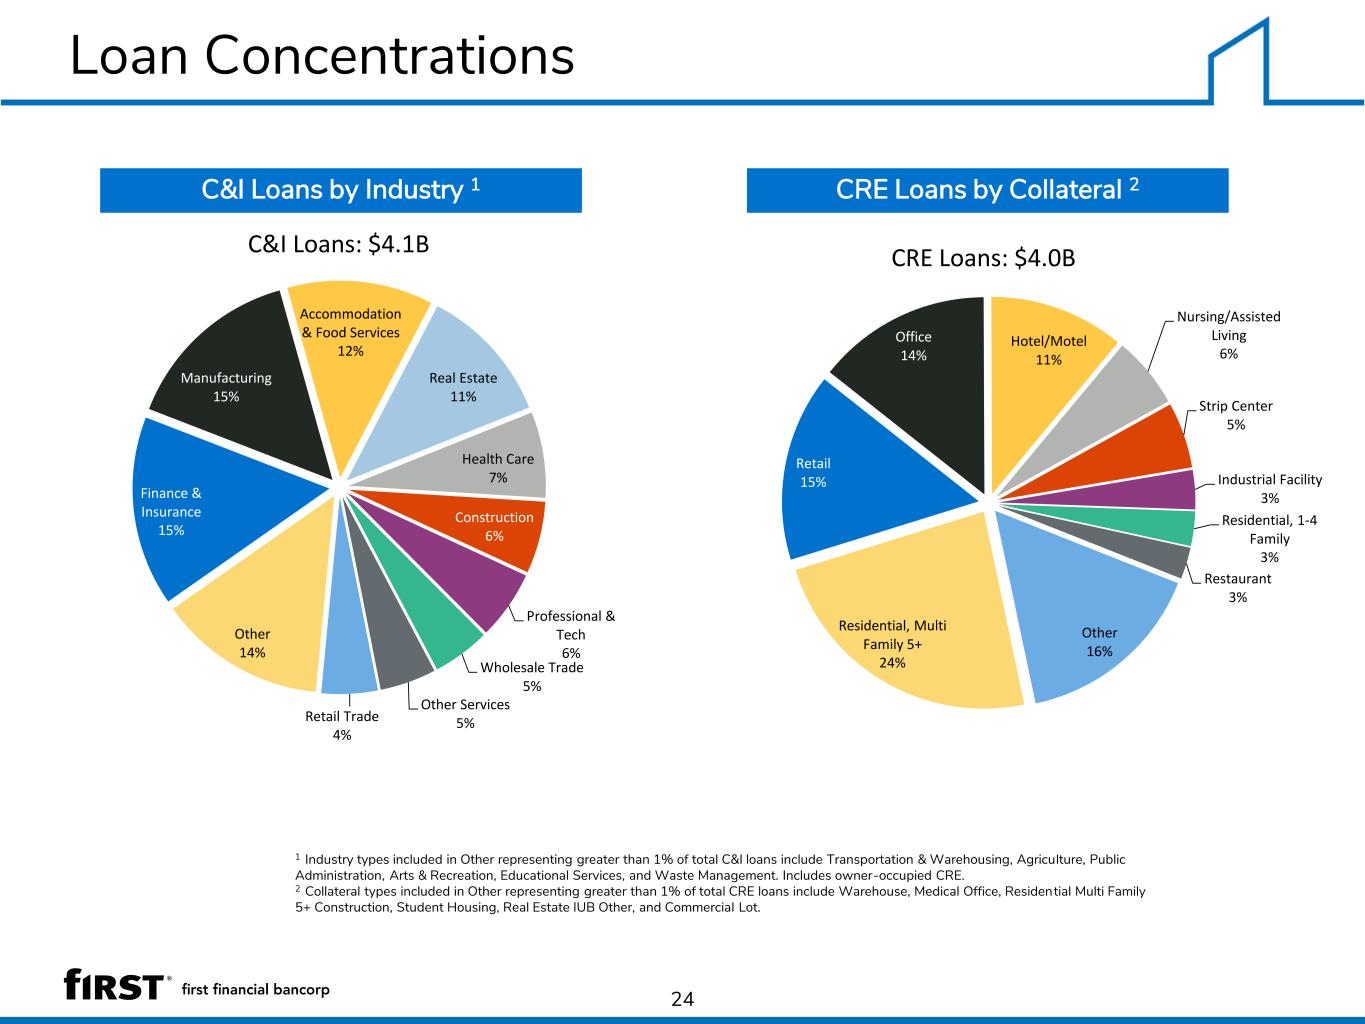
Loan Concentrations 24 C&I Loans by Industry 1 CRE Loans by Collateral 2 1 Industry types included in Other representing greater than 1% of total C&I loans include Transportation & Warehousing, Agriculture, Public Administration, Arts & Recreation, Educational Services, and Waste Management. Includes owner-occupied CRE. 2 Collateral types included in Other representing greater than 1% of total CRE loans include Warehouse, Medical Office, Residential Multi Family 5+ Construction, Student Housing, Real Estate IUB Other, and Commercial Lot. Finance & Insurance 15% Manufacturing 15% Accommodation & Food Services 12% Real Estate 11% Health Care 7% Construction 6% Professional & Tech 6% Wholesale Trade 5% Other Services 5%Retail Trade 4% Other 14% C&I Loans: $4.1B Residential, Multi Family 5+ 24% Retail 15% Office 14% Hotel/Motel 11% Nursing/Assisted Living 6% Strip Center 5% Industrial Facility 3% Residential, 1-4 Family 3% Restaurant 3% Other 16% CRE Loans: $4.0B
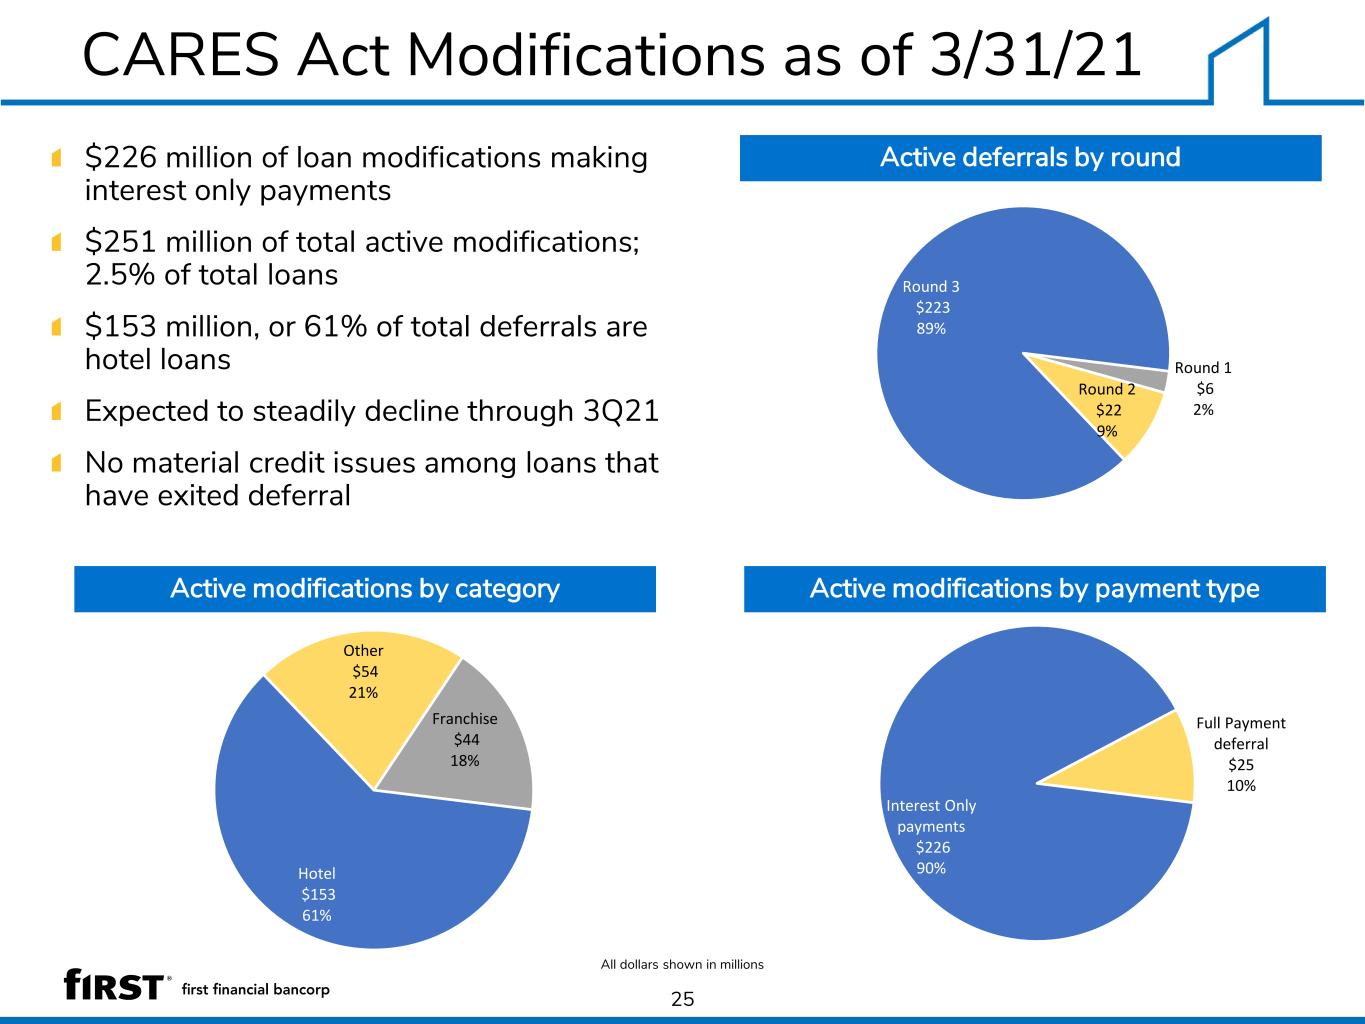
CARES Act Modifications as of 3/31/21 $226 million of loan modifications making interest only payments $251 million of total active modifications; 2.5% of total loans $153 million, or 61% of total deferrals are hotel loans Expected to steadily decline through 3Q21 No material credit issues among loans that have exited deferral 25 All dollars shown in millions Active deferrals by round Active modifications by payment typeActive modifications by category Hotel $153 61% Other $54 21% Franchise $44 18% Round 1 $6 2% Round 2 $22 9% Round 3 $223 89% Interest Only payments $226 90% Full Payment deferral $25 10%
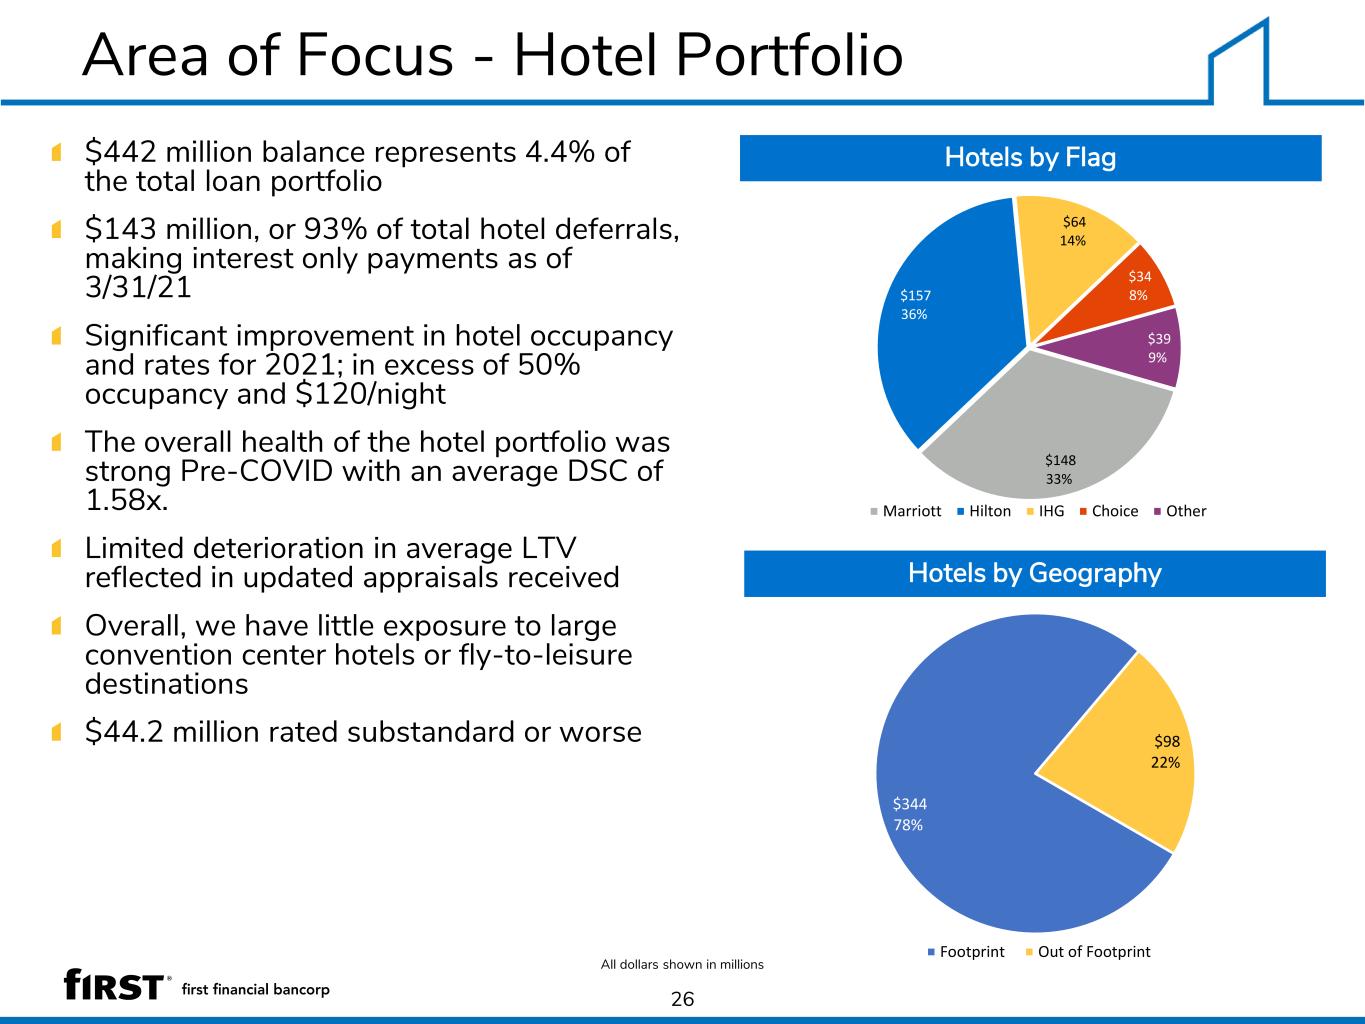
Area of Focus - Hotel Portfolio $442 million balance represents 4.4% of the total loan portfolio $143 million, or 93% of total hotel deferrals, making interest only payments as of 3/31/21 Significant improvement in hotel occupancy and rates for 2021; in excess of 50% occupancy and $120/night The overall health of the hotel portfolio was strong Pre-COVID with an average DSC of 1.58x. Limited deterioration in average LTV reflected in updated appraisals received Overall, we have little exposure to large convention center hotels or fly-to-leisure destinations $44.2 million rated substandard or worse 26 All dollars shown in millions Hotels by Flag Hotels by Geography $148 33% $157 36% $64 14% $34 8% $39 9% Marriott Hilton IHG Choice Other $344 78% $98 22% Footprint Out of Footprint
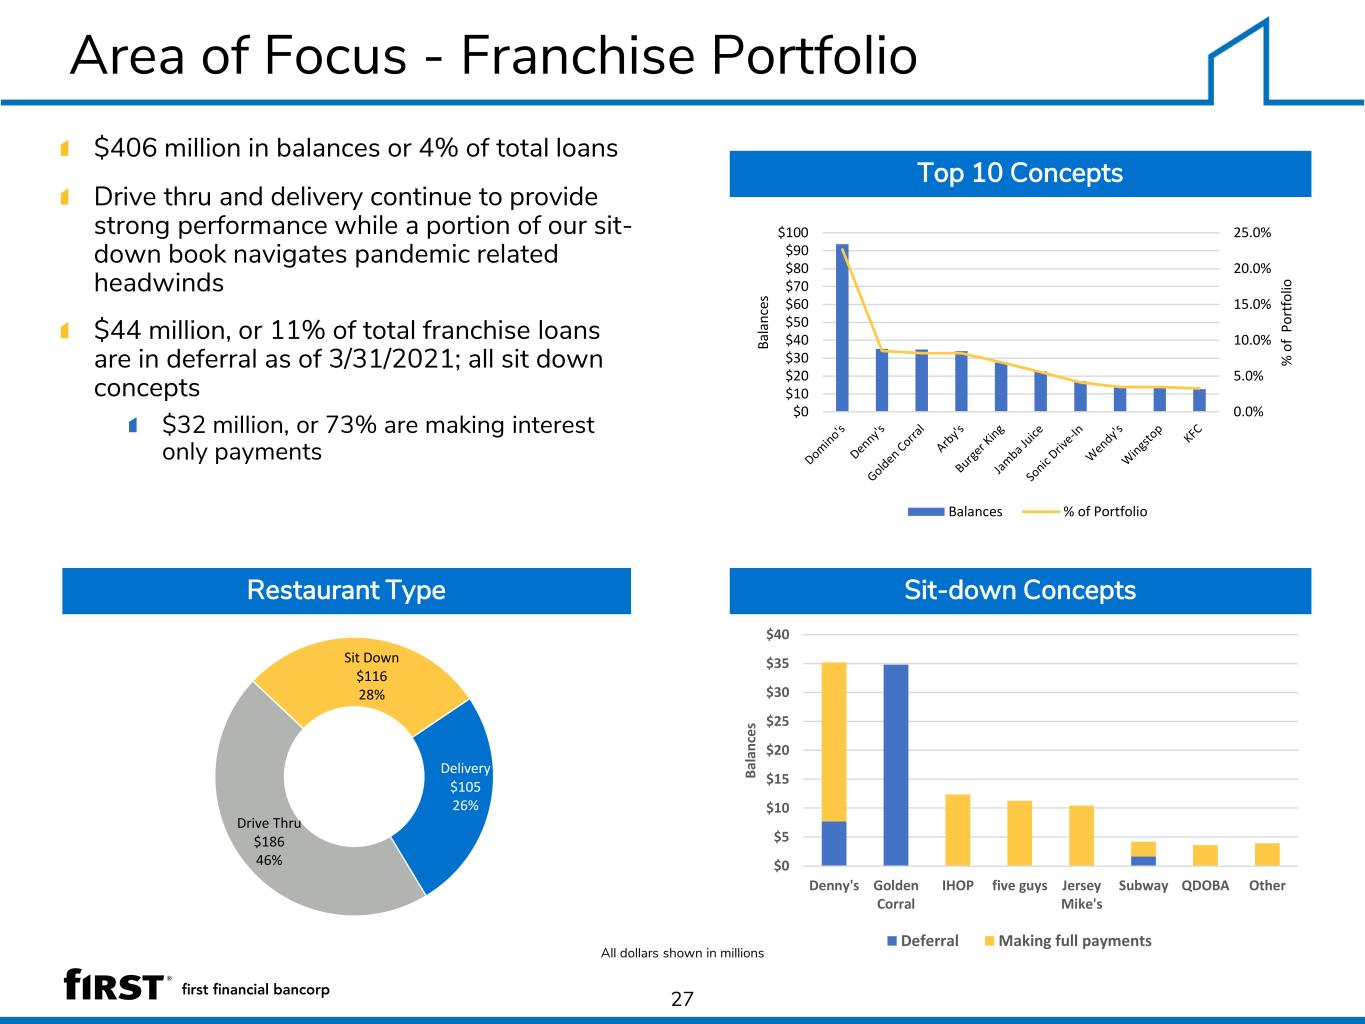
Area of Focus - Franchise Portfolio $406 million in balances or 4% of total loans Drive thru and delivery continue to provide strong performance while a portion of our sit- down book navigates pandemic related headwinds $44 million, or 11% of total franchise loans are in deferral as of 3/31/2021; all sit down concepts $32 million, or 73% are making interest only payments 27 Top 10 Concepts Sit-down ConceptsRestaurant Type All dollars shown in millions 0.0% 5.0% 10.0% 15.0% 20.0% 25.0% $0 $10 $20 $30 $40 $50 $60 $70 $80 $90 $100 % o f P o rt fo lio B a la n ce s Balances % of Portfolio Delivery $105 26% Drive Thru $186 46% Sit Down $116 28% $0 $5 $10 $15 $20 $25 $30 $35 $40 Denny's Golden Corral IHOP five guys Jersey Mike's Subway QDOBA Other B a la n ce s Deferral Making full payments
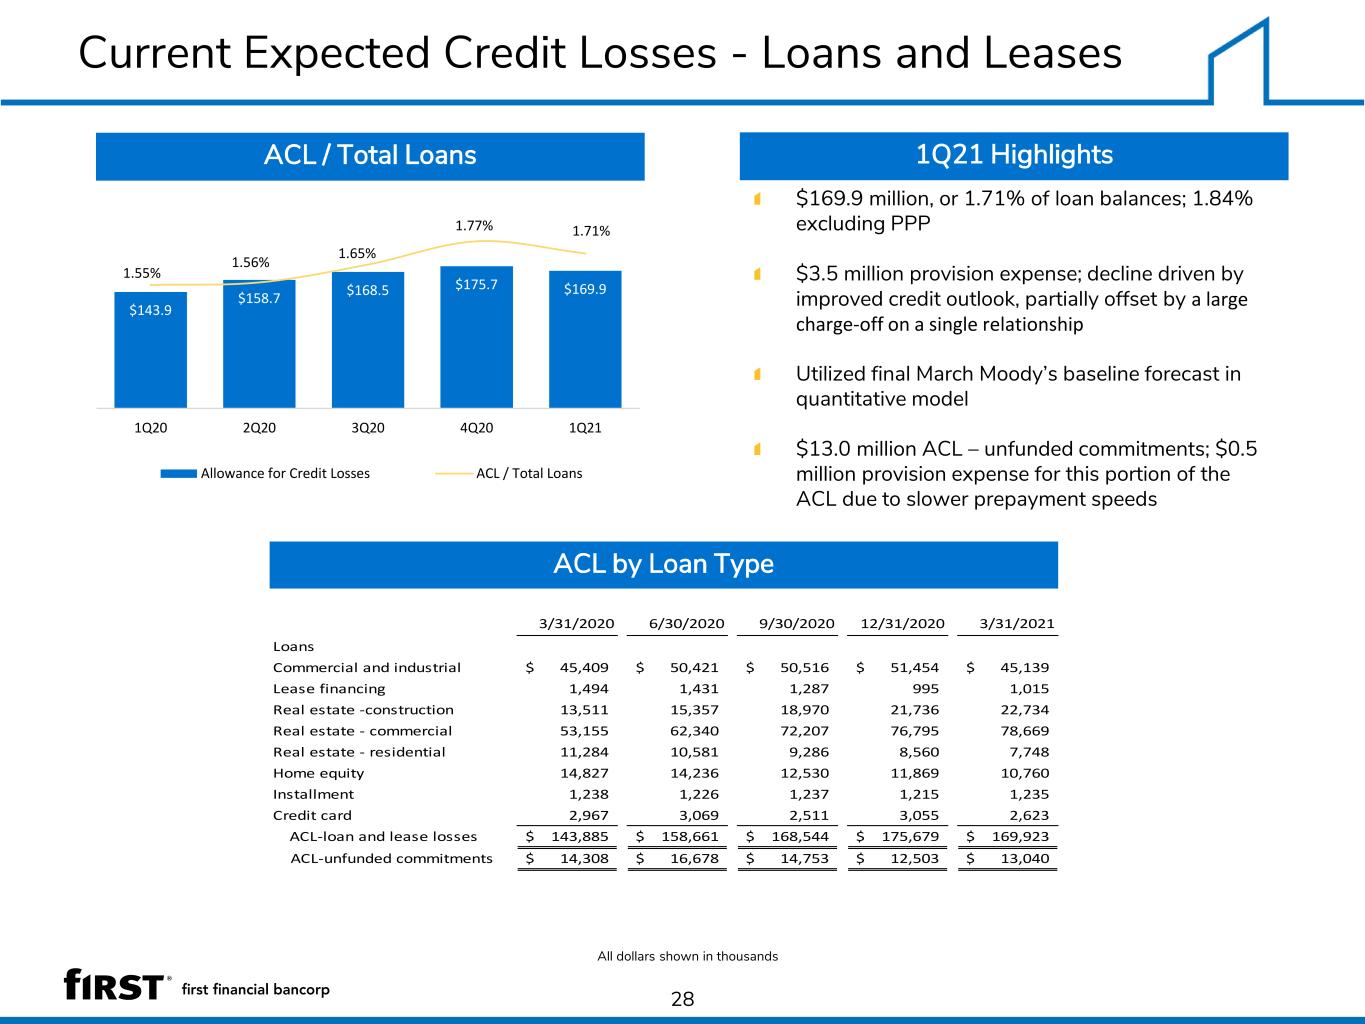
Current Expected Credit Losses - Loans and Leases 28 ACL / Total Loans 1Q21 Highlights All dollars shown in thousands $169.9 million, or 1.71% of loan balances; 1.84% excluding PPP $3.5 million provision expense; decline driven by improved credit outlook, partially offset by a large charge-off on a single relationship Utilized final March Moody’s baseline forecast in quantitative model $13.0 million ACL – unfunded commitments; $0.5 million provision expense for this portion of the ACL due to slower prepayment speeds ACL by Loan Type 1 $169.9$175.7$168.5 $158.7 $143.9 1.71%1.77% 1.65% 1.56% 1.55% 1Q214Q203Q202Q201Q20 Allowance for Credit Losses ACL / Total Loans 3/31/2020 6/30/2020 9/30/2020 12/31/2020 3/31/2021 Loans Commercial and industrial 45,409$ 50,421$ 50,516$ 51,454$ 45,139$ Lease financing 1,494 1,431 1,287 995 1,015 Real estate -construction 13,511 15,357 18,970 21,736 22,734 Real estate - commercial 53,155 62,340 72,207 76,795 78,669 Real estate - residential 11,284 10,581 9,286 8,560 7,748 Home equity 14,827 14,236 12,530 11,869 10,760 Installment 1,238 1,226 1,237 1,215 1,235 Credit card 2,967 3,069 2,511 3,055 2,623 ACL-loan and lease losses 143,885$ 158,661$ 168,544$ 175,679$ 169,923$ ACL-unfunded commitments 14,308$ 16,678$ 14,753$ 12,503$ 13,040$
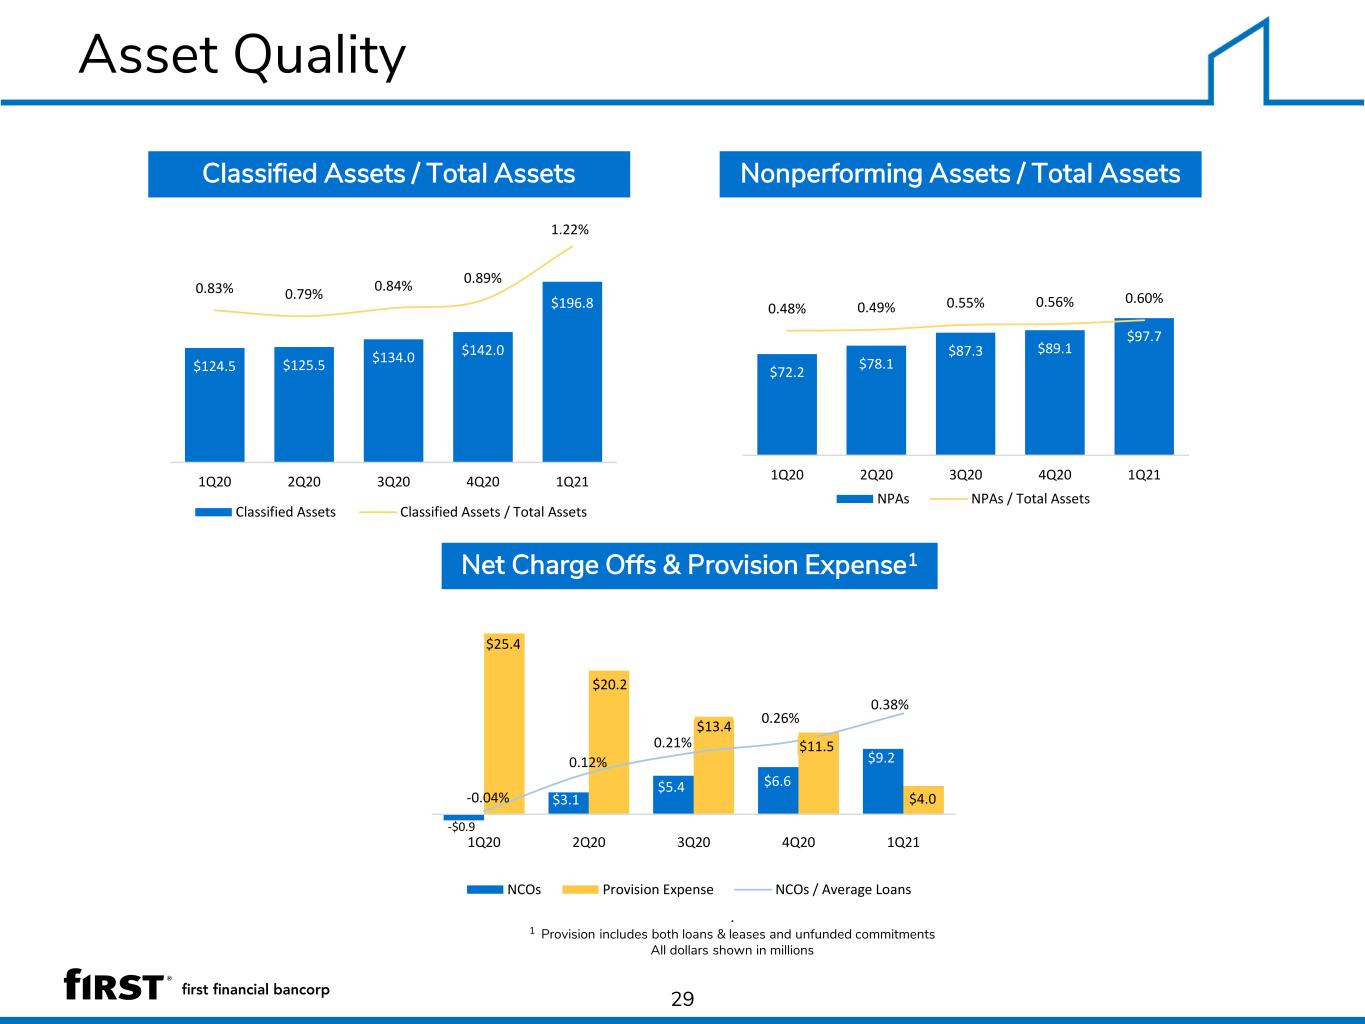
Asset Quality 29 Nonperforming Assets / Total AssetsClassified Assets / Total Assets Net Charge Offs & Provision Expense1 . 1 Provision includes both loans & leases and unfunded commitments All dollars shown in millions 1 1 $196.8 $142.0 $134.0 $125.5$124.5 1.22% 0.89% 0.84% 0.79%0.83% 1Q214Q203Q202Q201Q20 Classified Assets Classified Assets / Total Assets $97.7 $89.1$87.3 $78.1 $72.2 0.60%0.56%0.55%0.49%0.48% 1Q214Q203Q202Q201Q20 NPAs NPAs / Total Assets -$0.9 $3.1 $5.4 $6.6 $9.2 $25.4 $20.2 $13.4 $11.5 $4.0 0.38% 0.26% 0.21% 0.12% -0.04% 1Q20 2Q20 3Q20 4Q20 1Q21 NCOs Provision Expense NCOs / Average Loans
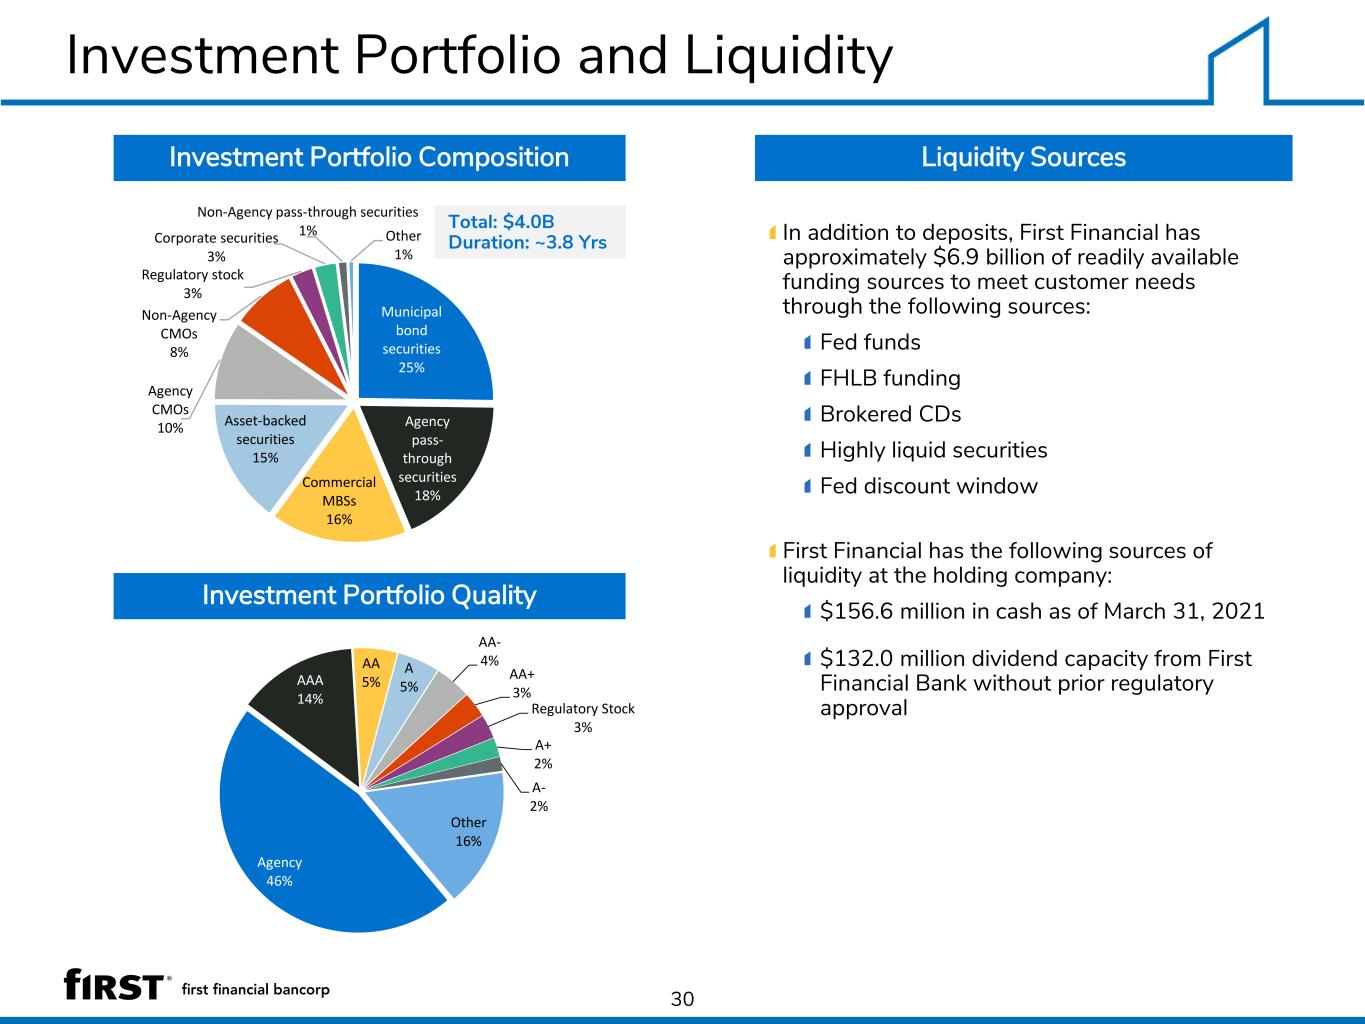
30 Investment Portfolio Composition Investment Portfolio Quality Total: $4.0B Duration: ~3.8 Yrs Liquidity Sources In addition to deposits, First Financial has approximately $6.9 billion of readily available funding sources to meet customer needs through the following sources: Fed funds FHLB funding Brokered CDs Highly liquid securities Fed discount window First Financial has the following sources of liquidity at the holding company: $156.6 million in cash as of March 31, 2021 $132.0 million dividend capacity from First Financial Bank without prior regulatory approval Investment Portfolio and Liquidity Municipal bond securities 25% Agency pass- through securities 18% Commercial MBSs 16% Asset-backed securities 15% Agency CMOs 10% Non-Agency CMOs 8% Regulatory stock 3% Corporate securities 3% Non-Agency pass-through securities 1% Other 1% Agency 46% AAA 14% AA 5% A 5% AA- 4% AA+ 3% Regulatory Stock 3% A+ 2% A- 2% Other 16%
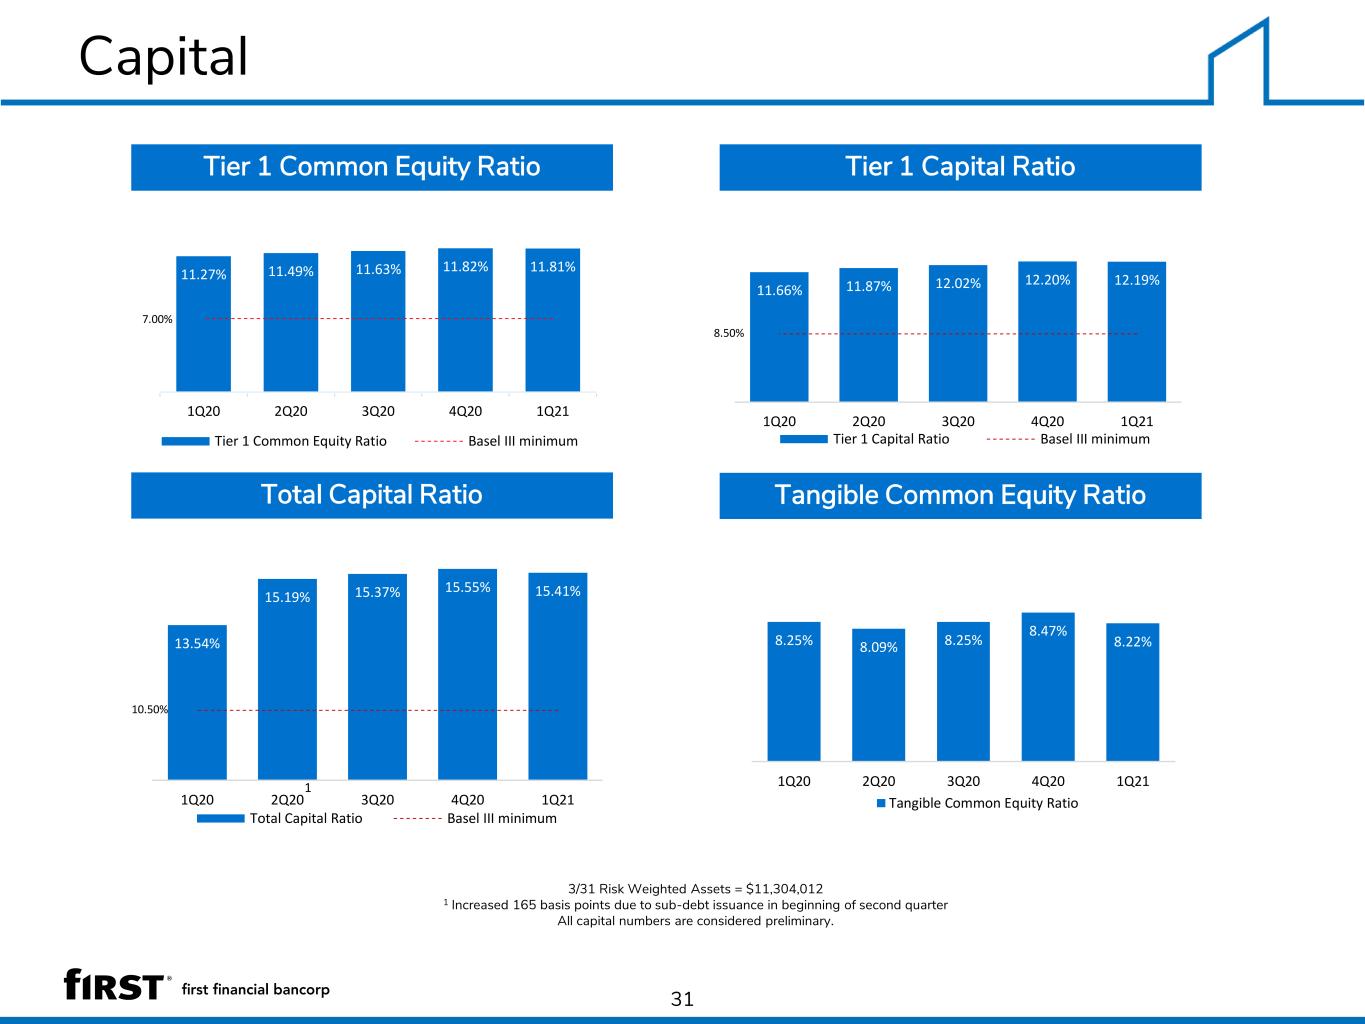
Capital 31 Tier 1 Common Equity Ratio Total Capital Ratio Tangible Common Equity Ratio 3/31 Risk Weighted Assets = $11,304,012 1 Increased 165 basis points due to sub-debt issuance in beginning of second quarter All capital numbers are considered preliminary. Tier 1 Capital Ratio 2 2 1 8.22% 8.47% 8.25% 8.09% 8.25% 1Q214Q203Q202Q201Q20 Tangible Common Equity Ratio 12.19%12.20%12.02%11.87%11.66% 8.50% 1Q214Q203Q202Q201Q20 Tier 1 Capital Ratio Basel III minimum 15.41%15.55%15.37%15.19% 13.54% 10.50% 1Q214Q203Q202Q201Q20 Total Capital Ratio Basel III minimum 1 11.81%11.82%11.63%11.49%11.27% 7.00% 1Q214Q203Q202Q201Q20 Tier 1 Common Equity Ratio Basel III minimum
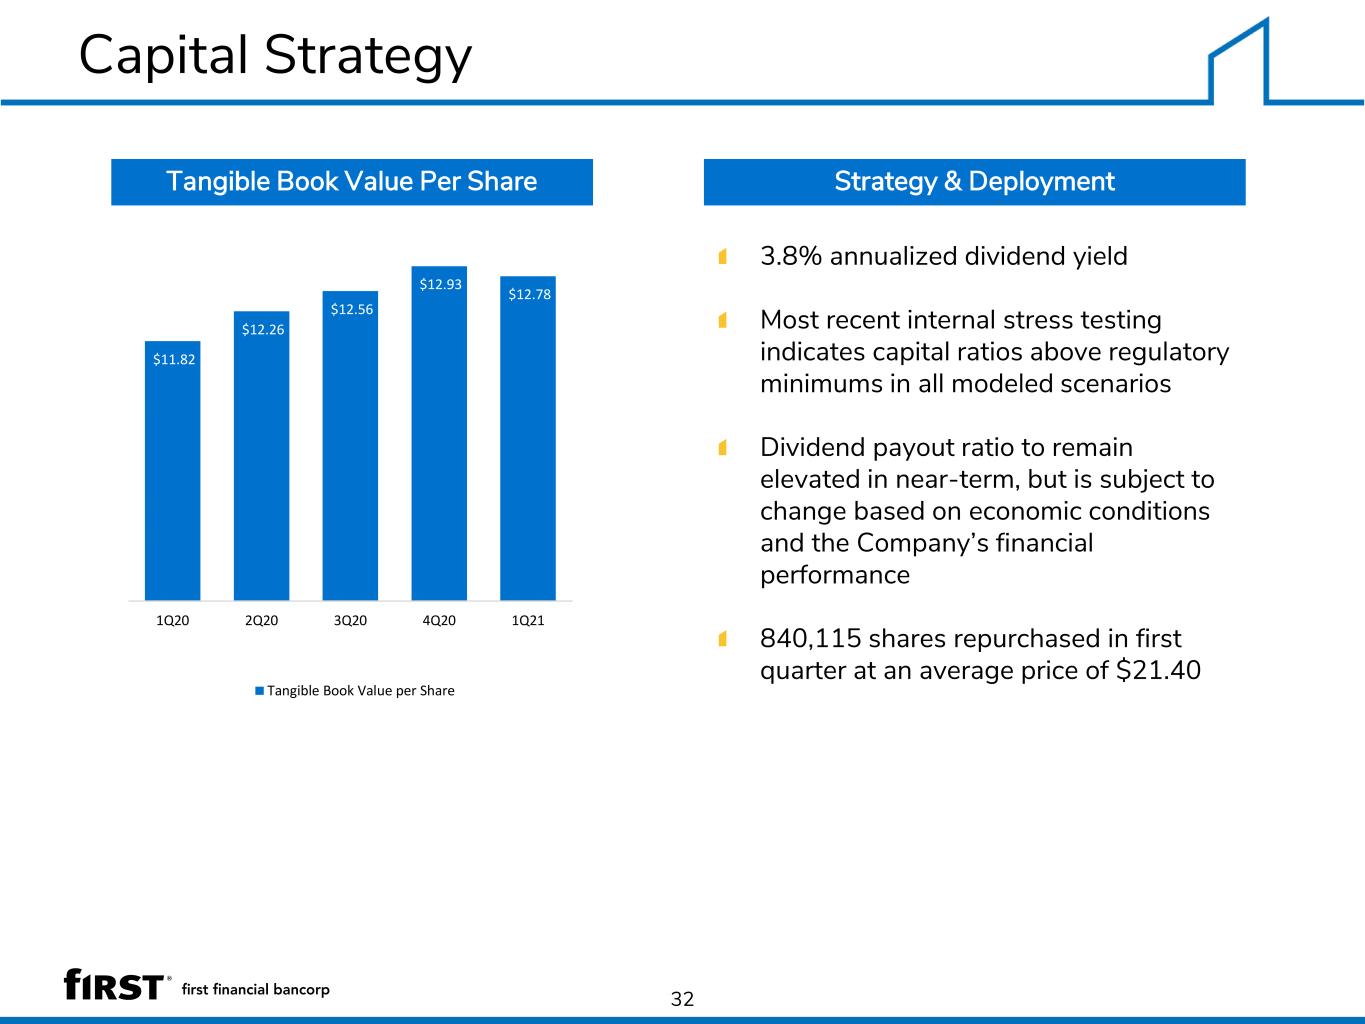
Capital Strategy 32 Strategy & DeploymentTangible Book Value Per Share 3.8% annualized dividend yield Most recent internal stress testing indicates capital ratios above regulatory minimums in all modeled scenarios Dividend payout ratio to remain elevated in near-term, but is subject to change based on economic conditions and the Company’s financial performance 840,115 shares repurchased in first quarter at an average price of $21.401 1 $12.78 $12.93 $12.56 $12.26 $11.82 1Q214Q203Q202Q201Q20 Tangible Book Value per Share
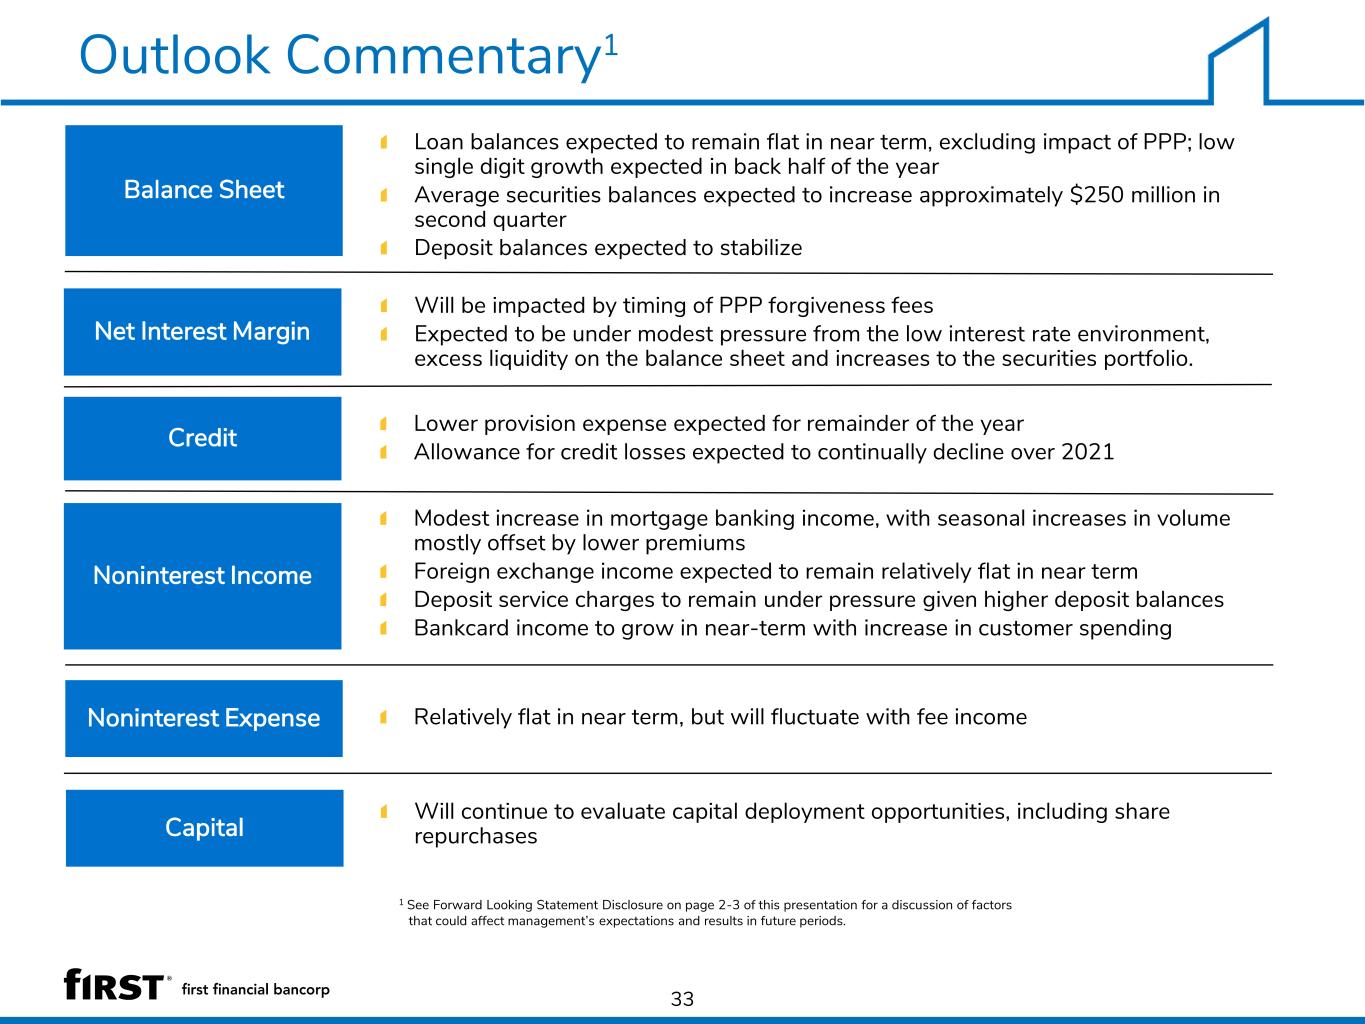
Outlook Commentary1 Loan balances expected to remain flat in near term, excluding impact of PPP; low single digit growth expected in back half of the year Average securities balances expected to increase approximately $250 million in second quarter Deposit balances expected to stabilize 33 Relatively flat in near term, but will fluctuate with fee incomeNoninterest Expense Net Interest Margin Balance Sheet Credit Lower provision expense expected for remainder of the yearAllowance for credit losses expected to continually decline over 2021 Noninterest Income Modest increase in mortgage banking income, with seasonal increases in volume mostly offset by lower premiums Foreign exchange income expected to remain relatively flat in near term Deposit service charges to remain under pressure given higher deposit balances Bankcard income to grow in near-term with increase in customer spending 1 See Forward Looking Statement Disclosure on page 2-3 of this presentation for a discussion of factors that could affect management’s expectations and results in future periods. Will be impacted by timing of PPP forgiveness fees Expected to be under modest pressure from the low interest rate environment, excess liquidity on the balance sheet and increases to the securities portfolio. Capital Will continue to evaluate capital deployment opportunities, including share repurchases
Presentation Contents About First Financial Bancorp Financial Performance Appendix 34
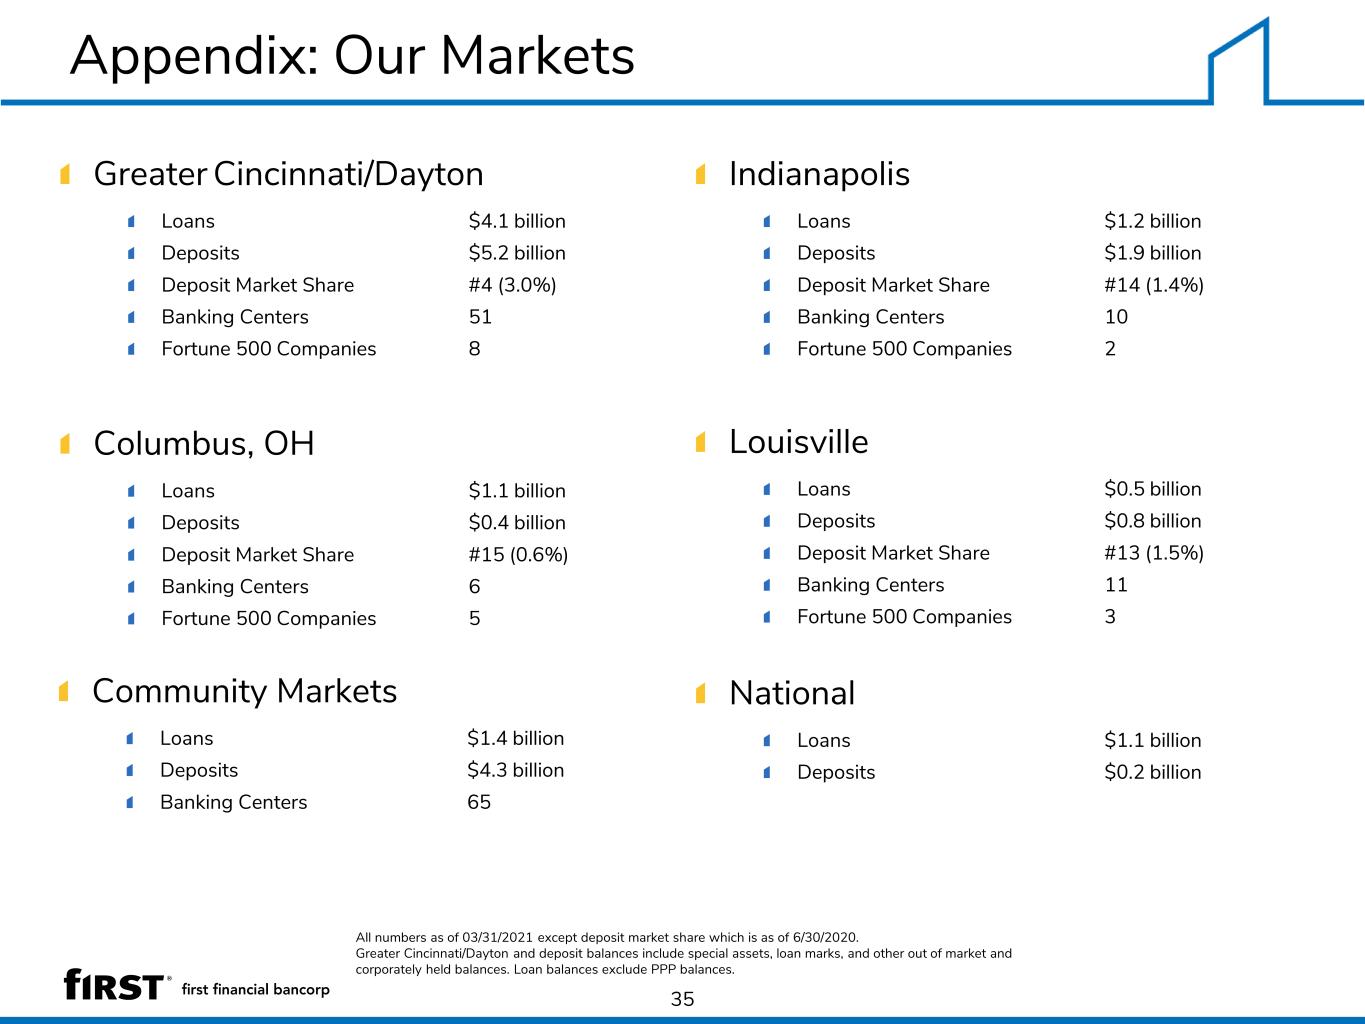
Appendix: Our Markets 35 Greater Cincinnati/Dayton Loans $4.1 billion Deposits $5.2 billion Deposit Market Share #4 (3.0%) Banking Centers 51 Fortune 500 Companies 8 Indianapolis Loans $1.2 billion Deposits $1.9 billion Deposit Market Share #14 (1.4%) Banking Centers 10 Fortune 500 Companies 2 Columbus, OH Loans $1.1 billion Deposits $0.4 billion Deposit Market Share #15 (0.6%) Banking Centers 6 Fortune 500 Companies 5 National Loans $1.1 billion Deposits $0.2 billion Louisville Loans $0.5 billion Deposits $0.8 billion Deposit Market Share #13 (1.5%) Banking Centers 11 Fortune 500 Companies 3 Community Markets Loans $1.4 billion Deposits $4.3 billion Banking Centers 65 All numbers as of 03/31/2021 except deposit market share which is as of 6/30/2020. Greater Cincinnati/Dayton and deposit balances include special assets, loan marks, and other out of market and corporately held balances. Loan balances exclude PPP balances.
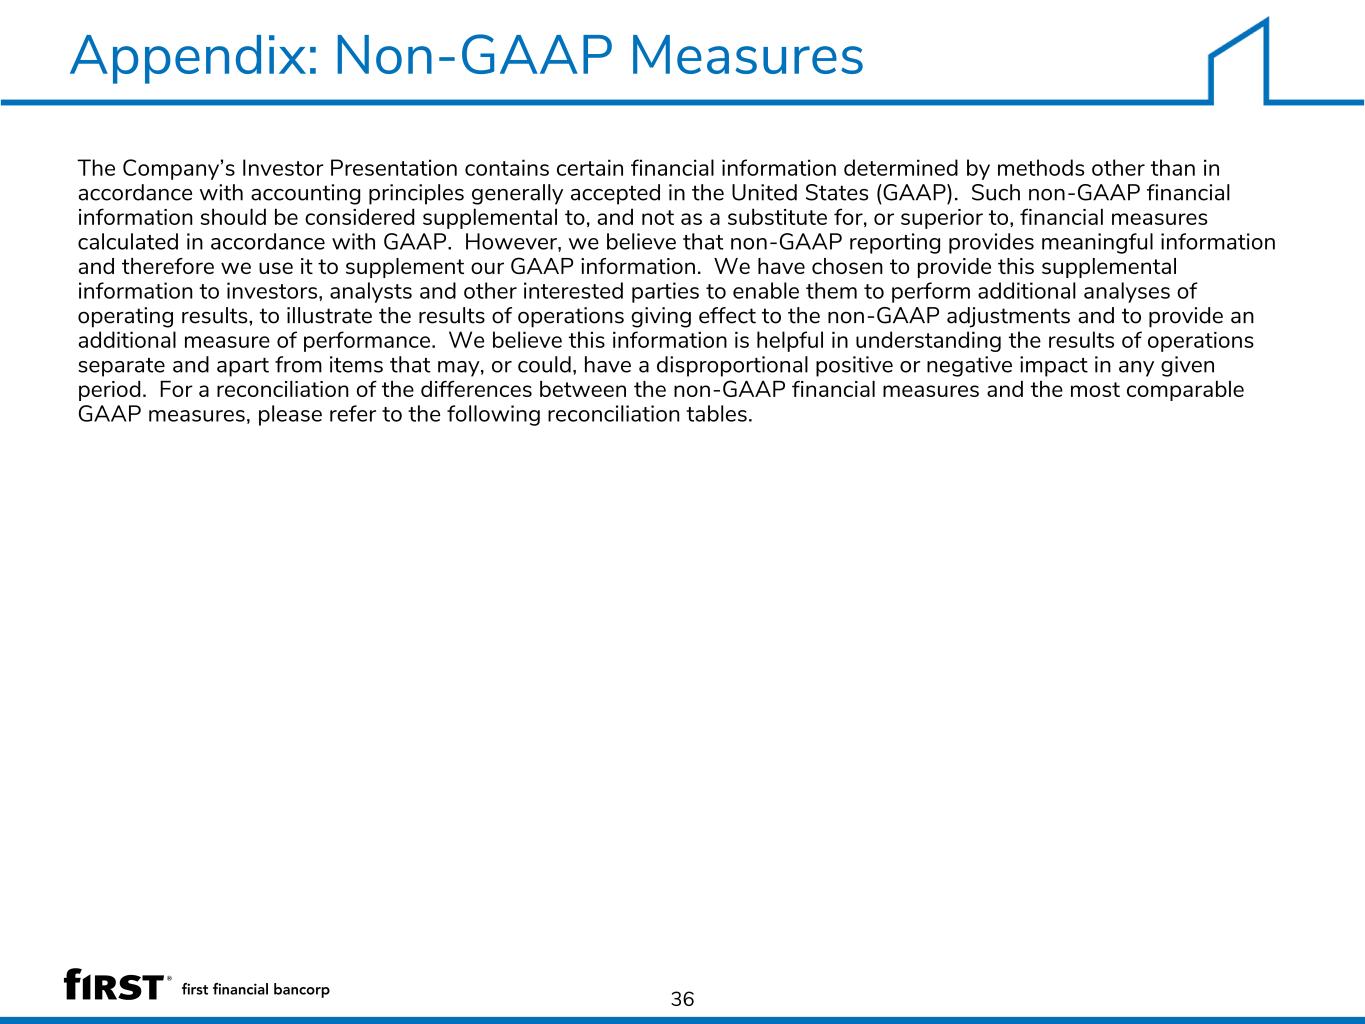
The Company’s Investor Presentation contains certain financial information determined by methods other than in accordance with accounting principles generally accepted in the United States (GAAP). Such non-GAAP financial information should be considered supplemental to, and not as a substitute for, or superior to, financial measures calculated in accordance with GAAP. However, we believe that non-GAAP reporting provides meaningful information and therefore we use it to supplement our GAAP information. We have chosen to provide this supplemental information to investors, analysts and other interested parties to enable them to perform additional analyses of operating results, to illustrate the results of operations giving effect to the non-GAAP adjustments and to provide an additional measure of performance. We believe this information is helpful in understanding the results of operations separate and apart from items that may, or could, have a disproportional positive or negative impact in any given period. For a reconciliation of the differences between the non-GAAP financial measures and the most comparable GAAP measures, please refer to the following reconciliation tables. to GAAP Reconciliation 36 Appendix: Non-GAAP Measures
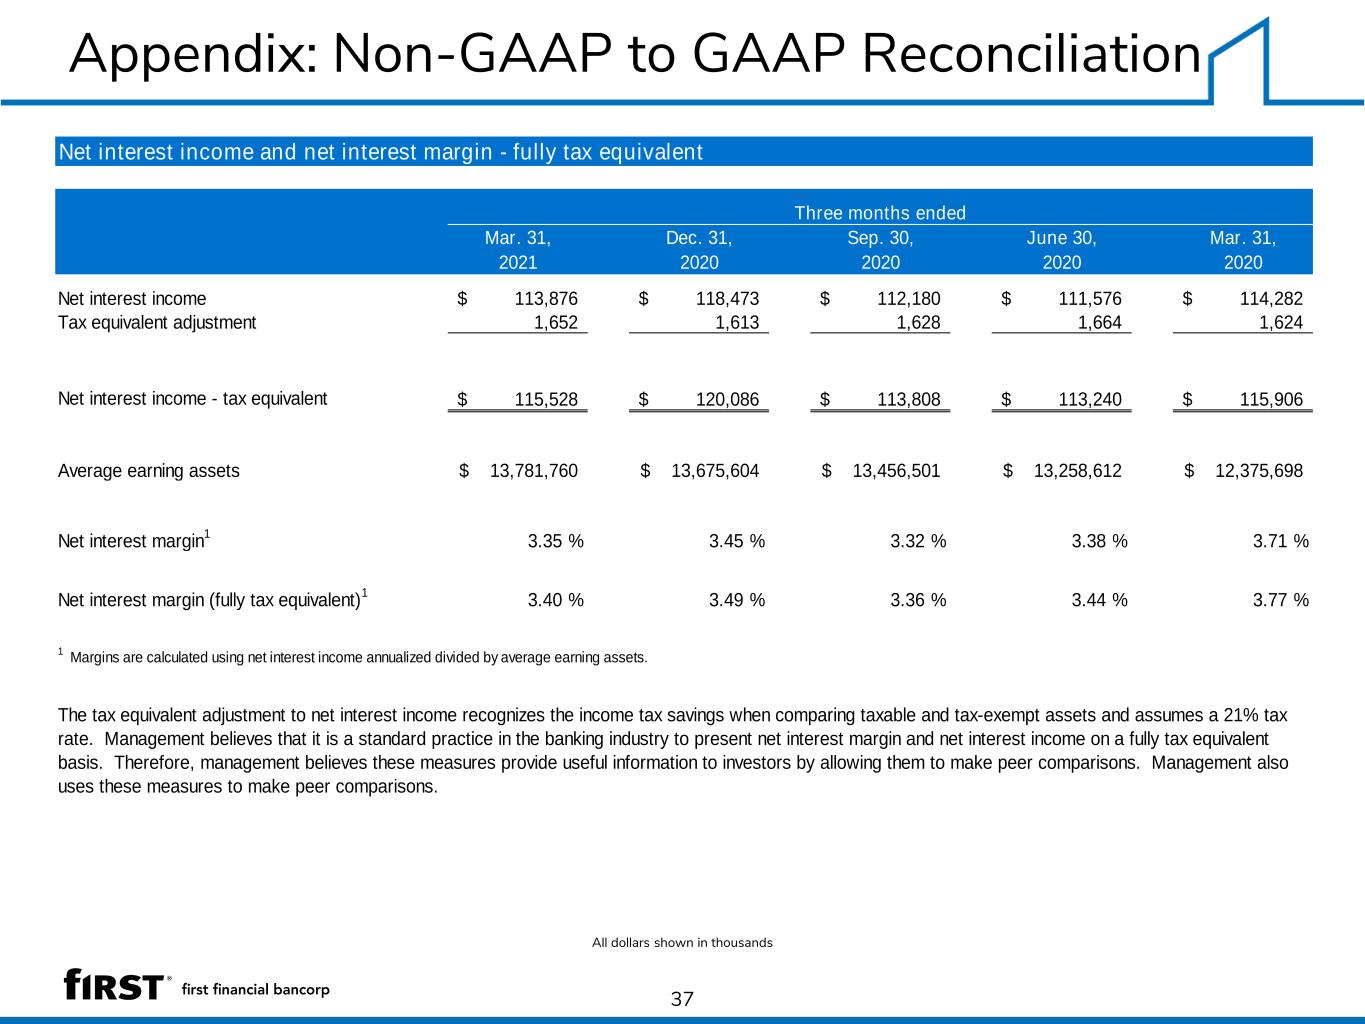
Appendix: Non-GAAP to GAAP Reconciliation 37 All dollars shown in thousands Net interest income and net interest margin - fully tax equivalent Mar. 31, Dec. 31, Sep. 30, June 30, Mar. 31, 2021 2020 2020 2020 2020 Net interest income 113,876$ 118,473$ 112,180$ 111,576$ 114,282$ Tax equivalent adjustment 1,652 1,613 1,628 1,664 1,624 Net interest income - tax equivalent 115,528$ 120,086$ 113,808$ 113,240$ 115,906$ Average earning assets 13,781,760$ 13,675,604$ 13,456,501$ 13,258,612$ 12,375,698$ Net interest margin 1 3.35 % 3.45 % 3.32 % 3.38 % 3.71 % Net interest margin (fully tax equivalent) 1 3.40 % 3.49 % 3.36 % 3.44 % 3.77 % Three months ended 1 Margins are calculated using net interest income annualized divided by average earning assets. The tax equivalent adjustment to net interest income recognizes the income tax savings when comparing taxable and tax-exempt assets and assumes a 21% tax rate. Management believes that it is a standard practice in the banking industry to present net interest margin and net interest income on a fully tax equivalent basis. Therefore, management believes these measures provide useful information to investors by allowing them to make peer comparisons. Management also uses these measures to make peer comparisons.
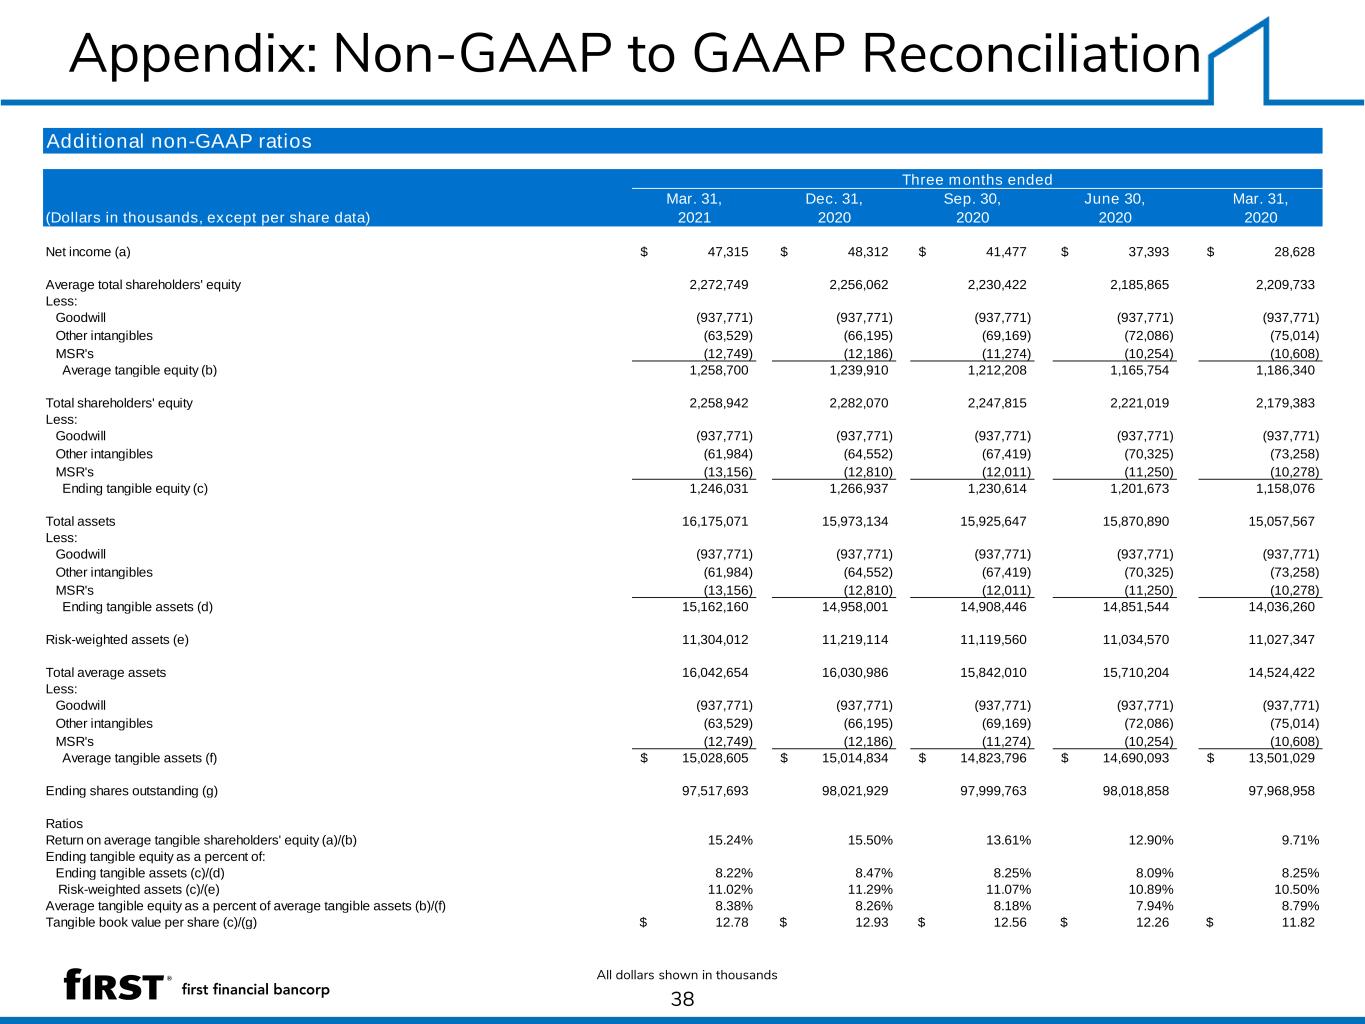
Appendix: Non-GAAP to GAAP Reconciliation 38 All dollars shown in thousands Additional non-GAAP ratios Mar. 31, Dec. 31, Sep. 30, June 30, Mar. 31, (Dollars in thousands, except per share data) 2021 2020 2020 2020 2020 Net income (a) 47,315$ 48,312$ 41,477$ 37,393$ 28,628$ Average total shareholders' equity 2,272,749 2,256,062 2,230,422 2,185,865 2,209,733 Less: Goodwill (937,771) (937,771) (937,771) (937,771) (937,771) Other intangibles (63,529) (66,195) (69,169) (72,086) (75,014) MSR's (12,749) (12,186) (11,274) (10,254) (10,608) Average tangible equity (b) 1,258,700 1,239,910 1,212,208 1,165,754 1,186,340 Total shareholders' equity 2,258,942 2,282,070 2,247,815 2,221,019 2,179,383 Less: Goodwill (937,771) (937,771) (937,771) (937,771) (937,771) Other intangibles (61,984) (64,552) (67,419) (70,325) (73,258) MSR's (13,156) (12,810) (12,011) (11,250) (10,278) Ending tangible equity (c) 1,246,031 1,266,937 1,230,614 1,201,673 1,158,076 Total assets 16,175,071 15,973,134 15,925,647 15,870,890 15,057,567 Less: Goodwill (937,771) (937,771) (937,771) (937,771) (937,771) Other intangibles (61,984) (64,552) (67,419) (70,325) (73,258) MSR's (13,156) (12,810) (12,011) (11,250) (10,278) Ending tangible assets (d) 15,162,160 14,958,001 14,908,446 14,851,544 14,036,260 Risk-weighted assets (e) 11,304,012 11,219,114 11,119,560 11,034,570 11,027,347 Total average assets 16,042,654 16,030,986 15,842,010 15,710,204 14,524,422 Less: Goodwill (937,771) (937,771) (937,771) (937,771) (937,771) Other intangibles (63,529) (66,195) (69,169) (72,086) (75,014) MSR's (12,749) (12,186) (11,274) (10,254) (10,608) Average tangible assets (f) 15,028,605$ 15,014,834$ 14,823,796$ 14,690,093$ 13,501,029$ Ending shares outstanding (g) 97,517,693 98,021,929 97,999,763 98,018,858 97,968,958 Ratios Return on average tangible shareholders' equity (a)/(b) 15.24% 15.50% 13.61% 12.90% 9.71% Ending tangible equity as a percent of: Ending tangible assets (c)/(d) 8.22% 8.47% 8.25% 8.09% 8.25% Risk-weighted assets (c)/(e) 11.02% 11.29% 11.07% 10.89% 10.50% Average tangible equity as a percent of average tangible assets (b)/(f) 8.38% 8.26% 8.18% 7.94% 8.79% Tangible book value per share (c)/(g) 12.78$ 12.93$ 12.56$ 12.26$ 11.82$ Three months ended
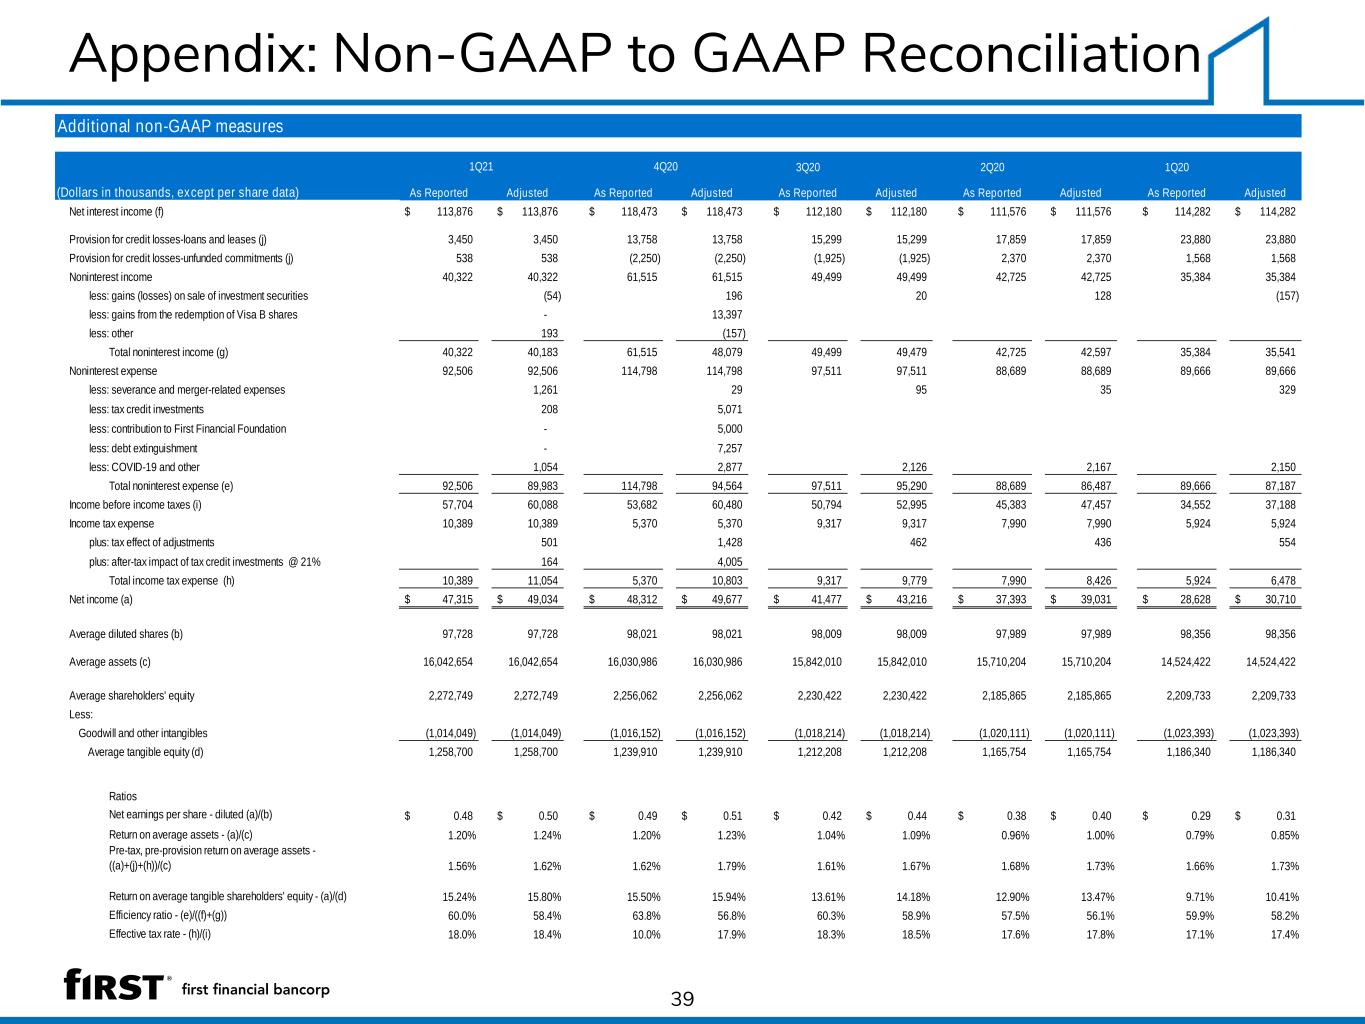
Appendix: Non-GAAP to GAAP Reconciliation 39 Additional non-GAAP measures 3Q20 2Q20 1Q20 As Reported Adjusted As Reported Adjusted As Reported Adjusted As Reported Adjusted As Reported Adjusted Net interest income (f) 113,876$ 113,876$ 118,473$ 118,473$ 112,180$ 112,180$ 111,576$ 111,576$ 114,282$ 114,282$ Provision for credit losses-loans and leases (j) 3,450 3,450 13,758 13,758 15,299 15,299 17,859 17,859 23,880 23,880 Provision for credit losses-unfunded commitments (j) 538 538 (2,250) (2,250) (1,925) (1,925) 2,370 2,370 1,568 1,568 Noninterest income 40,322 40,322 61,515 61,515 49,499 49,499 42,725 42,725 35,384 35,384 less: gains (losses) on sale of investment securities (54) 196 20 128 (157) less: gains from the redemption of Visa B shares - 13,397 less: other 193 (157) Total noninterest income (g) 40,322 40,183 61,515 48,079 49,499 49,479 42,725 42,597 35,384 35,541 Noninterest expense 92,506 92,506 114,798 114,798 97,511 97,511 88,689 88,689 89,666 89,666 less: severance and merger-related expenses 1,261 29 95 35 329 less: tax credit investments 208 5,071 less: contribution to First Financial Foundation - 5,000 less: debt extinguishment - 7,257 less: COVID-19 and other 1,054 2,877 2,126 2,167 2,150 Total noninterest expense (e) 92,506 89,983 114,798 94,564 97,511 95,290 88,689 86,487 89,666 87,187 Income before income taxes (i) 57,704 60,088 53,682 60,480 50,794 52,995 45,383 47,457 34,552 37,188 Income tax expense 10,389 10,389 5,370 5,370 9,317 9,317 7,990 7,990 5,924 5,924 plus: tax effect of adjustments 501 1,428 462 436 554 plus: after-tax impact of tax credit investments @ 21% 164 4,005 Total income tax expense (h) 10,389 11,054 5,370 10,803 9,317 9,779 7,990 8,426 5,924 6,478 Net income (a) 47,315$ 49,034$ 48,312$ 49,677$ 41,477$ 43,216$ 37,393$ 39,031$ 28,628$ 30,710$ Average diluted shares (b) 97,728 97,728 98,021 98,021 98,009 98,009 97,989 97,989 98,356 98,356 Average assets (c) 16,042,654 16,042,654 16,030,986 16,030,986 15,842,010 15,842,010 15,710,204 15,710,204 14,524,422 14,524,422 Average shareholders' equity 2,272,749 2,272,749 2,256,062 2,256,062 2,230,422 2,230,422 2,185,865 2,185,865 2,209,733 2,209,733 Less: Goodwill and other intangibles (1,014,049) (1,014,049) (1,016,152) (1,016,152) (1,018,214) (1,018,214) (1,020,111) (1,020,111) (1,023,393) (1,023,393) Average tangible equity (d) 1,258,700 1,258,700 1,239,910 1,239,910 1,212,208 1,212,208 1,165,754 1,165,754 1,186,340 1,186,340 Ratios Net earnings per share - diluted (a)/(b) 0.48$ 0.50$ 0.49$ 0.51$ 0.42$ 0.44$ 0.38$ 0.40$ 0.29$ 0.31$ Return on average assets - (a)/(c) 1.20% 1.24% 1.20% 1.23% 1.04% 1.09% 0.96% 1.00% 0.79% 0.85% Pre-tax, pre-provision return on average assets - ((a)+(j)+(h))/(c) 1.56% 1.62% 1.62% 1.79% 1.61% 1.67% 1.68% 1.73% 1.66% 1.73% Return on average tangible shareholders' equity - (a)/(d) 15.24% 15.80% 15.50% 15.94% 13.61% 14.18% 12.90% 13.47% 9.71% 10.41% Efficiency ratio - (e)/((f)+(g)) 60.0% 58.4% 63.8% 56.8% 60.3% 58.9% 57.5% 56.1% 59.9% 58.2% Effective tax rate - (h)/(i) 18.0% 18.4% 10.0% 17.9% 18.3% 18.5% 17.6% 17.8% 17.1% 17.4% (Dollars in thousands, except per share data) 1Q21 4Q20
40 First Financial Bancorp First Financial Center 255 East Fifth Street Cincinnati, OH 45202
