Attached files
| file | filename |
|---|---|
| 8-K - 8-K - COMMUNITY WEST BANCSHARES / | brhc10024602_8k.htm |
Exhibit 99.1
May 14, 2021
To the Shareholders of Community West Bancshares:
We are proud to report that Community West Bancshares recently released its financial results for the first quarter of this year. Among the highlights was net income of $3.0 million for the quarter ending on March 31, 2021 compared to $2.6
million for the prior quarter and $1.6 million for the first quarter of last year.
Enclosed is an investor fact sheet for your review, providing information about growth in deposits, stockholders’ equity, and other benchmarks.
In addition to strong earnings, Community West produced solid top and bottom line results, core deposit growth and a slightly expanded net interest margin. Loan growth was steady, with a 13.5% increase in the loan portfolio compared to a year
ago, along with robust growth in total demand deposits, which increased 56% year-over-year. Our focus in 2021 remains on deploying excess liquidity through increased lending activity, while maintaining our strong net interest margin, lowering
overall expenses, and managing asset quality.
Part of our success in the first quarter of 2021, and also in 2020, included our participation in the Small Business Administration (SBA) Paycheck Protection Program (PPP). In 2020, we generated 521 PPP loans totaling $76.6 million for our
clients. During the first quarter of 2021, $22.8 million of the PPP loans made in 2020 were forgiven by the SBA, and our bank recognized $0.8 million of income in net fees related to the forgiven PPP loans. Also, in the first quarter of 2021 we
generated 393 new PPP loans for $48.1 million, which we anticipate to receive $2.0 million in additional fees over the earlier of loan forgiveness or five years. As these loans are forgiven, we will use the liquidity to pursue new opportunities,
including strategies to improve loan growth and further reduce funding costs.
The Board of Directors declared a quarterly cash dividend of $0.07 per common share, payable May 31, 2021 to common shareholders of record on May 10, 2021. Book value per common share increased to $10.77 at March 31, 2021, compared to $10.50 at
December 31, 2020, and $9.82 at March 31, 2020.
Community West Bank is the largest publicly traded community bank headquartered and serving all of Ventura, Santa Barbara and San Luis Obispo counties. Our bank is rated 5-star Superior by Bauer Financial, and was awarded a “Super Premier
Performance” rating in April 2021 by The Findley Reports. For over 50 years, Findley has recognized the financial performance of banking institutions in California and the western United States, focusing on four ratios: growth, return on
beginning equity, net operating income as a percentage of average assets, and loan losses as a percentage of gross loans. To be consistently rated so favorably is an honor for our bank.
We appreciate the continued support from you, our shareholders, as we pursue our growth opportunities.
Sincerely,
 |
 |
|
William R. Peoples
|
Martin E. Plourde
|
|
Chairman of the Board
|
President and Chief Executive Officer
|
 |

FACT SHEET
|
|
FIRST QUARTER 2021 HIGHLIGHTS
|
||
|
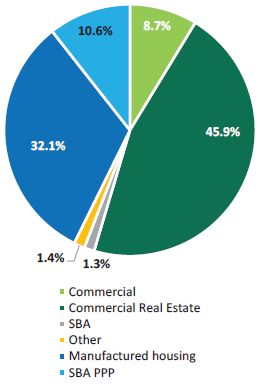
Total Loan Portfolio
$887.8 Million at 3/31/21
 |
◇ Net income was $3.0 million, or $0.35 per diluted share in 1Q21, compared to $2.6 million, or $0.31 per diluted share in 4Q20, and $1.6 million, or $0.19 per diluted share in
1Q20.
◇ Net interest income increased to $10 million for the quarter, compared to $9.8 million for 4Q20 and $8.5 million in 1Q20.
◇ A provision credit for loan losses of $173,000 for the quarter, compared to a provision credit for loan losses of $44,000 for 4Q20, and a provision for loan losses
of $392,000 for 1Q20. The resulting allowance was 1.19% of total loans held for investment at March 31, 2021, and 1.34% of total loans held for investment excluding the $94.5 million of Paycheck Protection Program
(“PPP”) loans at March 31, 2021, which are 100% guaranteed by the Small Business Administration (“SBA”).*
◇ Net interest margin improved to 4.19% for 1Q21, compared to 4.13% for 4Q20, and 3.97% for 1Q20.
◇ Total demand deposits increased $57.2 million to $637.1 million at March 31, 2021, compared to $579.9 million at December 31, 2020, and increased $229.1 million
compared to $408 million at March 31, 2020. Total demand deposits represented 79.2% of total deposits at March 31, 2021, compared to 75.7% at December 31, 2020, and 57.3% at March 31, 2020.
◇ Total loans increased $30.2 million to $887.8 million at March 31, 2021, compared to $857.6 million at December 31, 2020, and increased $105.8 million compared to
$782 million at March 31, 2020.
◇ Book value per common share increased to $10.77 at March 31, 2021, compared to $10.50 at December 31, 2020, and $9.82 at March 31, 2020.
◇ The Bank’s community bank leverage ratio (CBLR) was 8.97% at March 31, 2021, compared to 9.29% at December 31, 2020, and 9.21% at March 31, 2020.
◇ Net non-accrual loans decreased by 51.3% to $1.8 million at March 31, 2021, compared to $3.7 million at December 31, 2020, and $2.6 million at March 31, 2020.
◇ Other assets acquired through foreclosure, net, was $2.6 million at March 31, 2021 and December 31, 2020, respectively, and $2.7 million at March 31, 2020.
◇ Increased quarterly cash dividend by 17% to $0.07 per common share, payable May 31, 2021 to common shareholders of record on May 10, 2021.
◇ Awarded a “Super Premier Performance” rating by The Findley Reports.
*Non GAAP
|
|
|
FINANCIAL HIGHLIGHTS
|
|
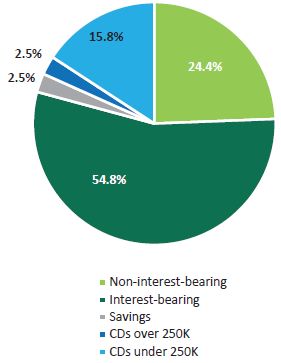
Deposit Portfolio
$804.5 Million at 3/31/21
 |
Period
|
EPS
|
Total Assets*
|
Nonaccrual
loans, net/total
loans
|
ALL/loans held
for
investment**
|
Net Interest
Margin
|
|||||||||||||||||
|
1Q21
|
$
|
0.35
|
$
|
1,018
|
0.21
|
%
|
1.34
|
%
|
4.19
|
%
|
|||||||||||||
|
1Q20
|
$
|
0.19
|
$
|
925
|
0.34
|
%
|
1.23
|
%
|
3.97
|
%
|
|||||||||||||
|
2020
|
$
|
0.97
|
$
|
975
|
0.43
|
%
|
1.35
|
%
|
3.89
|
%
|
|||||||||||||
|
2019
|
$
|
0.93
|
$
|
914
|
0.31
|
%
|
1.19
|
%
|
4.06
|
%
|
|||||||||||||
|
2018
|
$
|
0.88
|
$
|
877
|
0.44
|
%
|
1.21
|
%
|
4.07
|
%
|
|||||||||||||
|
$ in millions except per share data * at end of period ** excluding PPP loans
|
|||||||||||||||||||||||
ABOUT COMMUNITY WEST BANCSHARES
Community West Bancshares is a financial services company with headquarters in Goleta, California. The Company is the holding company for Community West Bank, the largest publicly traded community
bank serving California’s Central Coast area of Ventura, Santa Barbara and San Luis Obispo counties. Community West Bank has seven full-service California branch banking offic- es, in Goleta, Santa Barbara, Santa Maria, Ventura, San
Luis Obispo, Oxnard and Paso Robles. The principal business activities of the Company are Relationship business banking, Manufactured Housing lending and Government Guaranteed lending.
|
|||||||||||||||||||||||
|
CWBC MAY 3,
2021
|
|
Recent Price
|
$12.15
|
Market Cap
|
$103.6M
|
|
Shares Outstanding
|
8.5M
|
Book Value per Common Share
|
$10.77
|
|
Estimated Float
|
5.3M
|
Price/Book
|
1.13x
|
|
52-Week Range
|
$6.16-$13.44
|
Institutional Ownership
|
31.9%
|
|
Net Interest Margin*
|
4.19%
|
Insider Ownership
|
19.9%
|
|
*most recent quarter
|
|
|
FINANCIAL HIGHLIGHTS
(in thousands, except per share)
|
|
Income Statement
|
Three Months Ended
|
|||||||||||
|
31-Mar-21
|
31-Dec-20
|
31-Mar-20
|
||||||||||
|
Interest income
|
$
|
11,055
|
$
|
10,986
|
$
|
10,975
|
||||||
|
Interest expense
|
1,013
|
1,193
|
2,512
|
|||||||||
|
Net interest income before provision for loan losses
|
10,042
|
9,793
|
8,463
|
|||||||||
|
Provision (credit) for loan losses
|
(173
|
) |
(44
|
) |
392
|
|||||||
|
Net interest income after provision for loan losses
|
10,215
|
9,837
|
8,071
|
|||||||||
|
Non-interest income
|
897
|
970
|
950
|
|||||||||
|
Non-interest expenses
|
6,860
|
7,069
|
6,729
|
|||||||||
|
Income before income taxes
|
4,252
|
3,738
|
2,292
|
|||||||||
|
Provision for income taxes
|
1,231
|
1,111
|
694
|
|||||||||
|
Net income
|
3,021
|
2,627
|
1,598
|
|||||||||
|
Earnings per common share:
|
|
|||||||||||
|
Basic
|
$
|
0.36 |
$
|
0.31
|
$
|
0.19
|
||||||
|
Diluted
|
$
|
0.35
|
$
|
0.31
|
$
|
0.19
|
||||||
|
Balance Sheet
|
31-Mar-21
|
31-Dec-20
|
31-Mar-20
|
|||||||||
|
Total assets
|
$
|
1,018,022
|
$
|
975,435
|
$
|
925,208
|
||||||
|
Total stockholders’ equity
|
$
|
91,791
|
$
|
89,007
|
$
|
83,161
|
||||||
|
Total deposits
|
$
|
804,521
|
$
|
766,185
|
$
|
711,599
|
||||||
|
Net loans
|
$
|
877,615
|
$
|
847,383
|
$
|
772,829
|
||||||
|
Asset Quality
|
31-Mar-21
|
31-Dec-20 | 31-Mar-20 | |||||||||
|
Nonaccrual loans, net
|
$
|
1,825
|
$
|
3,665
|
$
|
2,645
|
||||||
|
Nonaccrual loans, net/total loans
|
0.21
|
%
|
0.43
|
%
|
0.34
|
%
|
||||||
|
Nonaccrual loans plus other assets acquired through foreclosure, net
|
$
|
4,397
|
$
|
6,279
|
$
|
5,352
|
||||||
|
Nonaccrual loans plus other assets acquired through foreclosure, net/total assets
|
0.43
|
%
|
0.64
|
%
|
0.58
|
%
|
||||||
|
Net loan (recoveries) charge-offs in the quarter
|
$
|
(212
|
)
|
$
|
(41
|
)
|
$
|
(58
|
)
|
|||
|
Net loan (recoveries) charge-offs in the quarter/total loans
|
(0.02
|
%)
|
(0.00
|
%)
|
(0.01
|
%)
|
||||||

|
CORPORATE HEADQUARTERS
|
Community West Bank
445 Pine Avenue
Goleta, CA 93117
Phone (805) 692-5821
www.communitywestbank.com
|
TOP INSTITUTIONAL
SHAREHOLDERS *
|
|
Investors of America
|
6.71%
|
|
PL Capital Advisors
|
5.10%
|
|
Wellington Management
|
4.80%
|
|
Cutler Capital
|
3.45%
|
|
Siena Capital
|
2.30%
|
|
M3F
|
1.93%
|
|
Dimensional Fund
|
1.79%
|
|
Bridgeway Capital
|
1.20%
|
|
BHZ Capital Management
|
0.84%
|
|
Vanguard
|
0.65%
|
|
First Manhattan Co.
|
0.40%
|
|
Two Oaks Investment
|
0.35%
|
*information from S&P Global as of 2/15/21
|
MANAGEMENT TEAM
|
Martin E. Plourd
President & Chief Executive Officer
Susan C. Thompson
EVP & Chief Financial Officer
T. Joseph Stronks
EVP , Chief Operating Officer
William F. Filippin
EVP & Chief Credit Officer & Chief Administrative Officer
|
The company described in this report is a client of The IR Group, Inc., a securities industry relations firm. This report was prepared using information obtained from management and from publications
available to the public. This report does not purport to be a complete statement of all material facts and is not to be construed as a recommendation or solicitation to buy or sell securities of the company described herein. Upon
receiving a written request sent to its website www.theIRgroup.com. The IR Group will provide a package of detailed information on the client company. The IR
Group is compensated by the client company for services rendered on a continuing basis and consequently, the amount of such compensation related to the preparation and distribution of this report is not separately determinable. The IR
Group and/or its employees and/or members of their families, may have a long position in the securities of the company described herein
|
Issued: May 3, 2021