Attached files
| file | filename |
|---|---|
| 8-K - 8-K - Thryv Holdings, Inc. | brhc10024515_8k.htm |
| EX-99.1 - EXHIBIT 99.1 - Thryv Holdings, Inc. | brhc10024515_ex99-1.htm |
Exhibit 99.2

Investor SupplementFirst Quarter 2021
Safe Harbor This Presentation may include certain forward-looking statements, including, without
limitation, statements concerning the conditions of our industry and our operations, performance, and financial condition, including, in particular, statements relating to our business, growth strategies, product development efforts, and
future expenses. Forward-looking statements can be identified by words such as ‘‘anticipates,’’ ‘‘intends,’’ ‘‘plans,’’ ‘‘seeks,’’ ‘‘believes,’’ ‘‘estimates,’’ ‘‘expects,’’ and similar references to future periods, or by the inclusion of
forecasts or projections. Forward-looking statements are based on our current expectations and assumptions regarding our business, the economy, and other future conditions. Because forward-looking statements relate to the future, by their
nature, they are subject to inherent uncertainties and risks (some of which are beyond our control) and changes in circumstances or other assumptions that may cause actual results or performance to be materially different from those expressed
or implied by these forward-looking statements. As a result, our actual results may differ materially from those contemplated by the forward-looking statements. Except as required by law, we are under no obligation to, and expressly disclaim
any obligation to, update or alter any forward-looking statements whether as a result of any such changes, new information, subsequent events or otherwise.Market data and industry information used throughout this Presentation are based on
management’s knowledge of the industry and the good faith estimates of management. We also relied, to the extent available, upon management’s review of independent industry surveys and publications and other publicly available information
prepared by a number of third party sources. All of the market data and industry information used in this Presentation involves a number of assumptions and limitations, and you are cautioned not to give undue weight to such estimates.
Although we believe that these sources are reliable, we cannot guarantee the accuracy or completeness of this information, and we have not independently verified this information. While we believe the estimated market position, market
opportunity and market size information included in this presentation are generally reliable, such information, which is derived in part from management’s estimates and beliefs, is inherently uncertain and imprecise. Projections, assumptions
and estimates of our future performance and the future performance of the industry in which we operate are necessarily subject to a high degree of uncertainty and risk due to a variety of factors. These factors could cause results to differ
materially from those expressed in our estimates and beliefs and in the estimates prepared by independent parties. You should not construe the contents of this Presentation as legal, tax, accounting or investment advice or a recommendation to
take (or refrain from taking) any particular action. You should consult your own counsel and tax and financial advisors as to legal and related matters concerning the matters described herein.In addition to financial measures prepared in
accordance with U.S. generally accepted accounting principles (“GAAP”), this press release and the accompanying tables contain, and the conference call will contain, non-GAAP financial measures. We present non-GAAP measures including:
adjusted EBITDA, and adjusted EBITDA margin. The non-GAAP financial information is presented for supplemental informational purposes only and is not intended to be considered in isolation or as a substitute for, or superior to, financial
information prepared and presented in accordance with GAAP. Please refer to the supplemental information presented in the tables for reconciliations of the non-GAAP financial measures used in this press release to the most comparable GAAP
financial measures.We believe that these non-GAAP financial measures provide useful information about our financial performance, enhance the overall understanding of our past performance and future prospects and allow for greater transparency
with respect to important metrics used by our management for financial and operational decision-making. We believe that these measures provide an additional tool for investors to use in comparing our core financial performance over multiple
periods with other companies in our industry. However, it is important to note that the particular items we exclude from, or include in, our non-GAAP financial measures may differ from the items excluded from, or included in, similar non-GAAP
financial measures used by other companies in the same industry. 2
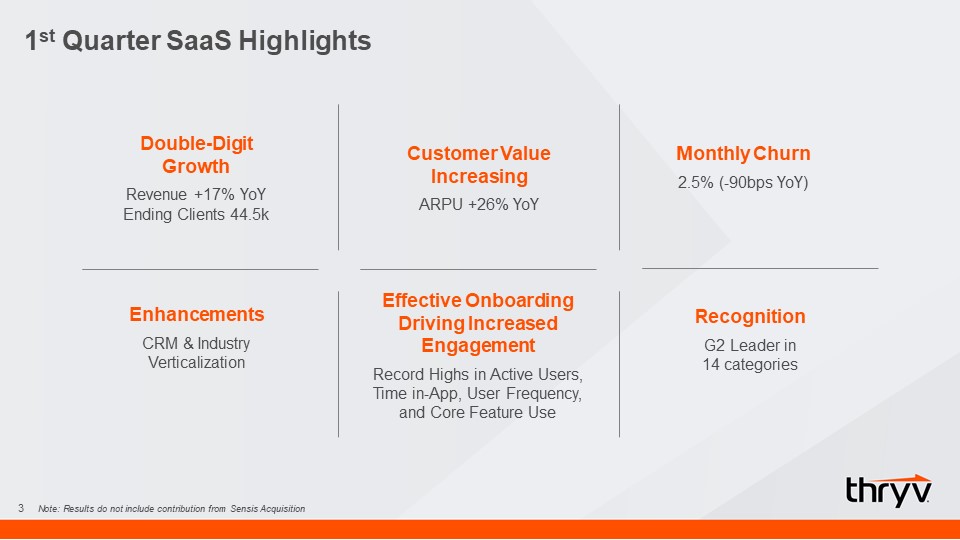
1st Quarter SaaS Highlights 3 Double-Digit GrowthRevenue +17% YoYEnding Clients 44.5k RecognitionG2
Leader in 14 categories Monthly Churn2.5% (-90bps YoY) Customer Value IncreasingARPU +26% YoY EnhancementsCRM & Industry Verticalization Effective Onboarding Driving Increased EngagementRecord Highs in Active Users, Time in-App, User
Frequency, and Core Feature Use Note: Results do not include contribution from Sensis Acquisition
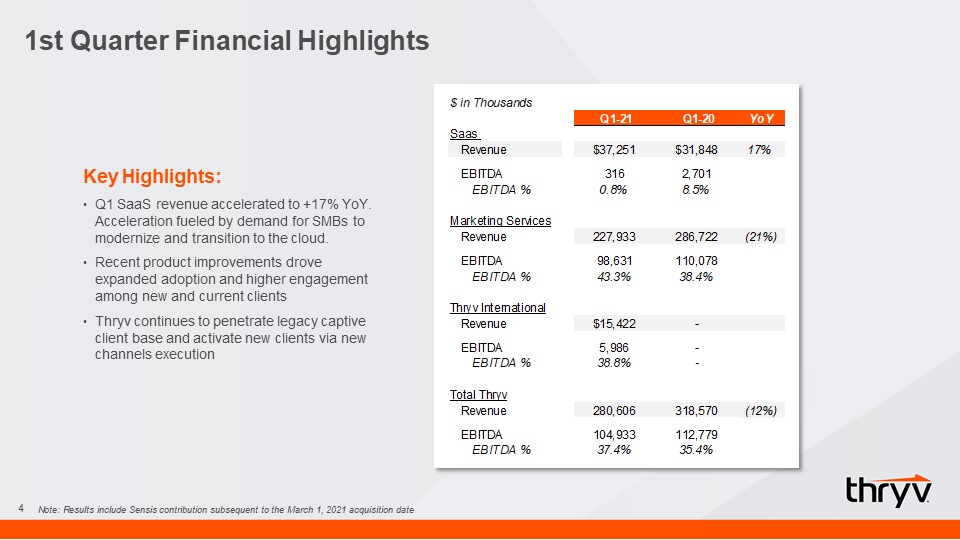
1st Quarter Financial Highlights 4 Key Highlights:Q1 SaaS revenue accelerated to +17% YoY.
Acceleration fueled by demand for SMBs to modernize and transition to the cloud. Recent product improvements drove expanded adoption and higher engagement among new and current clientsThryv continues to penetrate legacy captive client base
and activate new clients via new channels execution Note: Results include Sensis contribution subsequent to the March 1, 2021 acquisition date
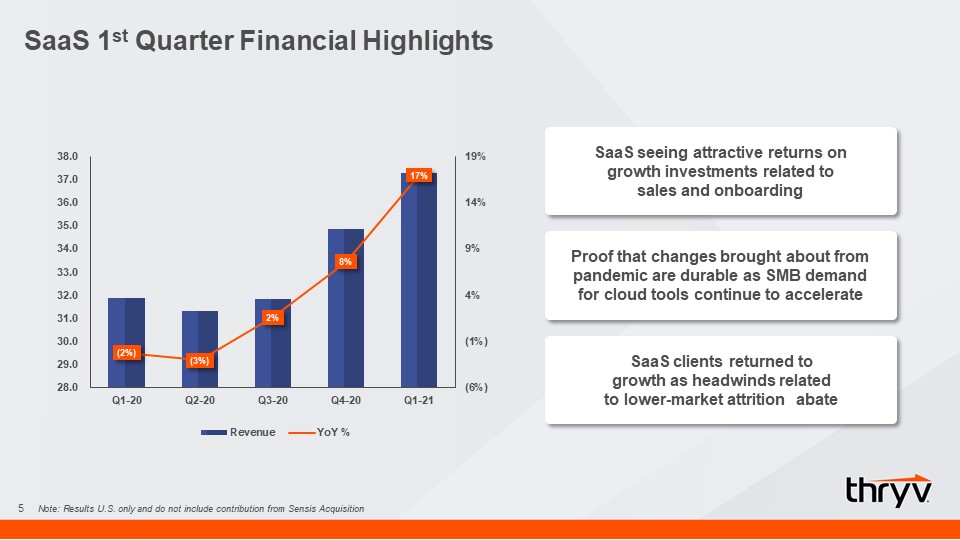
SaaS 1st Quarter Financial Highlights 5 SaaS seeing attractive returns on growth investments
related to sales and onboarding Proof that changes brought about from pandemic are durable as SMB demand for cloud tools continue to accelerate SaaS clients returned to growth as headwinds related to lower-market attrition abate Note:
Results U.S. only and do not include contribution from Sensis Acquisition
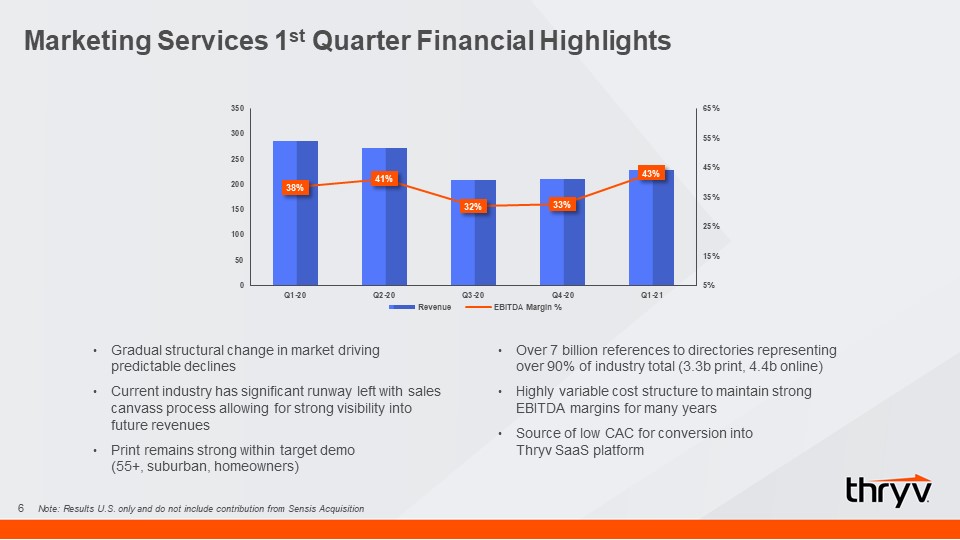
Marketing Services 1st Quarter Financial Highlights 6 Gradual structural change in market driving
predictable declines Current industry has significant runway left with sales canvass process allowing for strong visibility into future revenuesPrint remains strong within target demo (55+, suburban, homeowners)Over 7 billion references to
directories representing over 90% of industry total (3.3b print, 4.4b online)Highly variable cost structure to maintain strong EBITDA margins for many years Source of low CAC for conversion into Thryv SaaS platform Note: Results U.S. only
and do not include contribution from Sensis Acquisition
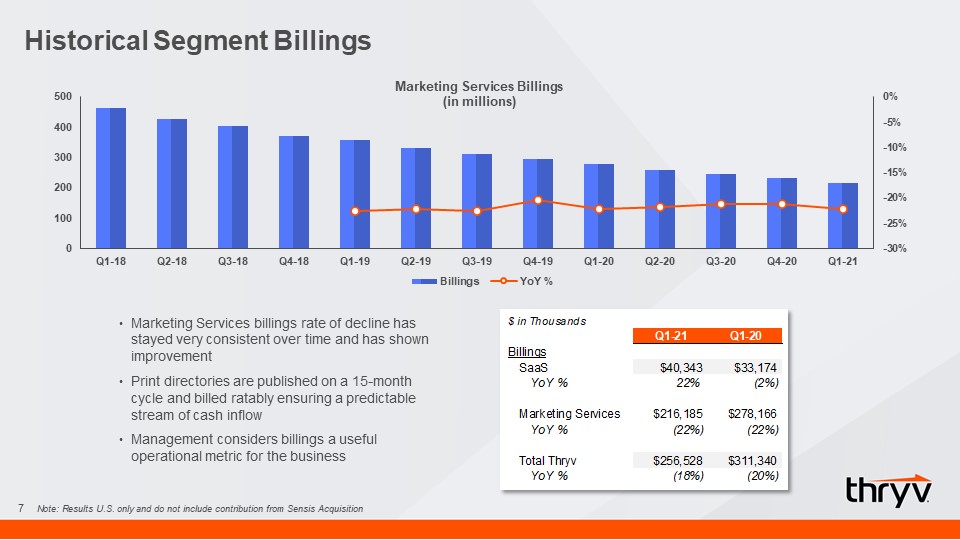
Historical Segment Billings 7 Marketing Services billings rate of decline has stayed very consistent
over time and has shown improvementPrint directories are published on a 15-month cycle and billed ratably ensuring a predictable stream of cash inflowManagement considers billings a useful operational metric for the business Note: Results
U.S. only and do not include contribution from Sensis Acquisition
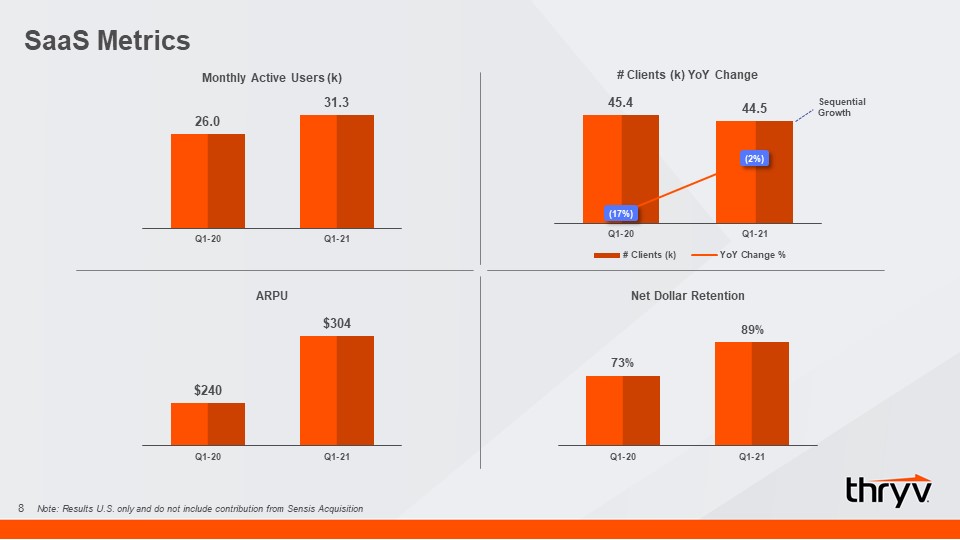
SaaS Metrics 8 Sequential Growth Note: Results U.S. only and do not include contribution from Sensis
Acquisition
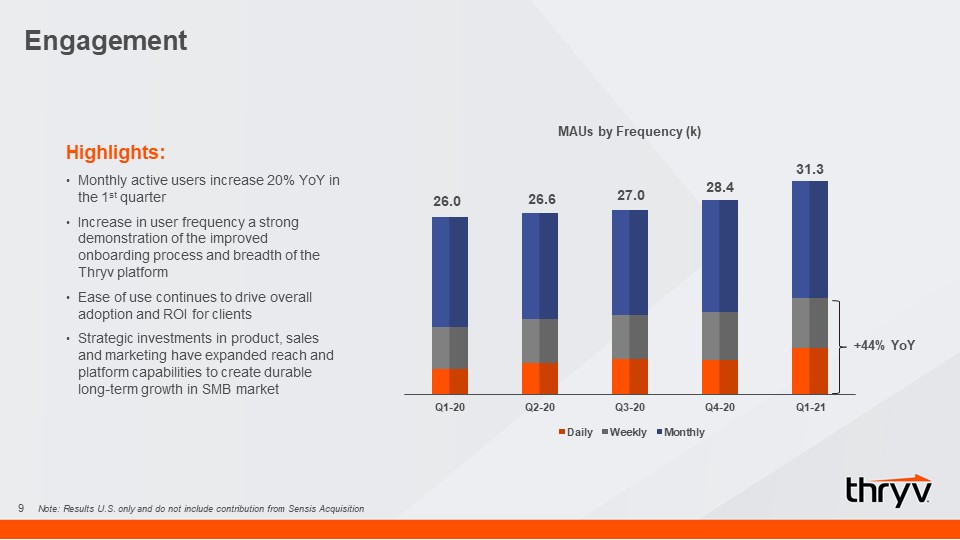
Engagement 9 26.0 31.3 +44% YoY Highlights:Monthly active users increase 20% YoY in the 1st
quarterIncrease in user frequency a strong demonstration of the improved onboarding process and breadth of the Thryv platformEase of use continues to drive overall adoption and ROI for clientsStrategic investments in product, sales and
marketing have expanded reach and platform capabilities to create durable long-term growth in SMB market 28.4 27.0 26.6 Note: Results U.S. only and do not include contribution from Sensis Acquisition
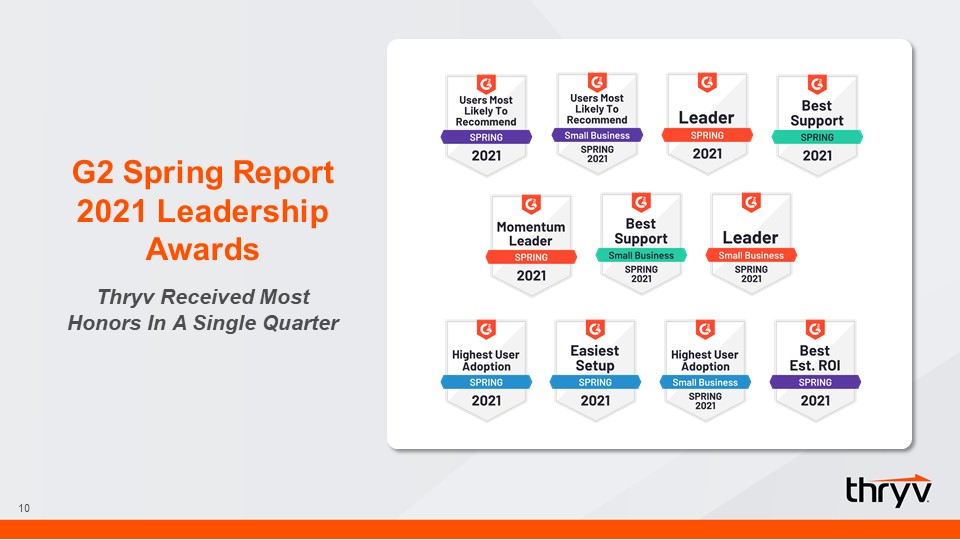
10 G2 Spring Report 2021 Leadership AwardsThryv Received Most Honors In A Single Quarter
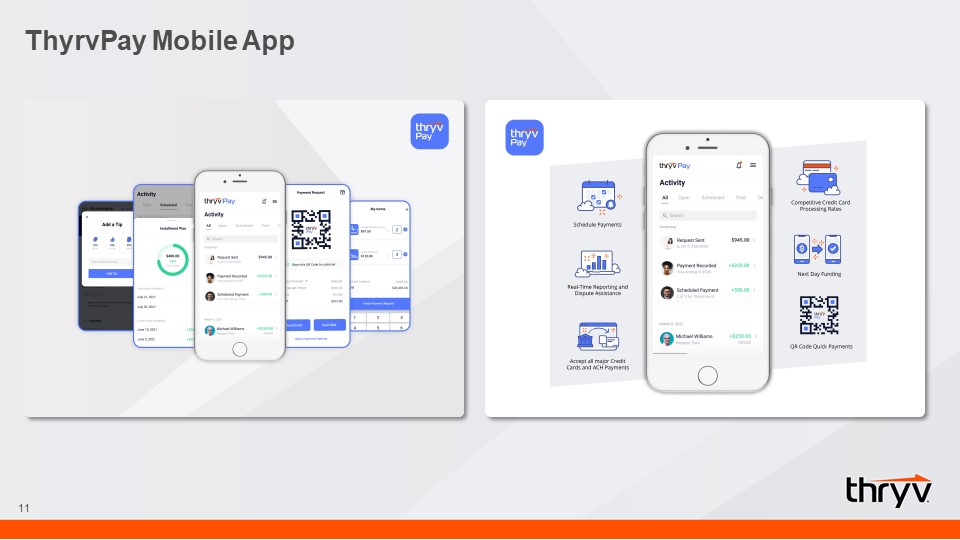
ThyrvPay Mobile App 11
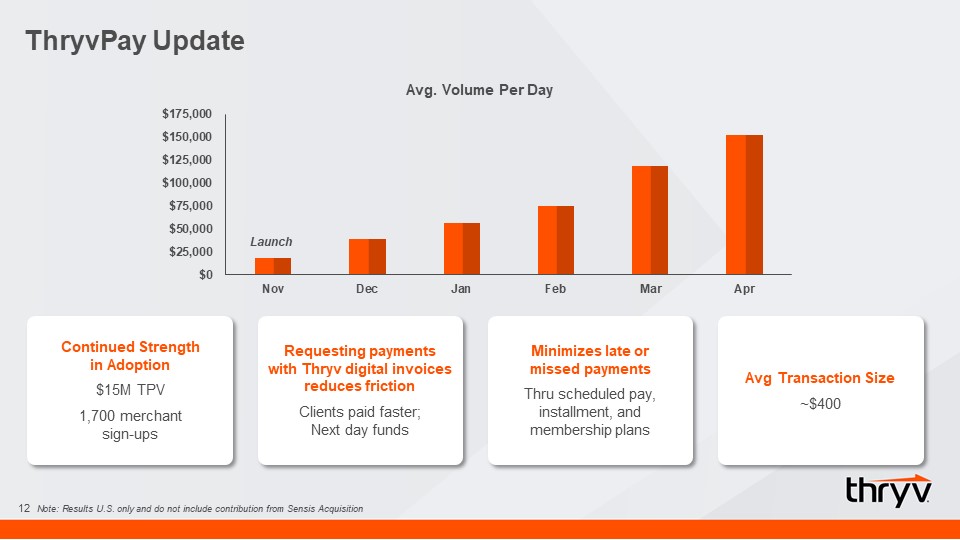
ThryvPay Update 12 Continued Strength in Adoption$15M TPV1,700 merchant sign-ups Requesting
payments with Thryv digital invoices reduces frictionClients paid faster;Next day funds Minimizes late or missed paymentsThru scheduled pay, installment, and membership plans Avg Transaction Size~$400 Note: Results U.S. only and do not
include contribution from Sensis Acquisition
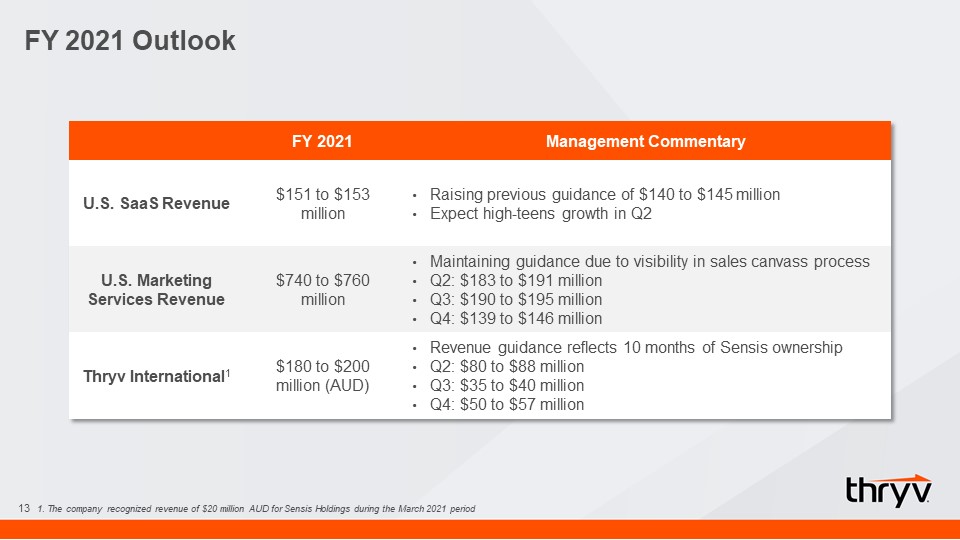
FY 2021 Outlook 13 FY 2021 Management Commentary U.S. SaaS Revenue $151 to $153 million
Raising previous guidance of $140 to $145 millionExpect high-teens growth in Q2 U.S. Marketing Services Revenue $740 to $760 million Maintaining guidance due to visibility in sales canvass process Q2: $183 to $191 millionQ3: $190 to $195
millionQ4: $139 to $146 million Thryv International1 $180 to $200 million (AUD) Revenue guidance reflects 10 months of Sensis ownershipQ2: $80 to $88 millionQ3: $35 to $40 millionQ4: $50 to $57 million 1. The company recognized revenue of
$20 million AUD for Sensis Holdings during the March 2021 period
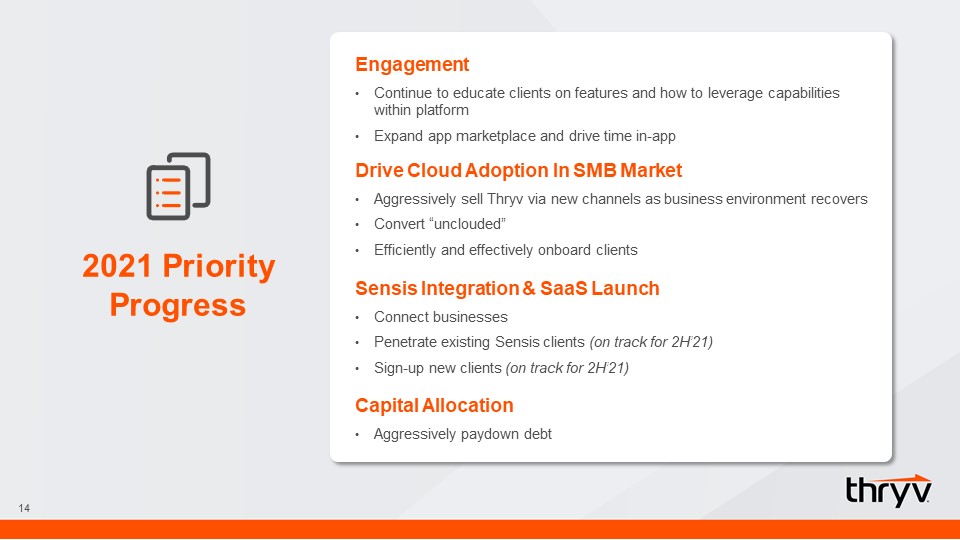
14 EngagementContinue to educate clients on features and how to leverage capabilities within
platformExpand app marketplace and drive time in-app Drive Cloud Adoption In SMB MarketAggressively sell Thryv via new channels as business environment recoversConvert “unclouded”Efficiently and effectively onboard clients Sensis
Integration & SaaS LaunchConnect businessesPenetrate existing Sensis clients (on track for 2H’21)Sign-up new clients (on track for 2H’21) Capital AllocationAggressively paydown debt 2021 Priority Progress
15 Appendix
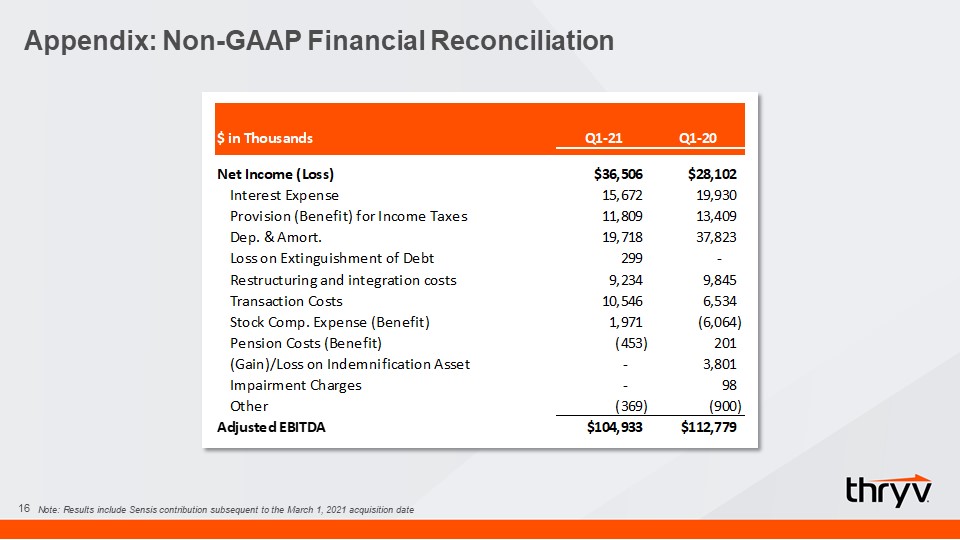
Appendix: Non-GAAP Financial Reconciliation 16 Note: Results include Sensis contribution subsequent
to the March 1, 2021 acquisition date