Attached files
| file | filename |
|---|---|
| 8-K - 8-K - Priority Technology Holdings, Inc. | prth-20210512.htm |
| EX-99.1 - EX-99.1 - Priority Technology Holdings, Inc. | exhibit991-331202151220215.htm |

Priority Technology Holdings, Inc. Supplemental Slides for the First Quarter 2021 Earnings Call May 13, 2021 EXHIBIT 99.2
Forward-Looking Statements This press release contains “forward-looking statements” within the meaning of the Private Securities Litigation Reform Act of 1995. Such statements include, but are not limited to, statements about future financial and operating results, our plans, objectives, expectations and intentions with respect to future operations, products and services, and other statements identified by words such as “may,” “will,” “should,” “anticipates,” “believes,” “expects,” “plans,” “future,” “intends,” “could,” “estimate,” “predict,” “projects,” “targeting,” “potential” or “contingent,” “guidance,” “outlook” or words of similar meaning. These forward- looking statements include, but are not limited to, expected timing of the closing of Priority Technology Holdings, Inc.'s ("Priority", "we", "our", or "us") merger with Finxera Holdings, Inc. ("Finxera") and our 2021 outlook and statements regarding our market and growth opportunities. Such forward-looking statements are based upon the current beliefs and expectations of our management and are inherently subject to significant business, economic and competitive risks, trends and uncertainties that could cause actual results to differ materially from those projected, expressed, or implied by such forward-looking statements. These forward-looking statements may include, but are not limited to, statements about the effects of the COVID-19 pandemic on our revenues and financial operating results. Our actual results could differ materially, and potentially adversely, from those discussed or implied herein. We caution that it is very difficult to predict the impact of known factors, and it is impossible for us to anticipate all factors that could affect our actual results. All forward-looking statements are expressly qualified in their entirety by these cautionary statements. You should evaluate all forward-looking statements made in this press release in the context of the risks and uncertainties disclosed in our SEC filings, including our most recent Annual Report on Form 10-K filed with the SEC on March 31, 2021. These filings are available online at www.sec.gov or www.PRTH.com. We caution you that the important factors referenced above may not contain all of the factors that are important to you. In addition, we cannot assure you that we will realize the results or developments we expect or anticipate or, even if substantially realized, that they will result in the consequences we anticipate or affect us or our operations in the way we expect. You are cautioned not to place undue reliance on forward-looking statements as a predictor of future performance. The forward-looking statements included in this press release are made only as of the date hereof. We undertake no obligation to publicly update or revise any forward-looking statement as a result of new information, future events or otherwise, except as otherwise required by law. If we do update one or more forward- looking statements, no inference should be made that we will make additional updates with respect to those or other forward-looking statements. We qualify all of our forward-looking statements by these cautionary statements. 1
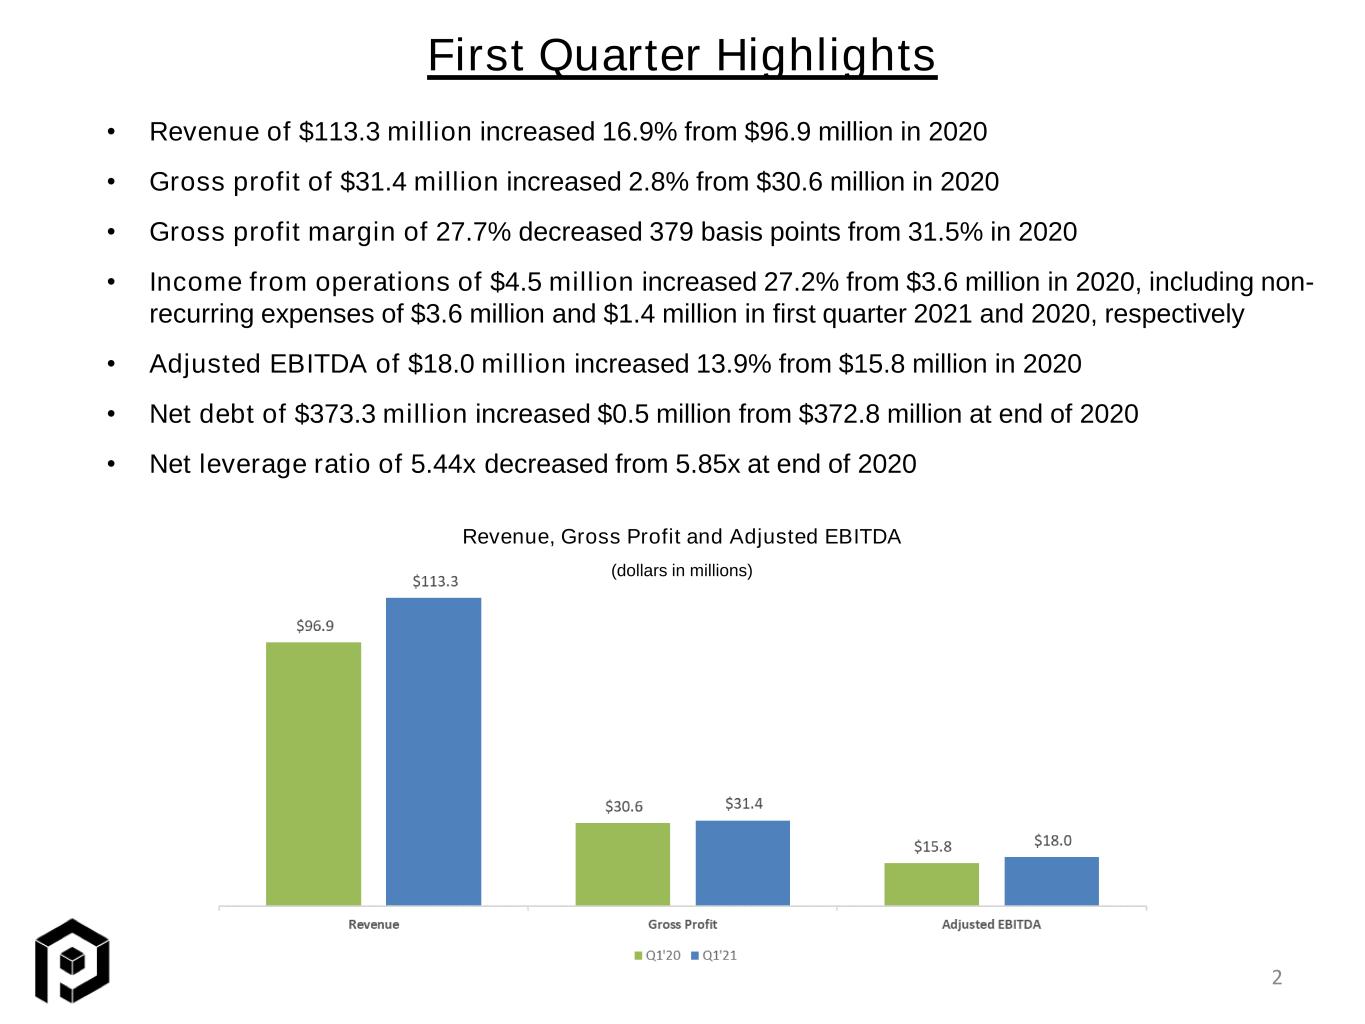
First Quarter Highlights 2 • Revenue of $113.3 million increased 16.9% from $96.9 million in 2020 • Gross profit of $31.4 million increased 2.8% from $30.6 million in 2020 • Gross profit margin of 27.7% decreased 379 basis points from 31.5% in 2020 • Income from operations of $4.5 million increased 27.2% from $3.6 million in 2020, including non- recurring expenses of $3.6 million and $1.4 million in first quarter 2021 and 2020, respectively • Adjusted EBITDA of $18.0 million increased 13.9% from $15.8 million in 2020 • Net debt of $373.3 million increased $0.5 million from $372.8 million at end of 2020 • Net leverage ratio of 5.44x decreased from 5.85x at end of 2020 Revenue, Gross Profit and Adjusted EBITDA (dollars in millions)
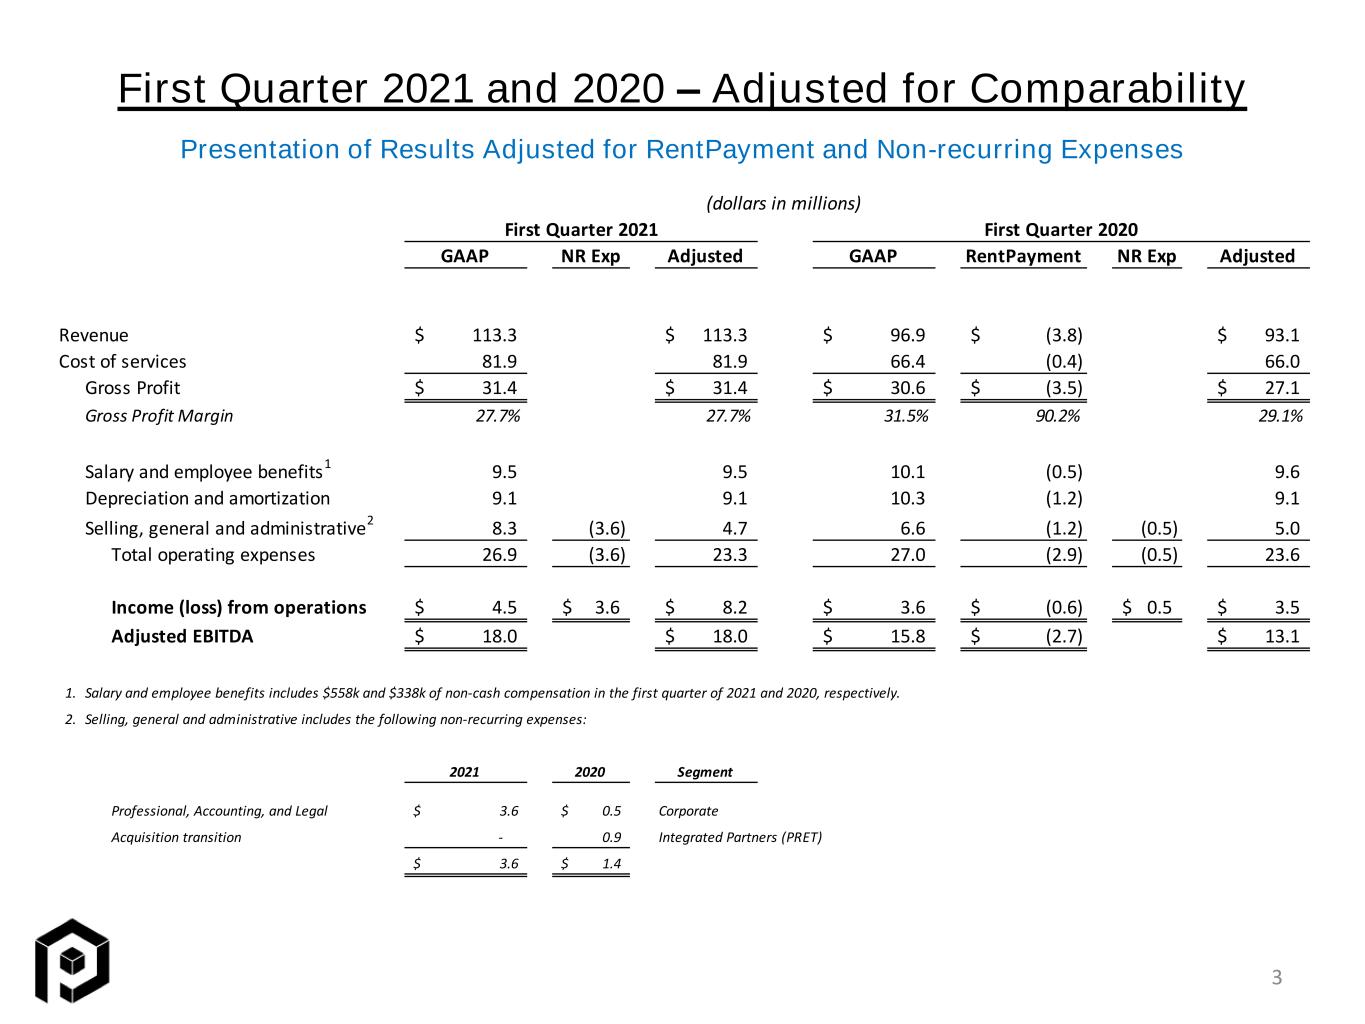
(dollars in millions) First Quarter 2021 First Quarter 2020 GAAP NR Exp Adjusted GAAP RentPayment NR Exp Adjusted Revenue 113.3$ 113.3$ 96.9$ (3.8)$ 93.1$ Cost of services 81.9 81.9 66.4 (0.4) 66.0 Gross Profit 31.4$ 31.4$ 30.6$ (3.5)$ 27.1$ Gross Profit Margin 27.7% 27.7% 31.5% 90.2% 29.1% Salary and employee benefits 1 9.5 9.5 10.1 (0.5) 9.6 Depreciation and amortization 9.1 9.1 10.3 (1.2) 9.1 Selling, general and administrative 2 8.3 (3.6) 4.7 6.6 (1.2) (0.5) 5.0 Total operating expenses 26.9 (3.6) 23.3 27.0 (2.9) (0.5) 23.6 Income (loss) from operations 4.5$ 3.6$ 8.2$ 3.6$ (0.6)$ 0.5$ 3.5$ Adjusted EBITDA 18.0$ 18.0$ 15.8$ (2.7)$ 13.1$ 1. Salary and employee benefits includes $558k and $338k of non-cash compensation in the first quarter of 2021 and 2020, respectively. 2. Selling, general and administrative includes the following non-recurring expenses: 2021 2020 Segment Professional, Accounting, and Legal 3.6$ 0.5$ Corporate Acquisition transition - 0.9 Integrated Partners (PRET) 3.6$ 1.4$ First Quarter 2021 and 2020 – Adjusted for Comparability 3 Presentation of Results Adjusted for RentPayment and Non-recurring Expenses
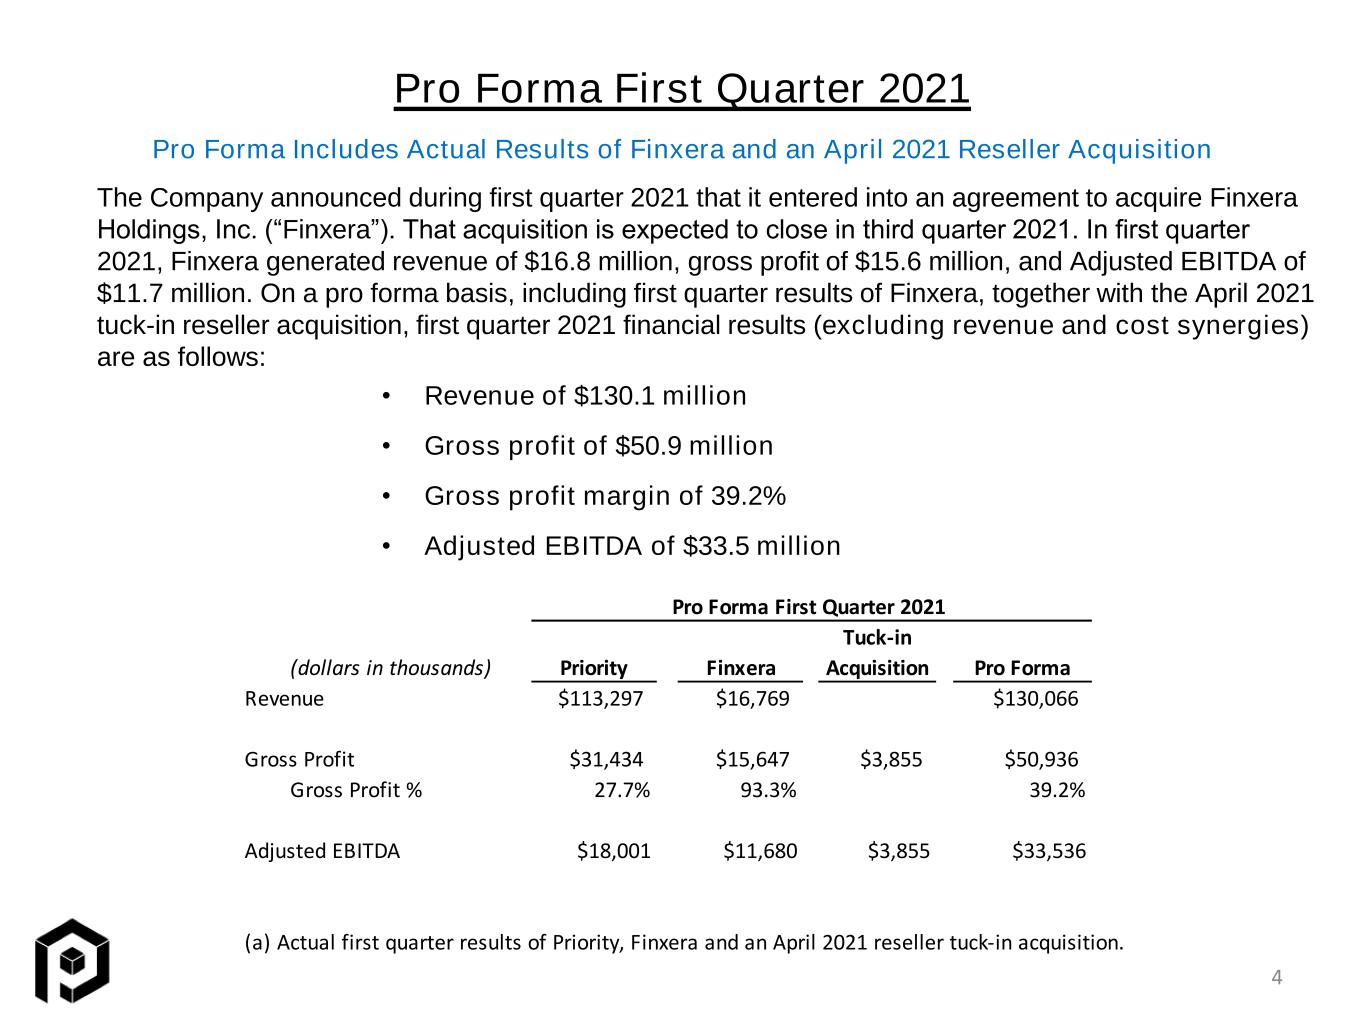
Pro Forma First Quarter 2021 4 Pro Forma Includes Actual Results of Finxera and an April 2021 Reseller Acquisition The Company announced during first quarter 2021 that it entered into an agreement to acquire Finxera Holdings, Inc. (“Finxera”). That acquisition is expected to close in third quarter 2021. In first quarter 2021, Finxera generated revenue of $16.8 million, gross profit of $15.6 million, and Adjusted EBITDA of $11.7 million. On a pro forma basis, including first quarter results of Finxera, together with the April 2021 tuck-in reseller acquisition, first quarter 2021 financial results (excluding revenue and cost synergies) are as follows: • Revenue of $130.1 million • Gross profit of $50.9 million • Gross profit margin of 39.2% • Adjusted EBITDA of $33.5 million Pro Forma First Quarter 2021 Tuck-in (dollars in thousands) Priority Finxera Acquisition Pro Forma Revenue $113,297 $16,769 $130,066 Gross Profit $31,434 $15,647 $3,855 $50,936 Gross Profit % 27.7% 93.3% 39.2% Adjusted EBITDA $18,001 $11,680 $3,855 $33,536 (a) Actual first quarter results of Priority, Finxera and an April 2021 reseller tuck-in acquisition.
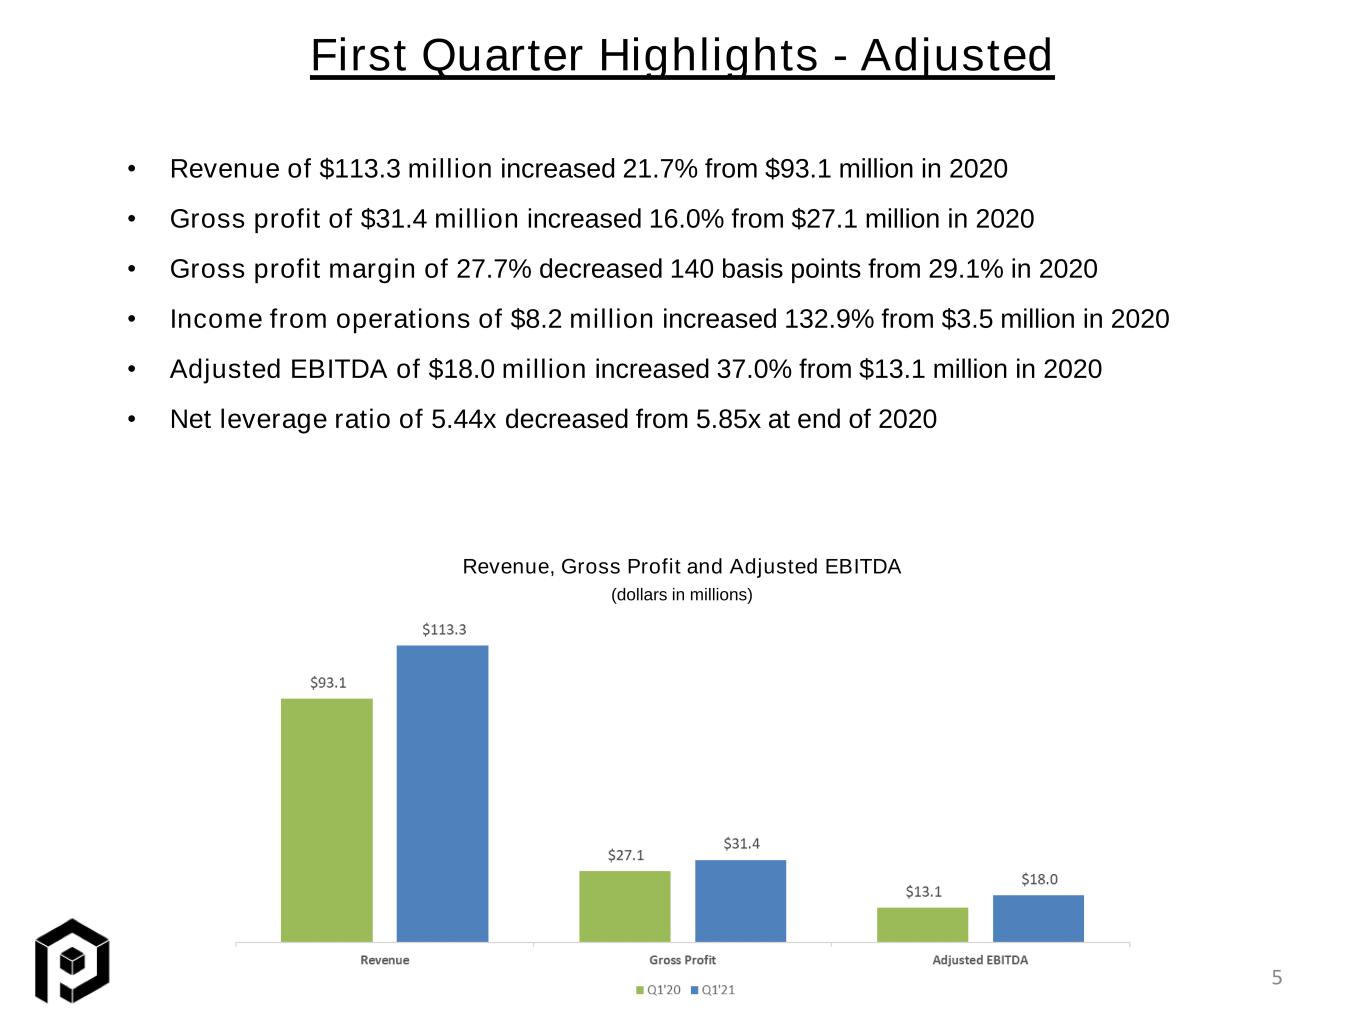
Revenue, Gross Profit and Adjusted EBITDA First Quarter Highlights - Adjusted 5 • Revenue of $113.3 million increased 21.7% from $93.1 million in 2020 • Gross profit of $31.4 million increased 16.0% from $27.1 million in 2020 • Gross profit margin of 27.7% decreased 140 basis points from 29.1% in 2020 • Income from operations of $8.2 million increased 132.9% from $3.5 million in 2020 • Adjusted EBITDA of $18.0 million increased 37.0% from $13.1 million in 2020 • Net leverage ratio of 5.44x decreased from 5.85x at end of 2020 (dollars in millions)
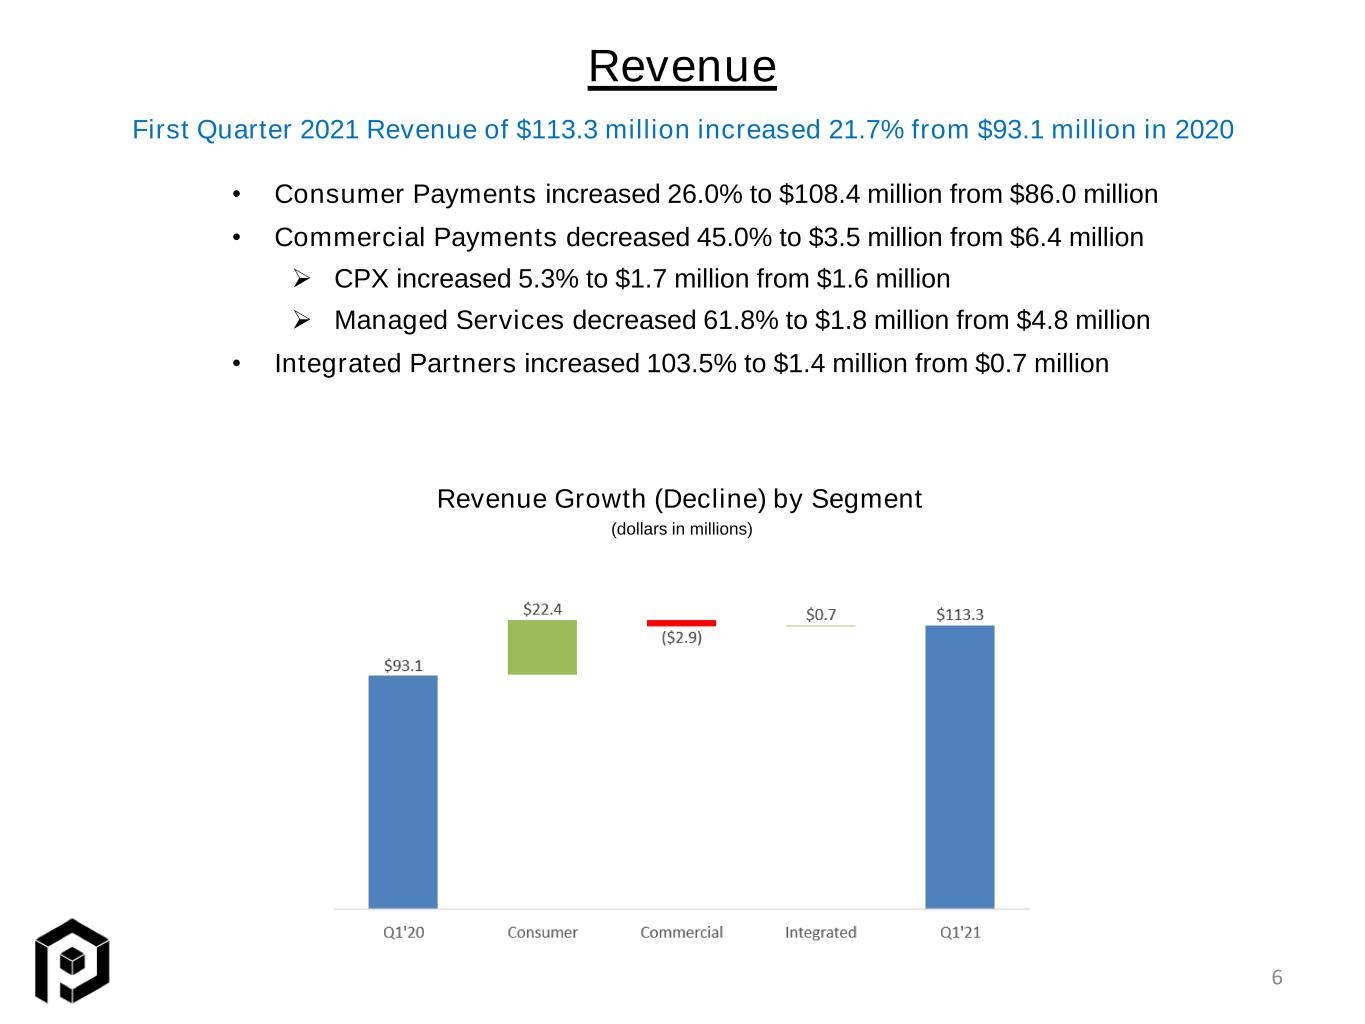
Revenue • Consumer Payments increased 26.0% to $108.4 million from $86.0 million • Commercial Payments decreased 45.0% to $3.5 million from $6.4 million ➢ CPX increased 5.3% to $1.7 million from $1.6 million ➢ Managed Services decreased 61.8% to $1.8 million from $4.8 million • Integrated Partners increased 103.5% to $1.4 million from $0.7 million Revenue Growth (Decline) by Segment First Quarter 2021 Revenue of $113.3 million increased 21.7% from $93.1 million in 2020 (dollars in millions) 6
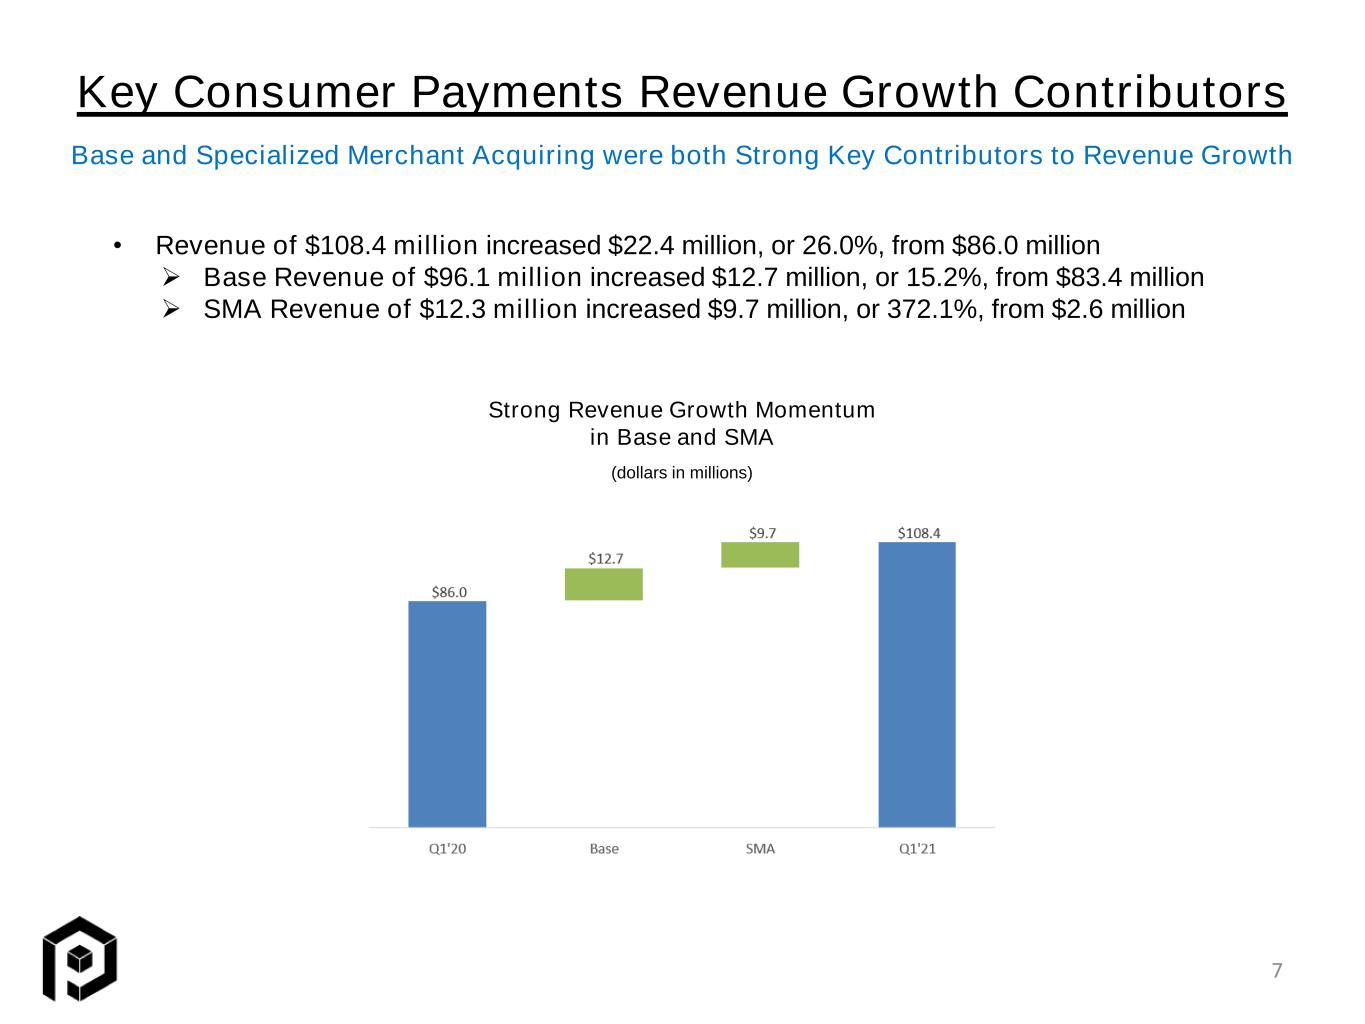
Key Consumer Payments Revenue Growth Contributors Base and Specialized Merchant Acquiring were both Strong Key Contributors to Revenue Growth Strong Revenue Growth Momentum in Base and SMA (dollars in millions) • Revenue of $108.4 million increased $22.4 million, or 26.0%, from $86.0 million ➢ Base Revenue of $96.1 million increased $12.7 million, or 15.2%, from $83.4 million ➢ SMA Revenue of $12.3 million increased $9.7 million, or 372.1%, from $2.6 million 7

• New Merchant Boards remain strong despite the economic impact of COVID ➢ Historically, monthly new merchant boards average in the range of 4,500 - 5,000 ➢ Monthly First Quarter average of 4,874 in 2021 compared to 5,139 in 2020 ➢ March 2021 added 5,069 new merchants ➢ SMA merchant count at the end of First Quarter 2021 was 1,799, with over 900 net new merchants added since First Quarter 2020 New Merchant Boards New Merchant Boards Remained Strong in First Quarter 2021 Monthly New Merchant Boards in 2021 8

Merchant Bankcard Volume Q1 2021 Merchant Bankcard volume of $11.9 billion increased 12.9% from $10.6 billion 9 First Quarter 2021 2020 Variance Consumer Payments: Merchant bankcard processing dollar value 11,871.9$ 10,386.7$ 14.3% Merchant bankcard transaction volume 127.5 119.4 6.7% Average Ticket 93.12$ 86.97$ 7.1% Commercial Payments: Merchant bankcard processing dollar value 63.4$ 72.7$ -12.7% Merchant bankcard transaction volume 0.0 0.0 53.7% Average Ticket 1,657.58$ 2,919.13$ -43.2% Integrated Partners: Merchant bankcard processing dollar value 11.4$ 124.5$ -90.9% Merchant bankcard transaction volume 0.1 0.4 -78.8% Average Ticket 119.50$ 277.80$ -57.0% Total: Merchant bankcard processing dollar value 11,946.8$ 10,583.9$ 12.9% Merchant bankcard transaction volume 127.6 119.9 6.4% Average Ticket 93.61$ 88.27$ 6.1% Amounts in millions, except Average Ticket
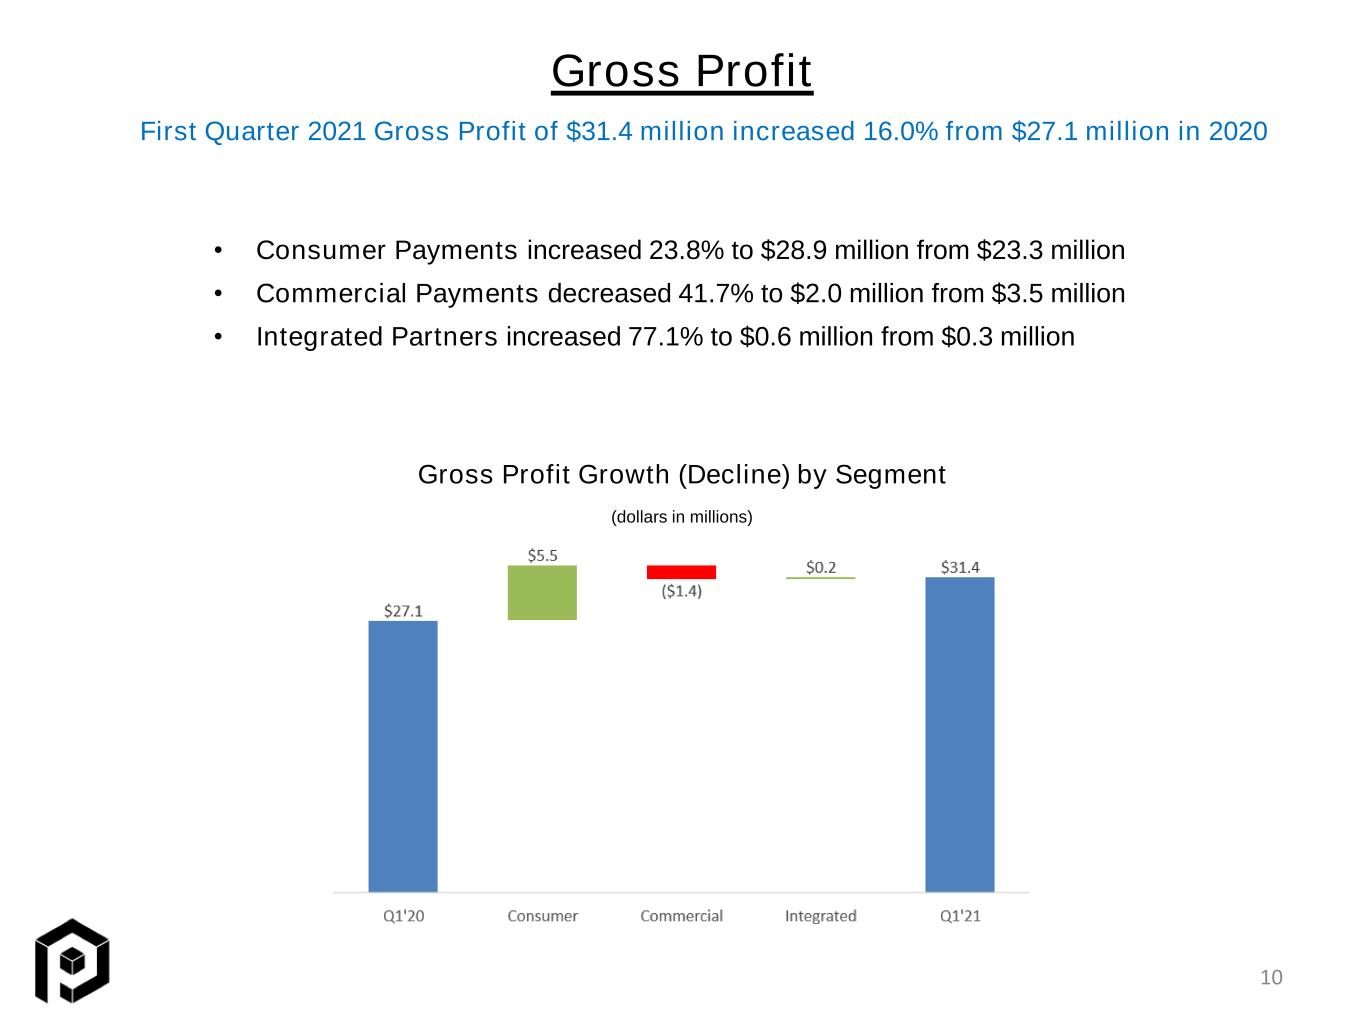
Gross Profit • Consumer Payments increased 23.8% to $28.9 million from $23.3 million • Commercial Payments decreased 41.7% to $2.0 million from $3.5 million • Integrated Partners increased 77.1% to $0.6 million from $0.3 million Gross Profit Growth (Decline) by Segment First Quarter 2021 Gross Profit of $31.4 million increased 16.0% from $27.1 million in 2020 (dollars in millions) 10
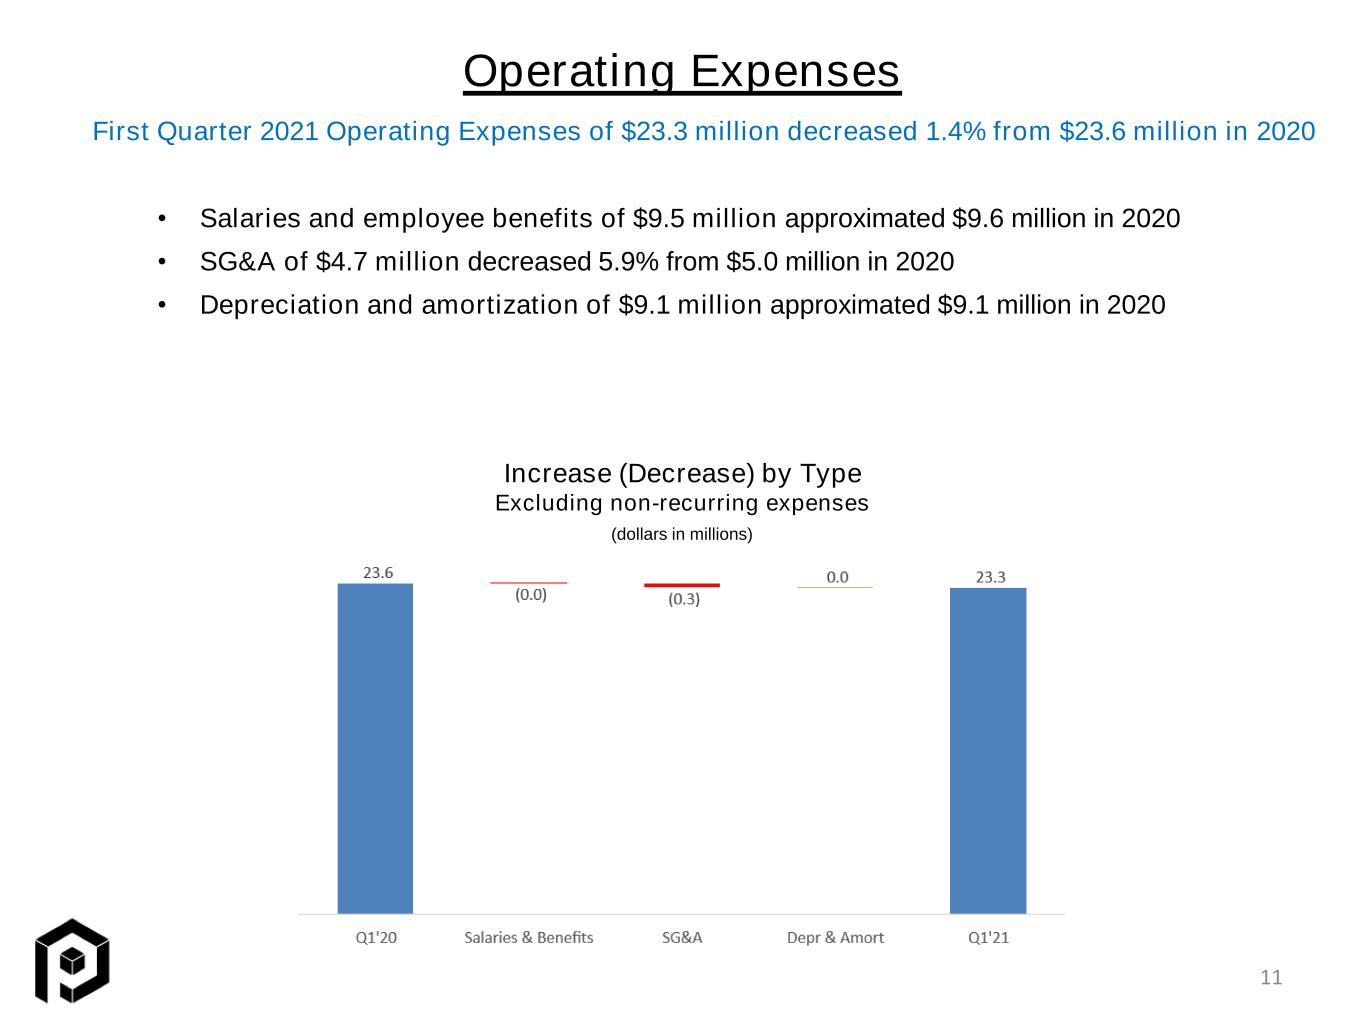
Operating Expenses • Salaries and employee benefits of $9.5 million approximated $9.6 million in 2020 • SG&A of $4.7 million decreased 5.9% from $5.0 million in 2020 • Depreciation and amortization of $9.1 million approximated $9.1 million in 2020 Increase (Decrease) by Type Excluding non-recurring expenses First Quarter 2021 Operating Expenses of $23.3 million decreased 1.4% from $23.6 million in 2020 (dollars in millions) 11
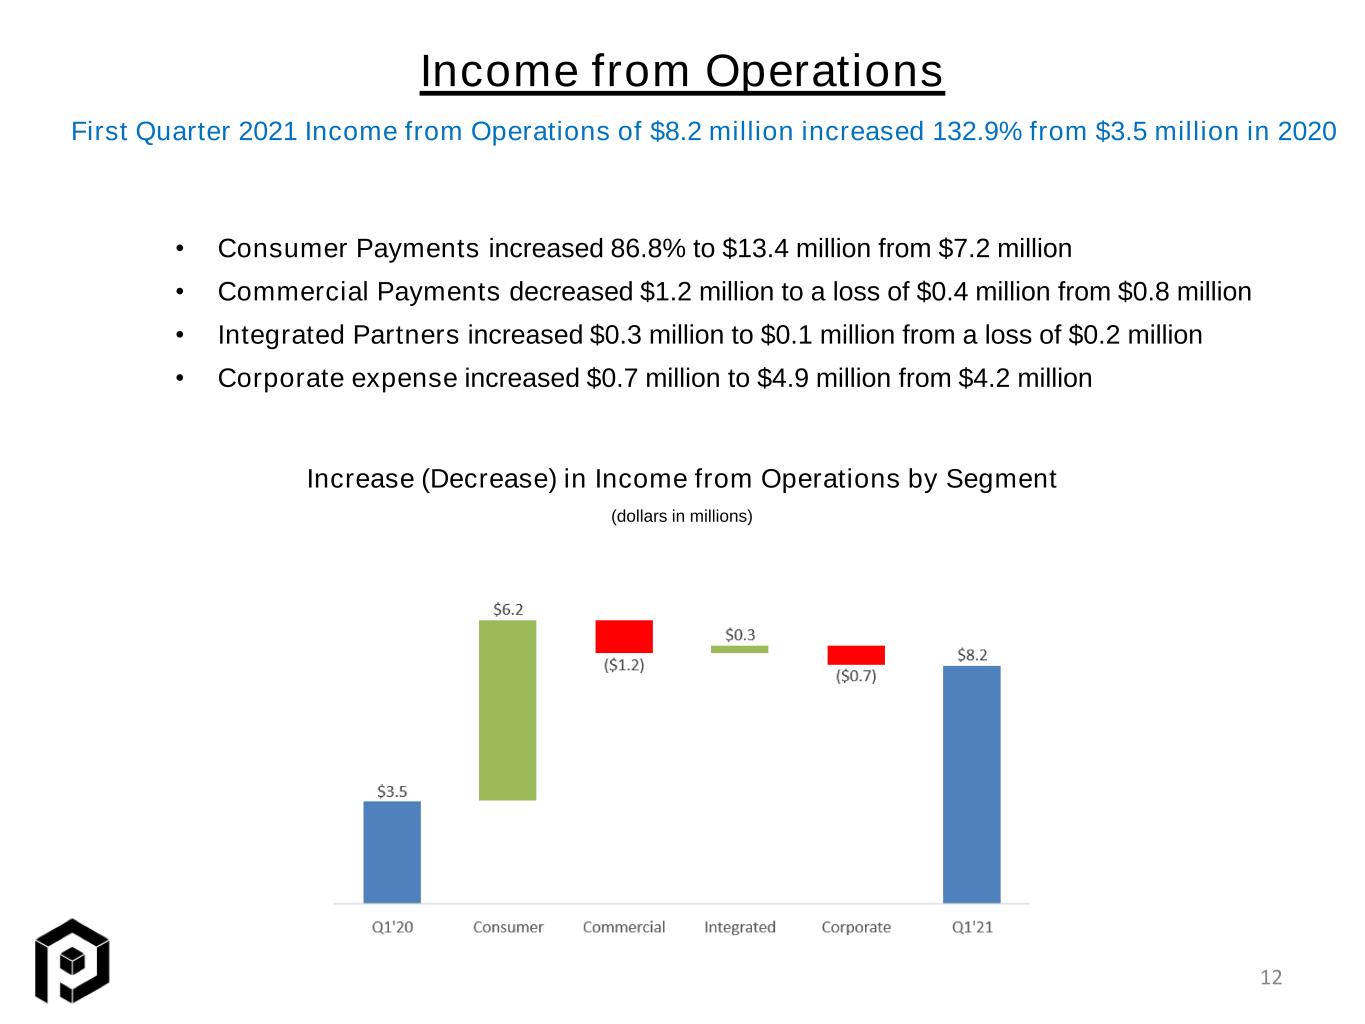
Income from Operations • Consumer Payments increased 86.8% to $13.4 million from $7.2 million • Commercial Payments decreased $1.2 million to a loss of $0.4 million from $0.8 million • Integrated Partners increased $0.3 million to $0.1 million from a loss of $0.2 million • Corporate expense increased $0.7 million to $4.9 million from $4.2 million First Quarter 2021 Income from Operations of $8.2 million increased 132.9% from $3.5 million in 2020 Increase (Decrease) in Income from Operations by Segment (dollars in millions) 12
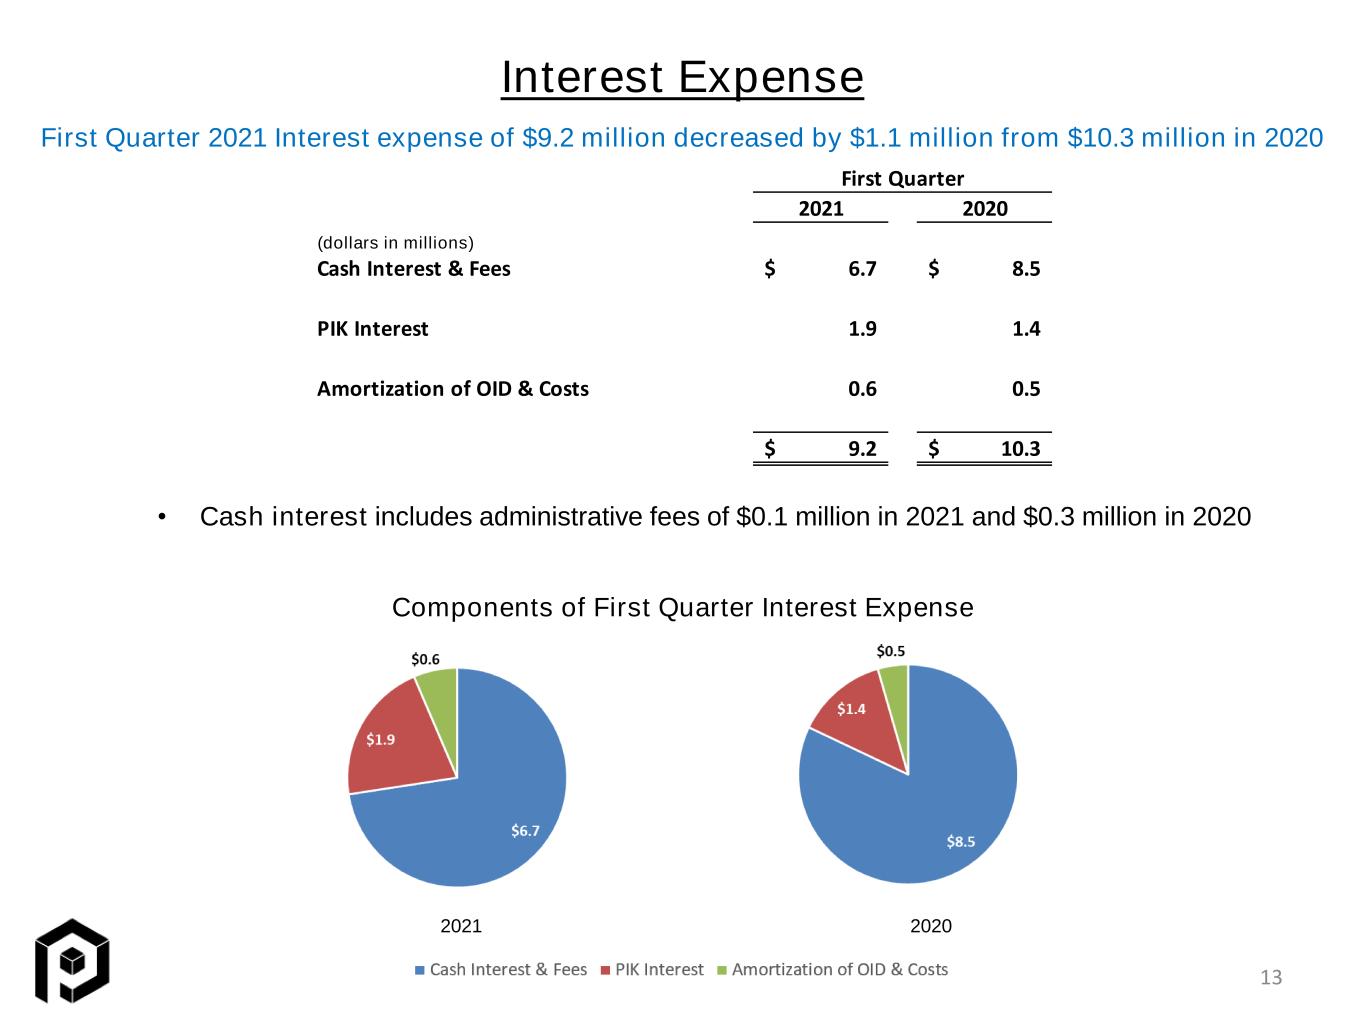
First Quarter 2021 2020 Cash Interest & Fees 6.7$ 8.5$ PIK Interest 1.9 1.4 Amortization of OID & Costs 0.6 0.5 9.2$ 10.3$ • Cash interest includes administrative fees of $0.1 million in 2021 and $0.3 million in 2020 Interest Expense First Quarter 2021 Interest expense of $9.2 million decreased by $1.1 million from $10.3 million in 2020 2021 2020 (dollars in millions) Components of First Quarter Interest Expense 13
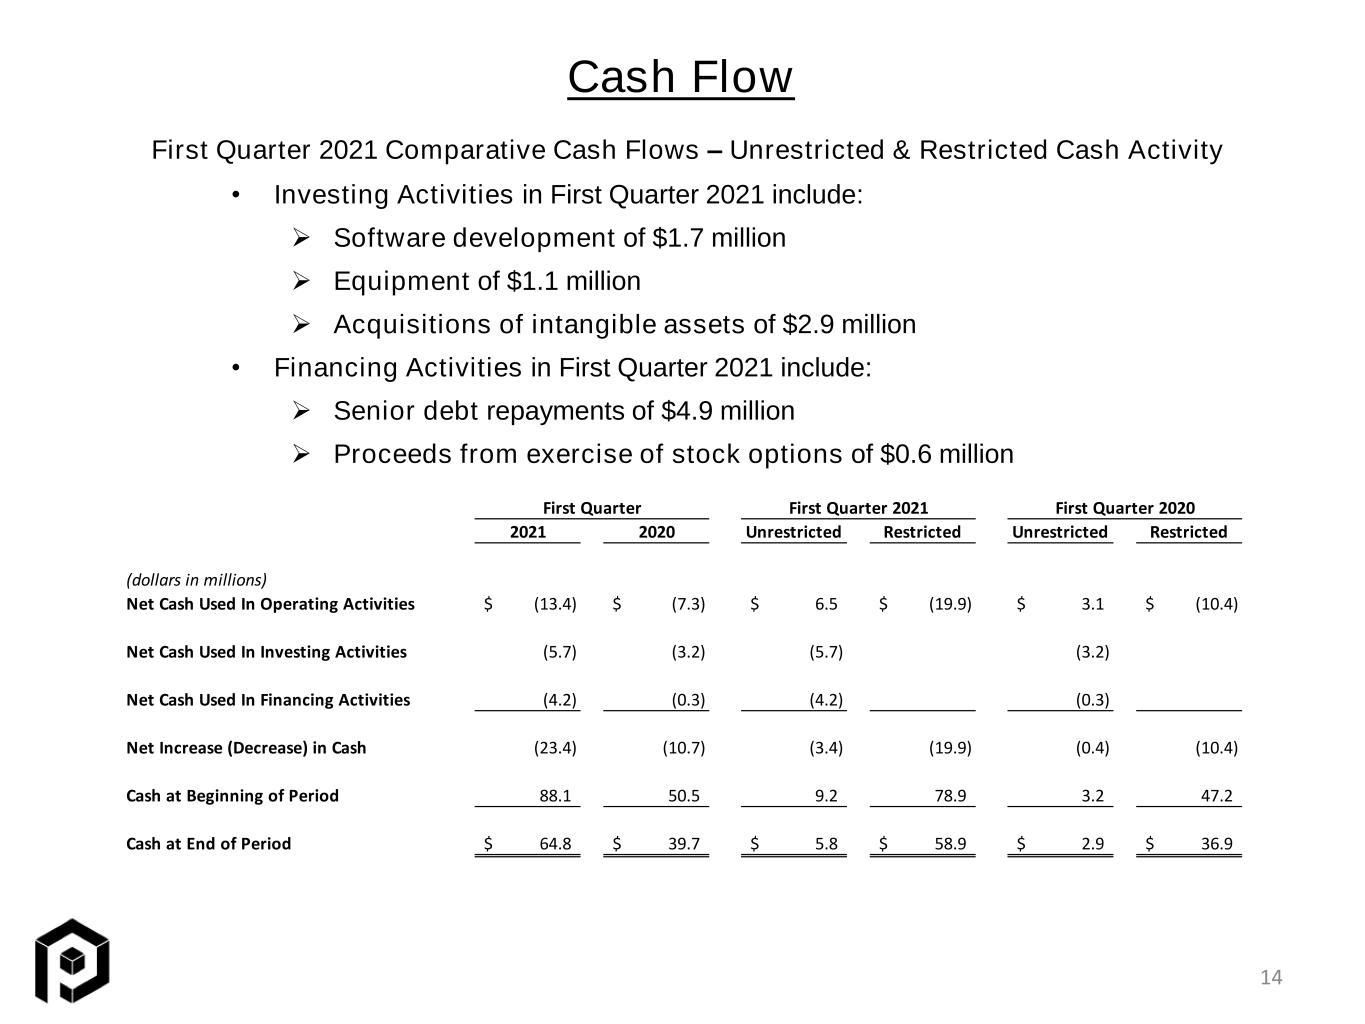
Cash Flow First Quarter 2021 Comparative Cash Flows – Unrestricted & Restricted Cash Activity • Investing Activities in First Quarter 2021 include: ➢ Software development of $1.7 million ➢ Equipment of $1.1 million ➢ Acquisitions of intangible assets of $2.9 million • Financing Activities in First Quarter 2021 include: ➢ Senior debt repayments of $4.9 million ➢ Proceeds from exercise of stock options of $0.6 million 14 First Quarter First Quarter 2021 First Quarter 2020 2021 2020 Unrestricted Restricted Unrestricted Restricted (dollars in millions) Net Cash Used In Operating Activities (13.4)$ (7.3)$ 6.5$ (19.9)$ 3.1$ (10.4)$ Net Cash Used In Investing Activities (5.7) (3.2) (5.7) (3.2) Net Cash Used In Financing Activities (4.2) (0.3) (4.2) (0.3) Net Increase (Decrease) in Cash (23.4) (10.7) (3.4) (19.9) (0.4) (10.4) Cash at Beginning of Period 88.1 50.5 9.2 78.9 3.2 47.2 Cash at End of Period 64.8$ 39.7$ 5.8$ 58.9$ 2.9$ 36.9$
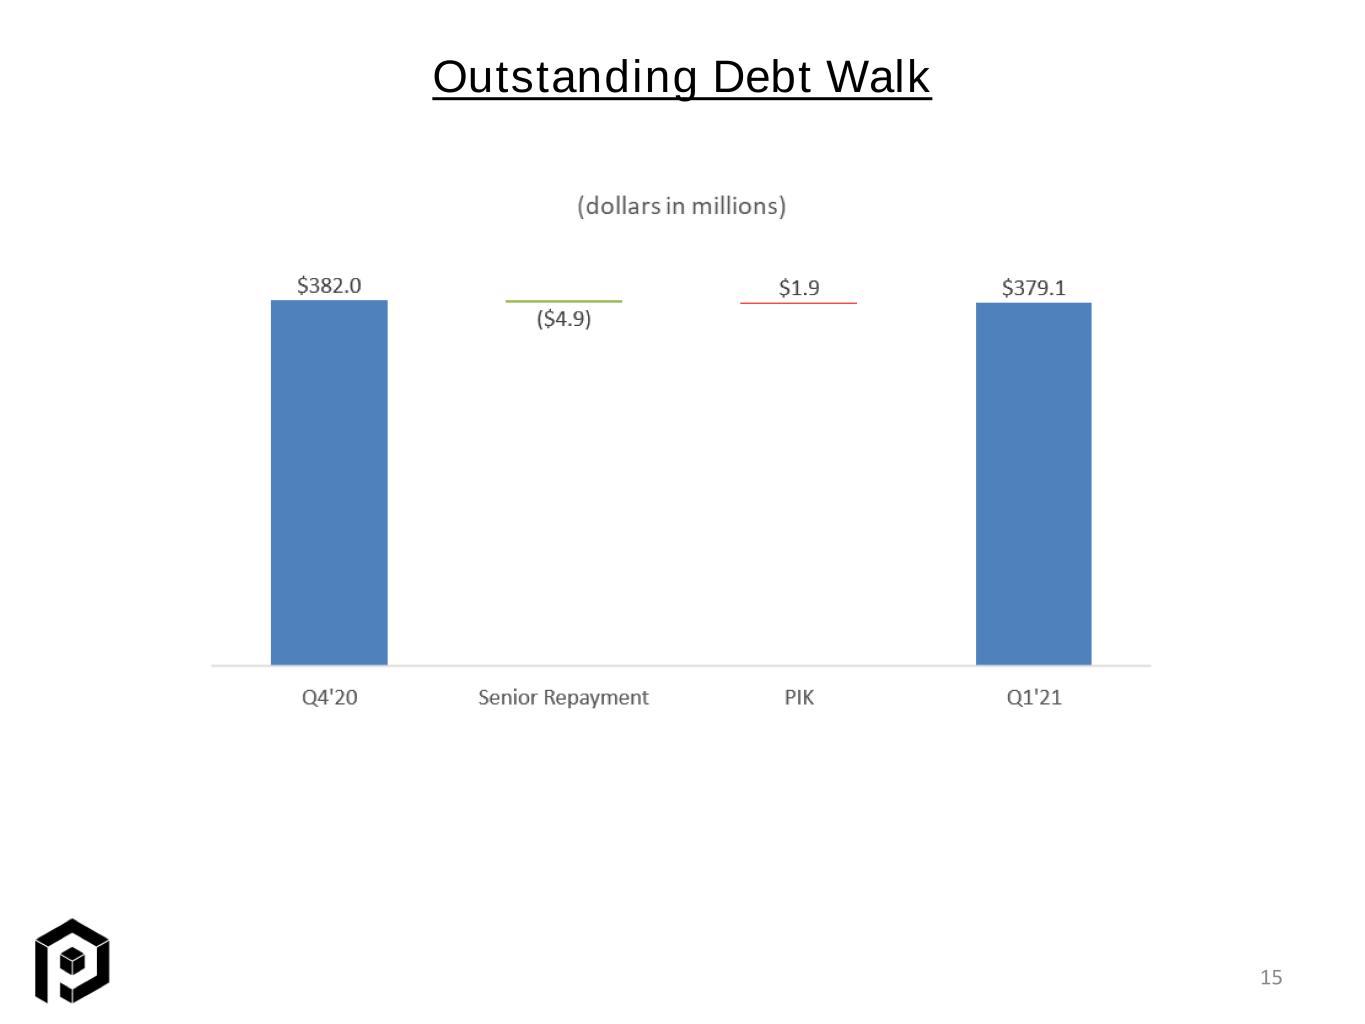
15 Outstanding Debt Walk
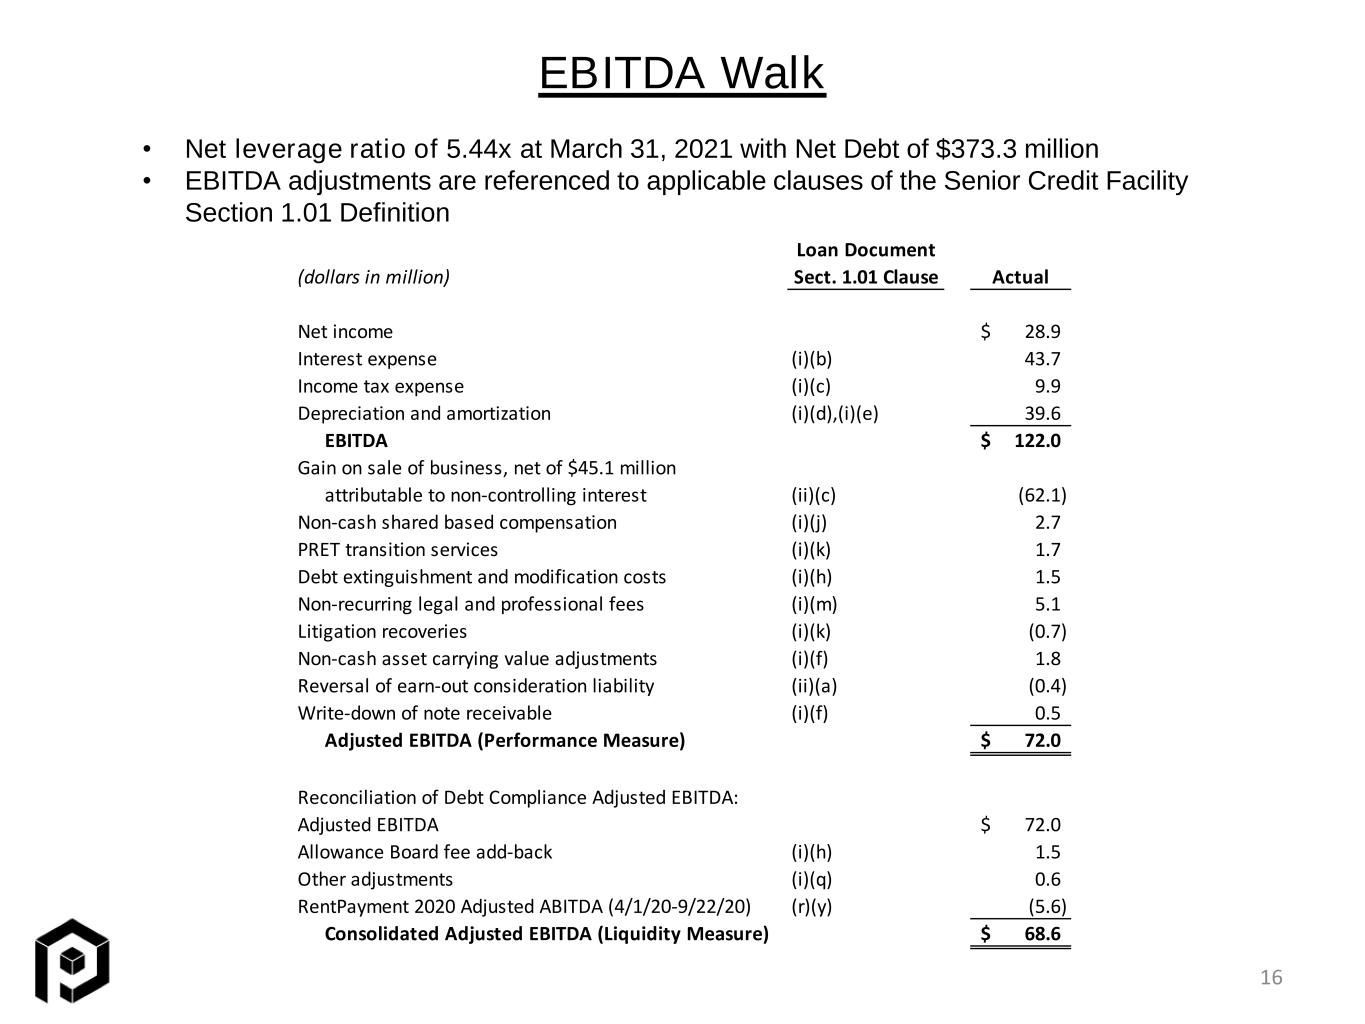
Loan Document (dollars in million) Sect. 1.01 Clause Actual Net income 28.9$ Interest expense (i)(b) 43.7 Income tax expense (i)(c) 9.9 Depreciation and amortization (i)(d),(i)(e) 39.6 EBITDA 122.0$ Gain on sale of business, net of $45.1 million attributable to non-controlling interest (ii)(c) (62.1) Non-cash shared based compensation (i)(j) 2.7 PRET transition services (i)(k) 1.7 Debt extinguishment and modification costs (i)(h) 1.5 Non-recurring legal and professional fees (i)(m) 5.1 Litigation recoveries (i)(k) (0.7) Non-cash asset carrying value adjustments (i)(f) 1.8 Reversal of earn-out consideration liability (ii)(a) (0.4) Write-down of note receivable (i)(f) 0.5 Adjusted EBITDA (Performance Measure) 72.0$ Reconciliation of Debt Compliance Adjusted EBITDA: Adjusted EBITDA 72.0$ Allowance Board fee add-back (i)(h) 1.5 Other adjustments (i)(q) 0.6 RentPayment 2020 Adjusted ABITDA (4/1/20-9/22/20) (r)(y) (5.6) Consolidated Adjusted EBITDA (Liquidity Measure) 68.6$ EBITDA Walk 16 • Net leverage ratio of 5.44x at March 31, 2021 with Net Debt of $373.3 million • EBITDA adjustments are referenced to applicable clauses of the Senior Credit Facility Section 1.01 Definition
