Attached files
| file | filename |
|---|---|
| EX-32.2 - EX-32.2 - Heritage Global Inc. | hgbl-ex322_7.htm |
| EX-32.1 - EX-32.1 - Heritage Global Inc. | hgbl-ex321_8.htm |
| EX-31.2 - EX-31.2 - Heritage Global Inc. | hgbl-ex312_9.htm |
| EX-31.1 - EX-31.1 - Heritage Global Inc. | hgbl-ex311_6.htm |
| EX-10.6 - EX-10.6 - Heritage Global Inc. | hgbl-ex106_187.htm |
| EX-10.5 - EX-10.5 - Heritage Global Inc. | hgbl-ex105_186.htm |
| EX-10.4 - EX-10.4 - Heritage Global Inc. | hgbl-ex104_189.htm |
| EX-10.3 - EX-10.3 - Heritage Global Inc. | hgbl-ex103_188.htm |
| EX-10.2 - EX-10.2 - Heritage Global Inc. | hgbl-ex102_185.htm |
| EX-10.1 - EX-10.1 - Heritage Global Inc. | hgbl-ex101_84.htm |
UNITED STATES
SECURITIES AND EXCHANGE COMMISSION
WASHINGTON, D.C. 20549
FORM 10-Q
|
☒ |
QUARTERLY REPORT PURSUANT TO SECTION 13 OR 15(d) OF THE SECURITIES EXCHANGE ACT OF 1934 |
For the quarterly period ended March 31, 2021
OR
|
☐ |
TRANSITION REPORT PURSUANT TO SECTION 13 OR 15(d) OF THE SECURITIES EXCHANGE ACT OF 1934 |
For the transition period from to
Commission file number: 001-39471
Heritage Global Inc.
(Exact name of registrant as specified in its charter)
|
Florida |
59-2291344 |
|
(State or Other Jurisdiction of |
(I.R.S. Employer Identification No.) |
12625 High Bluff Drive, Suite 305, San Diego, CA 92130
(Address of Principal Executive Offices)
(858) 847-0659
(Registrant’s Telephone Number)
N/A
(Registrant’s Former Name)
Securities registered pursuant to Section 12(b) of the Act:
|
Title of each class |
Trading Symbol(s) |
Name of each exchange on which registered |
|
Common stock, $0.01 par value |
HGBL |
Nasdaq Stock Market LLC |
Indicate by check mark whether the registrant (1) has filed all reports required to be filed by Section 13 or 15(d) of the Securities Exchange Act of 1934 during the preceding 12 months (or for such shorter period that the registrant was required to file such reports), and (2) has been subject to such filing requirements for the past 90 days. Yes ☒ No ☐
Indicate by check mark whether the registrant has submitted electronically every Interactive Data File required to be submitted pursuant to Rule 405 of Regulation S-T (§ 232.405 of this chapter) during the preceding 12 months (or for such shorter period that the registrant was required to submit such files). Yes ☒ No ☐
Indicate by check mark whether the registrant is a large accelerated filer, an accelerated filer, a non-accelerated filer, smaller reporting company, or an emerging growth company. See the definitions of “large accelerated filer,” “accelerated filer,” “smaller reporting company,” and “emerging growth company” in Rule 12b-2 of the Exchange Act.
|
Large Accelerated Filer |
☐ |
|
Accelerated Filer |
☐ |
|
Non-Accelerated Filer |
☒ |
|
Smaller reporting company |
☒ |
|
|
|
|
Emerging growth company |
☐ |
If an emerging growth company, indicate by check mark if the registrant has elected not to use the extended transition period for complying with any new or revised financial accounting standards provided pursuant to Section 13(a) of the Exchange Act. ☐
Indicate by check mark whether the registrant is a shell company (as defined in Rule 12b-2 of the Exchange Act). Yes ☐ No ☒
As of May 1, 2021, there were 35,672,477 shares of common stock, $0.01 par value, outstanding.
TABLE OF CONTENTS
|
Part I. |
4 |
|
|
|
|
|
|
Item 1. |
4 |
|
|
|
|
|
|
|
Condensed Consolidated Balance Sheets as of March 31, 2021 (unaudited) and December 31, 2020 |
4 |
|
|
|
|
|
|
5 |
|
|
|
|
|
|
|
6 |
|
|
|
|
|
|
|
7 |
|
|
|
|
|
|
|
8 |
|
|
|
|
|
|
Item 2. |
Management’s Discussion and Analysis of Financial Condition and Results of Operations |
19 |
|
|
|
|
|
Item 3. |
29 |
|
|
|
|
|
|
Item 4. |
29 |
|
|
|
|
|
|
Part II. |
30 |
|
|
|
|
|
|
Item 1. |
30 |
|
|
|
|
|
|
Item 1A. |
30 |
|
|
|
|
|
|
Item 2. |
30 |
|
|
|
|
|
|
Item 3. |
30 |
|
|
|
|
|
|
Item 4. |
30 |
|
|
|
|
|
|
Item 5. |
30 |
|
|
|
|
|
|
Item 6. |
31 |
3
PART I – FINANCIAL INFORMATION
Item 1 – Financial Statements.
HERITAGE GLOBAL INC.
CONDENSED CONSOLIDATED BALANCE SHEETS
(In thousands of US dollars, except share and per share amounts)
|
|
|
March 31, 2021 |
|
|
December 31, 2020 |
|
||
|
|
|
(unaudited) |
|
|
|
|
|
|
|
ASSETS |
|
|
|
|
|
|
|
|
|
Current assets: |
|
|
|
|
|
|
|
|
|
Cash and cash equivalents |
|
$ |
15,852 |
|
|
$ |
23,385 |
|
|
Accounts receivable |
|
|
2,297 |
|
|
|
1,496 |
|
|
Current portion of notes receivable, net |
|
|
2,036 |
|
|
|
1,338 |
|
|
Inventory – equipment |
|
|
91 |
|
|
|
235 |
|
|
Other current assets |
|
|
447 |
|
|
|
498 |
|
|
Total current assets |
|
|
20,723 |
|
|
|
26,952 |
|
|
Non-current portion of notes receivable, net |
|
|
1,565 |
|
|
|
748 |
|
|
Equity method investments |
|
|
2,402 |
|
|
|
2,402 |
|
|
Right-of-use assets |
|
|
830 |
|
|
|
963 |
|
|
Property and equipment, net |
|
|
132 |
|
|
|
130 |
|
|
Intangible assets, net |
|
|
3,056 |
|
|
|
3,123 |
|
|
Goodwill |
|
|
5,585 |
|
|
|
5,585 |
|
|
Deferred tax assets |
|
|
4,450 |
|
|
|
4,402 |
|
|
Other assets |
|
|
246 |
|
|
|
250 |
|
|
Total assets |
|
$ |
38,989 |
|
|
$ |
44,555 |
|
|
|
|
|
|
|
|
|
|
|
|
LIABILITIES AND STOCKHOLDERS’ EQUITY |
|
|
|
|
|
|
|
|
|
Current liabilities: |
|
|
|
|
|
|
|
|
|
Accounts payable and accrued liabilities |
|
$ |
7,202 |
|
|
$ |
13,609 |
|
|
Current portion of lease liabilities |
|
|
301 |
|
|
|
380 |
|
|
Total current liabilities |
|
|
7,503 |
|
|
|
13,989 |
|
|
Non-current portion of lease liabilities |
|
|
564 |
|
|
|
623 |
|
|
Total liabilities |
|
|
8,067 |
|
|
|
14,612 |
|
|
|
|
|
|
|
|
|
|
|
|
Stockholders’ equity: |
|
|
|
|
|
|
|
|
|
Preferred stock, $10.00 par value, authorized 10,000,000 shares; issued and outstanding 568 shares of Series N as of March 31, 2021 and December 31, 2020 |
|
|
6 |
|
|
|
6 |
|
|
Common stock, $0.01 par value, authorized 300,000,000 shares; issued and outstanding 35,647,477 shares as of March 31, 2021 and 35,281,183 as of December 31, 2020 |
|
|
357 |
|
|
|
353 |
|
|
Additional paid-in capital |
|
|
293,343 |
|
|
|
293,400 |
|
|
Accumulated deficit |
|
|
(262,784 |
) |
|
|
(263,816 |
) |
|
Total stockholders’ equity |
|
|
30,922 |
|
|
|
29,943 |
|
|
Total liabilities and stockholders’ equity |
|
$ |
38,989 |
|
|
$ |
44,555 |
|
The accompanying notes are an integral part of these condensed consolidated financial statements.
4
HERITAGE GLOBAL INC.
CONDENSED CONSOLIDATED STATEMENTS OF INCOME
(In thousands of US dollars, except share and per share amounts)
(unaudited)
|
|
|
Three Months Ended March 31, |
|
|||||
|
|
|
2021 |
|
|
2020 |
|
||
|
Revenues: |
|
|
|
|
|
|
|
|
|
Services revenue |
|
$ |
5,030 |
|
|
$ |
4,088 |
|
|
Asset sales |
|
|
2,071 |
|
|
|
156 |
|
|
Total revenues |
|
|
7,101 |
|
|
|
4,244 |
|
|
|
|
|
|
|
|
|
|
|
|
Operating costs and expenses: |
|
|
|
|
|
|
|
|
|
Cost of services revenue |
|
|
1,175 |
|
|
|
551 |
|
|
Cost of asset sales |
|
|
820 |
|
|
|
38 |
|
|
Selling, general and administrative |
|
|
3,969 |
|
|
|
3,472 |
|
|
Depreciation and amortization |
|
|
91 |
|
|
|
90 |
|
|
Total operating costs and expenses |
|
|
6,055 |
|
|
|
4,151 |
|
|
Earnings of equity method investments |
|
|
— |
|
|
|
1 |
|
|
Operating income |
|
|
1,046 |
|
|
|
94 |
|
|
Interest and other expense, net |
|
|
3 |
|
|
|
(27 |
) |
|
Income before income tax expense |
|
|
1,049 |
|
|
|
67 |
|
|
Income tax expense |
|
|
17 |
|
|
|
29 |
|
|
Net income |
|
$ |
1,032 |
|
|
$ |
38 |
|
|
|
|
|
|
|
|
|
|
|
|
Weighted average common shares outstanding – basic |
|
|
34,788,016 |
|
|
|
28,751,689 |
|
|
Weighted average common shares outstanding – diluted |
|
|
37,533,065 |
|
|
|
30,200,114 |
|
|
Net income per share – basic |
|
$ |
0.03 |
|
|
$ |
0.00 |
|
|
Net income per share – diluted |
|
$ |
0.03 |
|
|
$ |
0.00 |
|
The accompanying notes are an integral part of these condensed consolidated financial statements.
5
HERITAGE GLOBAL INC.
CONDENSED CONSOLIDATED STATEMENTS OF STOCKHOLDERS’ EQUITY
(In thousands of US dollars, except share amounts)
(unaudited)
|
|
|
|
|
|
|
|
|
|
|
|
|
|
Additional |
|
|
|
|
|
|
Accumulated other |
|
|
|
|
|
|||||||
|
|
|
Preferred stock |
|
|
Common stock |
|
|
paid-in |
|
|
Accumulated |
|
|
comprehensive |
|
|
|
|
|
|||||||||||||
|
|
|
Shares |
|
|
Amount |
|
|
Shares |
|
|
Amount |
|
|
capital |
|
|
deficit |
|
|
loss |
|
|
Total |
|
||||||||
|
Balance as of December 31, 2020 |
|
|
568 |
|
|
$ |
6 |
|
|
|
35,281,183 |
|
|
$ |
353 |
|
|
$ |
293,400 |
|
|
$ |
(263,816 |
) |
|
$ |
— |
|
|
$ |
29,943 |
|
|
Issuance of common stock from stock option awards |
|
|
— |
|
|
|
— |
|
|
|
366,294 |
|
|
|
4 |
|
|
|
(124 |
) |
|
|
— |
|
|
|
— |
|
|
|
(120 |
) |
|
Stock-based compensation expense |
|
|
— |
|
|
|
— |
|
|
|
— |
|
|
|
— |
|
|
|
67 |
|
|
|
— |
|
|
|
— |
|
|
|
67 |
|
|
Net income |
|
|
— |
|
|
|
— |
|
|
|
— |
|
|
|
— |
|
|
|
— |
|
|
|
1,032 |
|
|
|
— |
|
|
|
1,032 |
|
|
Balance as of March 31, 2021 |
|
|
568 |
|
|
$ |
6 |
|
|
|
35,647,477 |
|
|
$ |
357 |
|
|
$ |
293,343 |
|
|
$ |
(262,784 |
) |
|
$ |
— |
|
|
$ |
30,922 |
|
|
|
|
|
|
|
|
|
|
|
|
|
|
|
Additional |
|
|
|
|
|
|
Accumulated other |
|
|
|
|
|
|||||||
|
|
|
Preferred stock |
|
|
Common stock |
|
|
paid-in |
|
|
Accumulated |
|
|
comprehensive |
|
|
|
|
|
|||||||||||||
|
|
|
Shares |
|
|
Amount |
|
|
Shares |
|
|
Amount |
|
|
capital |
|
|
deficit |
|
|
loss |
|
|
Total |
|
||||||||
|
Balance as of December 31, 2019 |
|
|
568 |
|
|
$ |
6 |
|
|
|
29,339,101 |
|
|
$ |
293 |
|
|
$ |
285,099 |
|
|
$ |
(273,474 |
) |
|
$ |
(77 |
) |
|
$ |
11,847 |
|
|
Issuance of common stock from stock option awards |
|
|
— |
|
|
|
— |
|
|
|
19,805 |
|
|
|
1 |
|
|
|
(3 |
) |
|
|
— |
|
|
|
— |
|
|
|
(2 |
) |
|
Stock-based compensation expense |
|
|
— |
|
|
|
— |
|
|
|
— |
|
|
|
— |
|
|
|
75 |
|
|
|
— |
|
|
|
— |
|
|
|
75 |
|
|
Net income |
|
|
— |
|
|
|
— |
|
|
|
— |
|
|
|
— |
|
|
|
— |
|
|
|
38 |
|
|
|
— |
|
|
|
38 |
|
|
Balance as of March 31, 2020 |
|
|
568 |
|
|
$ |
6 |
|
|
|
29,358,906 |
|
|
$ |
294 |
|
|
$ |
285,171 |
|
|
$ |
(273,436 |
) |
|
$ |
(77 |
) |
|
$ |
11,958 |
|
The accompanying notes are an integral part of these condensed consolidated financial statements.
6
HERITAGE GLOBAL INC.
CONDENSED CONSOLIDATED STATEMENTS OF CASH FLOWS
(In thousands of US dollars)
(unaudited)
|
|
|
March 31, |
|
|||||
|
|
|
2021 |
|
|
2020 |
|
||
|
Cash flows used in operating activities: |
|
|
|
|
|
|
|
|
|
Net income |
|
$ |
1,032 |
|
|
$ |
38 |
|
|
Adjustments to reconcile net income to net cash used in operating activities: |
|
|
|
|
|
|
|
|
|
Amortization of deferred issuance costs and fees |
|
|
49 |
|
|
|
59 |
|
|
Earnings of equity method investments |
|
|
— |
|
|
|
(1 |
) |
|
Noncash lease expense |
|
|
133 |
|
|
|
131 |
|
|
Depreciation and amortization |
|
|
91 |
|
|
|
90 |
|
|
Deferred taxes |
|
|
(48 |
) |
|
|
43 |
|
|
Stock-based compensation expense |
|
|
143 |
|
|
|
75 |
|
|
Changes in operating assets and liabilities: |
|
|
|
|
|
|
|
|
|
Accounts receivable |
|
|
(801 |
) |
|
|
160 |
|
|
Inventory – equipment |
|
|
144 |
|
|
|
(114 |
) |
|
Other assets |
|
|
55 |
|
|
|
(333 |
) |
|
Accounts payable and accrued liabilities |
|
|
(6,485 |
) |
|
|
(132 |
) |
|
Lease liabilities |
|
|
(140 |
) |
|
|
(134 |
) |
|
Net cash used in operating activities |
|
|
(5,827 |
) |
|
|
(118 |
) |
|
|
|
|
|
|
|
|
|
|
|
Cash flows (used in) provided by investing activities: |
|
|
|
|
|
|
|
|
|
Investment in notes receivable |
|
|
(2,494 |
) |
|
|
(3,580 |
) |
|
Payments received on notes receivable |
|
|
929 |
|
|
|
421 |
|
|
Cash received on transfer of notes receivable to partners |
|
|
— |
|
|
|
3,994 |
|
|
Investment in equity method investments |
|
|
— |
|
|
|
(385 |
) |
|
Cash distributions from equity method investments |
|
|
— |
|
|
|
136 |
|
|
Purchase of property and equipment |
|
|
(23 |
) |
|
|
(5 |
) |
|
Net cash (used in) provided by investing activities |
|
|
(1,588 |
) |
|
|
581 |
|
|
|
|
|
|
|
|
|
|
|
|
Cash flows used in financing activities: |
|
|
|
|
|
|
|
|
|
Proceeds from debt payable to third party |
|
|
— |
|
|
|
4,425 |
|
|
Repayment of debt payable to third party |
|
|
— |
|
|
|
(4,523 |
) |
|
Proceeds from issuance of common stock from stock option awards |
|
|
85 |
|
|
|
— |
|
|
Payments of tax withholdings related to cashless exercises of stock option awards |
|
|
(203 |
) |
|
|
— |
|
|
Net cash used in financing activities |
|
|
(118 |
) |
|
|
(98 |
) |
|
Net (decrease) increase in cash and cash equivalents |
|
|
(7,533 |
) |
|
|
365 |
|
|
Cash and cash equivalents as of beginning of period |
|
|
23,385 |
|
|
|
2,728 |
|
|
Cash and cash equivalents as of end of period |
|
$ |
15,852 |
|
|
$ |
3,093 |
|
|
|
|
|
|
|
|
|
|
|
|
Supplemental cash flow information: |
|
|
|
|
|
|
|
|
|
Cash paid for taxes |
|
$ |
— |
|
|
$ |
2 |
|
|
Cash paid for interest |
|
|
— |
|
|
|
29 |
|
The accompanying notes are an integral part of these condensed consolidated financial statements.
7
HERITAGE GLOBAL INC.
NOTES TO CONDENSED CONSOLIDATED FINANCIAL STATEMENTS
(unaudited)
Note 1 –Basis of Presentation
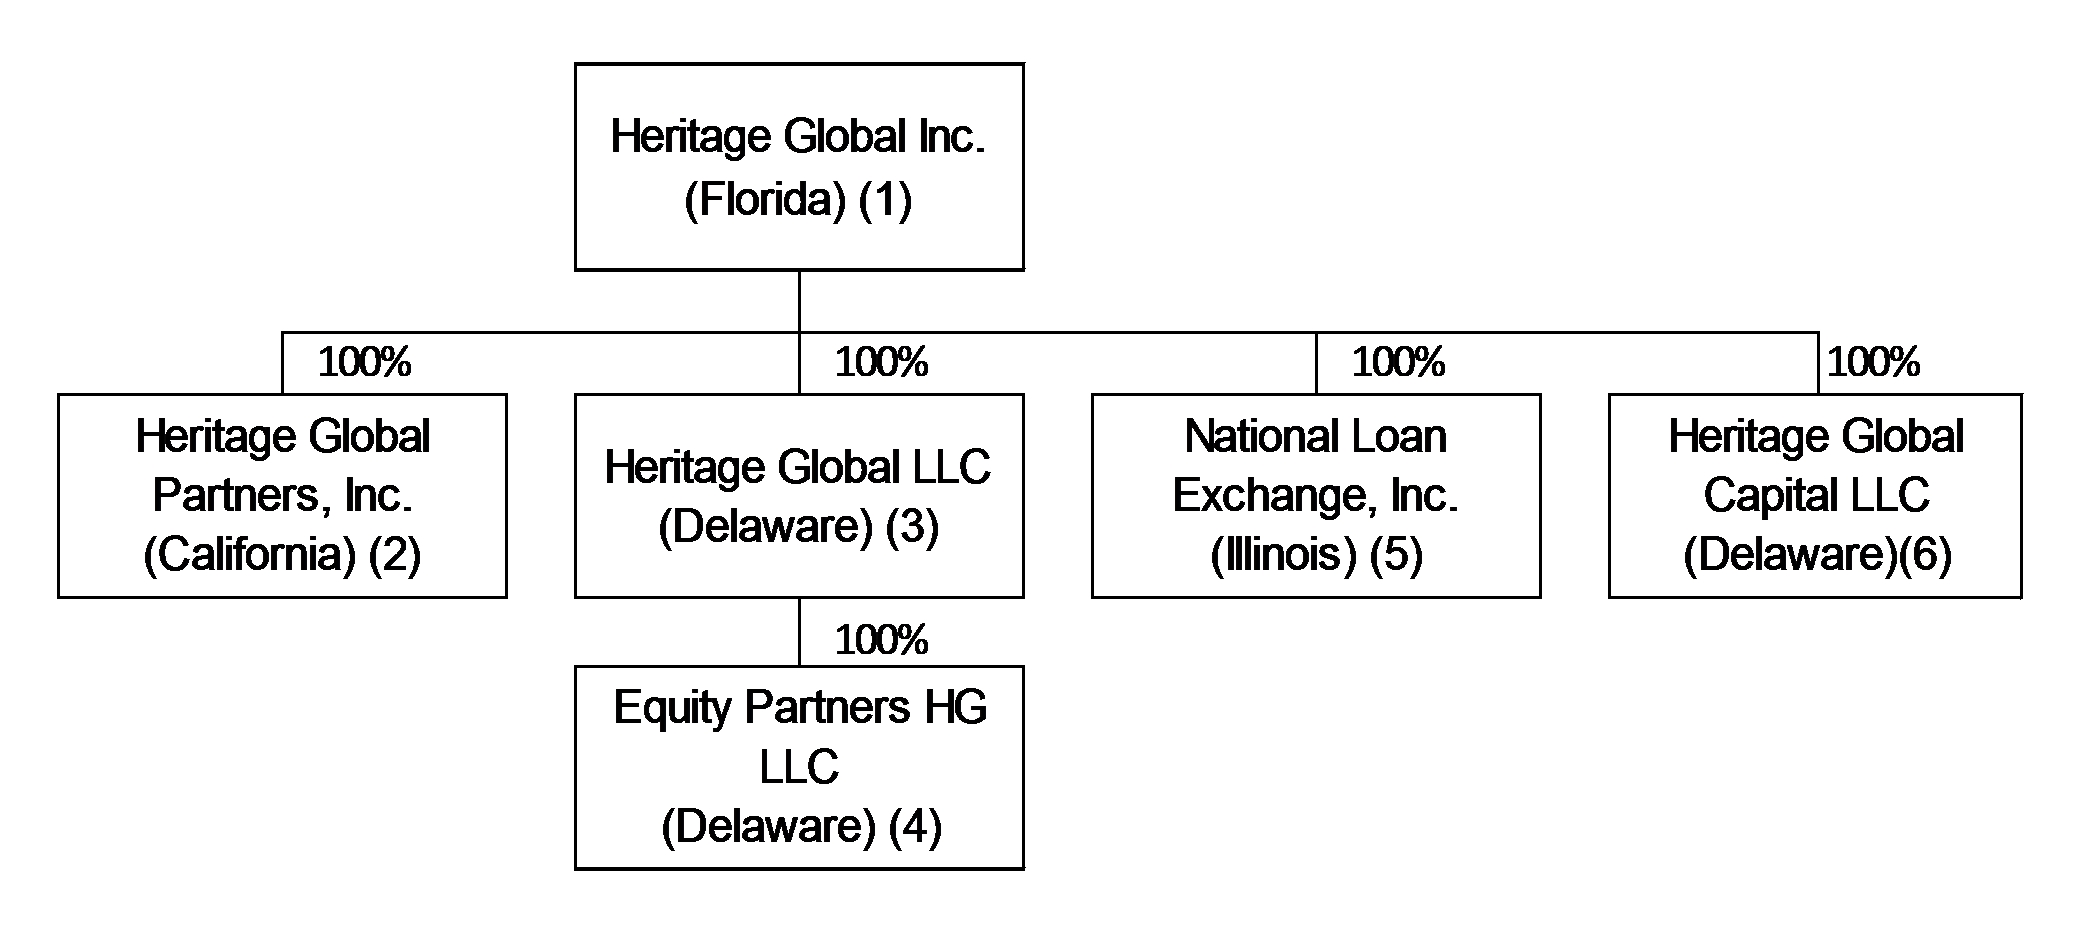
These unaudited condensed consolidated interim financial statements include the accounts of Heritage Global Inc. (“HGI”) together with its subsidiaries, including Heritage Global Partners, Inc. (“HGP”), Heritage Global LLC (“HG LLC”), Equity Partners HG LLC (“Equity Partners”), National Loan Exchange, Inc. (“NLEX”) and Heritage Global Capital LLC (“HGC”). These entities, collectively, are referred to as the “Company” in these financial statements. The Company’s unaudited condensed consolidated interim financial statements were prepared in conformity with generally accepted accounting principles in the United States of America (“GAAP”), as outlined in the Financial Accounting Standards Board (“FASB”) Accounting Standards Codification (“ASC”), and include the assets, liabilities, revenues, and expenses of all subsidiaries over which HGI exercises control. All significant intercompany accounts and transactions have been eliminated upon consolidation. The Company began its asset liquidation operations in 2009 with the establishment of HG LLC. The business was subsequently expanded by the acquisitions of Equity Partners, HGP and NLEX in 2011, 2012 and 2014, respectively, and the creation of HGC in 2019. As a result, HGI is positioned to provide an array of value-added capital and financial asset solutions: auction and appraisal services, traditional asset disposition sales, and specialty financing solutions. The Company’s reportable segments consist of the Industrial Assets Division and Financial Assets Division.
The Company has prepared the condensed consolidated interim financial statements included herein pursuant to the rules and regulations of the United States Securities and Exchange Commission (the “SEC”). In the opinion of management, these financial statements reflect all adjustments that are necessary to present fairly the results for the interim periods included herein. Certain information and footnote disclosures normally included in financial statements prepared in accordance with GAAP have been condensed or omitted pursuant to such rules and regulations; however, the Company believes that the disclosures are appropriate. These unaudited condensed consolidated interim financial statements should be read in conjunction with the audited consolidated financial statements and the notes thereto included in the Company’s Annual Report on Form 10-K for the year ended December 31, 2020, filed with the SEC on March 8, 2021 (the “Form 10-K”).
The results of operations for the three month period ended March 31, 2021 are not necessarily indicative of those operating results to be expected for any subsequent interim period or for the entire year ending December 31, 2021. The accompanying condensed consolidated balance sheet as of December 31, 2020 has been derived from the audited consolidated balance sheet as of December 31, 2020, contained in the Company’s Form 10-K.
COVID-19
The spread of the novel coronavirus (“COVID-19”) had a minor negative impact on the Company’s performance during the first quarter of 2021 due to evolving travel and work restrictions, stimulus payments and credit policies impacting debt sales, and a delay in the sale of certain assets.
Going forward, the Company does not believe the COVID-19 pandemic will have material negative impacts on the Company’s financial performance, as its asset liquidation business is highly concentrated in distressed and surplus assets and the Company expects that there will be an increased supply of distressed and surplus assets as a result of the COVID-19 pandemic and any downward trends in the overall economy, resulting in more potential for principal and fee based deals. The Company believes that the continuing disruptions to the global supply chain, particularly those involving industrial assets, will further increase demand for U.S.-based surplus assets. Further, the Company expects that the COVID-19 pandemic will have the following positive impacts:
•continued increase in demand for HGP’s online auctions as a result of ongoing social distancing requirements in connection with the COVID-19 pandemic;
•increased activity for NLEX and HGC due to expanding volumes of nonperforming and charged-off consumer loans;
•increased funding opportunities for HGC due to tightening underwriting standards at conventional lenders; and
•incremental valuation opportunities for our valuation business as a result of greater focus on collateral on bank balance sheets.
However, positive expected impacts of the COVID-19 pandemic on the Company could be offset, at least in part, by negative impacts on certain of its business units relying on nonperforming and charged-off consumer loans. Any continuation of stimulus
8
payments and additional credit policies impacting debt sales may result in delayed revenues depending on the scope and magnitude of such policies.
Note 2 – Summary of Significant Accounting Policies
Use of Estimates
The preparation of the Company’s consolidated financial statements in conformity with GAAP requires management to make estimates and assumptions that affect the reported amounts of assets and liabilities and the disclosure of contingent assets and liabilities at the date of the financial statements, as well as the reported amounts of revenues and expenses during the reporting period. Management bases its estimates and judgments on historical experience and various other factors that are believed to be reasonable under the circumstances. Actual results could differ from those estimates.
Significant estimates include the assessment of collectability of revenue recognized, and the valuation of accounts receivable, inventory, other assets, right-of-use assets, goodwill and intangible assets, liabilities, deferred income tax assets and liabilities including future years’ taxable income, and stock-based compensation. These estimates have the potential to significantly impact the Company’s consolidated financial statements, either because of the significance of the financial statement item to which they relate, or because they require judgment and estimation due to the uncertainty involved in measuring, at a specific point in time, events that are continuous in nature.
Reclassifications
Certain prior year balances within the condensed consolidated financial statements have been reclassified to conform to the current year presentation.
Revenue Recognition
Services revenue generally consists of commissions and fees from providing auction services, appraisals, brokering of sales transactions and providing merger and acquisition advisory services. Asset sales revenue generally consists of proceeds obtained through sales of purchased assets. Revenue is recognized for both services revenue and asset sales revenue based on the ASC 606 standard recognition model, which consists of the following: (1) an agreement exists between two or more parties that creates enforceable rights and obligations, (2) the performance obligations are clearly identified, (3) the transaction price has been determined, (4) the transaction price has been properly allocated to each performance obligation, and (5) the entity satisfies a performance obligation by transferring a promised good or service to a customer for each of the entities.
All services and asset sales revenue from contracts with customers is considered to be within the asset liquidation business, which consists of two reportable segments, the Industrial Assets Division and the Financial Assets Division. Generally, revenue is recognized in the asset liquidation business at the point in time in which the performance obligation has been satisfied and full consideration is received. The exception to recognition at a point in time occurs when certain contracts provide for advance payments recognized over a period of time. Services revenue recognized over a period of time is not material in comparison to the Company’s total revenues (less than 1% of total revenues for the three month period ended March 31, 2021) and, therefore, not reported on a disaggregated basis. Further, as certain contracts stipulate that the customer make advance payments, amounts not recognized within the reporting period are considered deferred revenue and the Company’s “contract liability.” As of March 31, 2021, the deferred revenue balance was approximately $21,000. Revenue is generally recognized in the period that the Company satisfies the performance obligation and cash is collected; however, in certain situations, the Company records receivables related to asset liquidation based on timing of payments for asset liquidation transactions held at the end of the reporting period. The Company does not record a “contract asset” for partially satisfied performance obligations.
The Company evaluates revenue from asset liquidation transactions in accordance with the accounting guidance to determine whether to report such revenue on a gross or net basis. The Company has determined that it acts as an agent for the Company’s fee based asset liquidation transactions, and, therefore, the Company reports the revenue from transactions in which it acts as an agent on a net basis.
The Company also earns asset liquidation income through asset liquidation transactions that involve the Company acting jointly with one or more additional purchasers, pursuant to a partnership, joint venture or limited liability company (“LLC”) agreement (collectively, “Joint Ventures”). For these transactions, in which the Company’s ownership share meets the criteria for the equity method investments under ASC 323, the Company does not record asset liquidation revenue or expense. Instead, the Company’s
9
proportionate share of the net income (loss) is reported as earnings of equity method investments. In general, the Joint Ventures apply the same revenue recognition and other accounting policies as the Company.
In 2019, the Company began providing specialty financing solutions to investors in charged-off and nonperforming asset portfolios. Fees collected in relation to the issuance of loans, which are included within services revenue, include loan origination fees, interest income, portfolio monitoring fees, and a backend profit share percentage related to the underlying asset portfolio.
The loan origination fees are offset with any direct origination costs and are deferred upon issuance of the loan and amortized over the lives of the related loans, as an adjustment to interest income. The interest method is used to arrive at a periodic interest cost (including amortization) that will represent a level effective rate on the sum of the face amount of the debt and (plus or minus) the unamortized premium or discount and expense at the beginning of each period.
The portfolio monitoring fees and the backend profit share percentage are considered a separate earnings process as compared to the origination fees and interest income. Portfolio monitoring fees are recorded at the agreed upon rate at the time in which payments are made by the borrower. The backend profit share percentage is recognized in accordance with the agreed upon rate at the time in which the amount is realizable and earned. The revenue recognition policy was established due to the uncertainty of timing of the amount of backend profit share percentage that will be realized, and the lack of historical precedent as this is a new business for the Company.
During the three months ended March 31, 2021 and 2020, the Company generated revenues specific to one customer representing 10% and 19% of total revenues, respectively.
Leases
The Company is obligated to make future payments under existing lease agreements that (1) specifically identify the asset, and (2) convey the right to control the use of the identified asset in exchange for consideration for a period of time. The Company determines whether a contract is a lease at the inception of the arrangement. We evaluate leasing arrangements in accordance with the accounting guidance to determine whether the contract is operating or financing in nature. Leases with an initial term of 12 months or less, or under predefined thresholds, are not recorded on the condensed consolidated balance sheet. Lease expense for these leases is recognized on a straight-line basis over the lease term.
The critical accounting policies used in the preparation of the Company’s audited consolidated financial statements are discussed in the Company’s Form 10-K. There have been no changes to these policies in the three months ended March 31, 2021.
Recent Accounting Pronouncements
In 2019, the FASB issued ASU 2019-12, Income Taxes (Topic 740): Simplifying the Accounting for Income Taxes (“ASU 2019-12”), which simplifies the accounting for income taxes. The amendments in this update are effective for fiscal years, and interim periods within those fiscal years, beginning after December 15, 2020. ASU 2019-12 became effective January 1, 2021 and did not have a material impact on our consolidated financial statements.
In 2016, the FASB issued ASU 2016-13, Financial Instruments – Credit Losses (“ASU 2016-13”), which applies a current expected credit loss model which is a new impairment model based on expected losses rather than incurred losses. The expected credit losses, and subsequent adjustments to such losses, will be recorded through an allowance account that is deducted from, or added to, the amortized cost basis of the financial asset, with the net carrying value of the financial asset presented on the consolidated balance sheet at the amount expected to be collected. ASU 2016-13 eliminates the current accounting model for loans and debt securities acquired with deteriorated credit quality under ASC 310-30, which provides authoritative guidance for the accounting of the Company’s notes receivable. With respect to smaller reporting companies, the amendments in this update are effective for fiscal years beginning after December 15, 2022, including interim periods within those fiscal years. We are currently evaluating the impact of the new guidance on our consolidated financial statements.
10
Note 3 – Notes Receivable, net
The Company’s notes receivable balance consists of loans to buyers of charged-off receivable portfolios which resulted in a total outstanding principal balance as of March 31, 2021 of approximately $3.6 million, net of unamortized deferred fees and costs on originated loans. As of December 31, 2020, the Company’s notes receivable balance was $2.1 million, net of unamortized deferred fees and costs on originated loans. The activity during the three months ended March 31, 2021 includes the issuance of additional notes of approximately $2.5 million, principal payments made by borrowers of approximately $0.9 million, and adjustments to our deferred fees and costs balance of approximately $0.1 million.
As of March 31, 2021, the Company has not recorded an allowance for credit losses related to notes receivable outstanding.
Note 4 – Stock-based Compensation
Options
As of March 31, 2021, the Company had four stock-based compensation plans, which are described more fully in Note 16 to the audited consolidated financial statements for the year ended December 31, 2020, contained in the Company’s Form 10-K.
During the three months ended March 31, 2021, the Company issued options to purchase 30,000 shares of common stock to certain of the Company’s employees and options to purchase 50,000 shares of common stock to the Company’s non-employee directors as part of their annual compensation.
The following summarizes the changes in common stock options for the three months ended March 31, 2021:
|
|
|
Options |
|
|
Weighted Average Exercise Price |
|
||
|
Outstanding as of December 31, 2020 |
|
|
3,516,225 |
|
|
$ |
0.63 |
|
|
Granted |
|
|
80,000 |
|
|
$ |
3.03 |
|
|
Exercised |
|
|
(492,875 |
) |
|
$ |
0.49 |
|
|
Outstanding as of March 31, 2021 |
|
|
3,103,350 |
|
|
$ |
0.71 |
|
|
|
|
|
|
|
|
|
|
|
|
Options exercisable as of March 31, 2021 |
|
|
2,183,537 |
|
|
$ |
0.47 |
|
The Company recognized stock-based compensation expense related to common stock options of $0.1 million for the three months ended March 31, 2021. As of March 31, 2021, there was approximately $0.7 million of unrecognized stock-based compensation expense related to unvested common stock options outstanding, which is expected to be recognized over a weighted average period of 3.2 years.
Restricted Stock
Restricted stock awards represent a right to receive shares of common stock at a future date determined in accordance with the participant’s award agreement. There is no exercise price and no monetary payment required for receipt of restricted stock awards or the shares issued in settlement of the award. Instead, consideration is furnished in the form of the participant’s services to the Company. Compensation cost for these awards is based on the fair value of the shares of common stock on the date of grant and recognized as compensation expense on a straight-line basis over the requisite service period.
On June 1, 2018, the Company granted 600,000 shares of Company restricted common stock in connection with the Addenda to the Employment Agreements of David Ludwig and Tom Ludwig. The shares are subject to certain restrictions on transfer and a right of repurchase over five years, ending May 31, 2023, and require a continued term of service to the Company. Stock-based compensation expense related to the restricted stock awards, calculated by using the grant date fair value of $0.43 per share, was $12,900 for the three months ended March 31, 2021. The unrecognized stock-based compensation expense as of March 31, 2021 was approximately $0.1 million.
11
Warrants
On March 19, 2019, the Company entered into a Warrant Agreement (the “Warrant Agreement”) with Napier Park Industrial Asset Acquisition LP, a Delaware limited partnership (“Napier Park”). Pursuant to the Warrant Agreement, Napier Park is entitled to receive warrants to acquire shares of Company common stock with a fair market value of $71,368 for each $500,000 increment in excess of $2.5 million of Cumulative Gross Profit (as defined in the Warrant Agreement) achieved prior to December 19, 2022 to which the Company may become entitled in connection with its equity joint venture with Napier Park. During the fiscal year ended December 31, 2020 and the three months ended March 31, 2021, Napier Park did not receive any warrants.
Note 5 – Lessor Arrangement
On June 27, 2019, the Company, with certain partners, entered into agreements to lease, with a purchase option, a fully functional manufacturing building, including all machinery and equipment held within. The assets under lease relate to the Company’s purchase, with certain partners, of a pharmaceutical campus in Huntsville, Alabama, as disclosed in the Company’s Form 10-K. The lessee is obligated to make monthly lease payments over a ten-year period, totaling approximately $13.2 million for the real estate portion, and monthly lease payments over a six year period totaling approximately $9.7 million for the machinery and equipment. The purchase option for both the real estate and machinery and equipment can be exercised at any time on or after December 1, 2019 and before May 31, 2021 for a total purchase price of $20.0 million, of which $12.0 million and $8.0 million are allocated to the real estate and machinery and equipment, respectively. The lessor arrangement is classified as a sales-type lease, and, therefore, the present value of future lease payments was recognized as revenue and a lease receivable as of the effective date of the lease agreement.
The real estate portion of the lease arrangement is owned by CPFH LLC, the joint venture, and is accounted for under the equity method where the Company’s share in earnings from equity method investments is shown in one line item on the condensed consolidated income statement. Refer to Note 6 for further information.
The machinery and equipment portion of the arrangement is jointly owned by all the partners of CPFH LLC, apart from the joint venture entity. Therefore, the Company has derecognized the leased asset of approximately $0.9 million and recognized as revenue approximately $1.2 million, which represents the present value of future lease payments and a lease receivable included in the accounts receivable line item on the condensed consolidated balance sheet, consistent and reflective of its business model for asset sales. The Company expects to recognize approximately $0.5 million in interest income prior to the exercise of the purchase option, which is the difference between the present value (at a 5.50% discount rate) and the undiscounted lease payments.
Note 6 – Equity Method Investments
In November 2018, CPFH LLC, of which the Company holds a 25% share, was formed to purchase certain real estate assets among partners in a joint venture. In March 2019, Oak Grove Asset Acquisitions LP, of which the Company holds a 50% share, was formed for the execution of auction deals with Napier Park. In March 2020, HGC Origination I LLC and HGC Funding I LLC were formed as joint ventures with a partner for purposes of conducting business relating to the sourcing, origination and funding of loans to debt purchasing clients. The table below details the Company’s joint venture revenues and earnings during the three months ended March 31, 2021 and 2020 (in thousands):
|
|
|
March 31, |
|
|||||
|
|
|
2021 |
|
|
2020 |
|
||
|
Revenues: |
|
|
|
|
|
|
|
|
|
Oak Grove Asset Acquisitions LP |
|
$ |
— |
|
|
$ |
— |
|
|
CPFH LLC |
|
|
108 |
|
|
|
319 |
|
|
HGC Funding I LLC and Origination I LLC |
|
|
— |
|
|
|
8 |
|
|
Total revenues |
|
$ |
108 |
|
|
$ |
327 |
|
|
|
|
|
|
|
|
|
|
|
|
Operating income: |
|
|
|
|
|
|
|
|
|
Oak Grove Asset Acquisitions LP |
|
$ |
— |
|
|
$ |
— |
|
|
CPFH LLC |
|
|
— |
|
|
|
— |
|
|
HGC Funding I LLC and Origination I LLC |
|
|
— |
|
|
|
8 |
|
|
Total operating income |
|
$ |
— |
|
|
$ |
8 |
|
The table below details the summarized components of assets and liabilities of the Company’s joint ventures, as of March 31, 2021 and December 31, 2020 (in thousands):
12
|
|
|
March 31, |
|
|
December 31, |
|
||
|
|
|
2021 |
|
|
2020 |
|
||
|
Assets: |
|
|
|
|
|
|
|
|
|
Oak Grove Asset Acquisitions LP |
|
$ |
— |
|
|
$ |
— |
|
|
CPFH LLC |
|
|
10,175 |
|
|
|
10,791 |
|
|
HGC Funding I LLC |
|
|
— |
|
|
|
— |
|
|
Total assets |
|
$ |
10,175 |
|
|
$ |
10,791 |
|
|
|
|
|
|
|
|
|
|
|
|
Liabilities: |
|
|
|
|
|
|
|
|
|
Oak Grove Asset Acquisitions LP |
|
$ |
1 |
|
|
$ |
1 |
|
|
CPFH LLC |
|
|
4,495 |
|
|
|
5,374 |
|
|
HGC Funding I LLC |
|
|
— |
|
|
|
— |
|
|
Total liabilities |
|
$ |
4,496 |
|
|
$ |
5,375 |
|
Note 7 – Earnings Per Share
The Company is required in periods in which it has net income to calculate basic earnings per share (“basic EPS”) using the two-class method. The two-class method is required because the Company’s shares of Series N preferred shares, each of which is convertible to 40 common shares, have the right to receive dividends or dividend equivalents should the Company declare dividends on its common stock. Under the two-class method, earnings for the period are allocated on a pro-rata basis to the common and preferred stockholders. The weighted-average number of common and preferred shares outstanding during the period is then used to calculate basic EPS for each class of shares.
In periods in which the Company has a net loss, basic loss per share is calculated by dividing the loss attributable to common stockholders by the weighted-average number of common shares outstanding during the period. The two-class method is not used in periods in which the Company has a net loss because the preferred stock does not participate in losses.
Stock options and other potential common shares are included in the calculation of diluted earnings per share (“diluted EPS”), since they are assumed to be exercised or converted, except when their effect would be anti-dilutive. The table below shows the calculation of the shares used in computing diluted EPS.
|
|
|
Three Months Ended March 31, |
|
|||||
|
Weighted Average Shares Calculation: |
|
2021 |
|
|
2020 |
|
||
|
Basic weighted average shares outstanding |
|
|
34,788,016 |
|
|
|
28,751,689 |
|
|
Treasury stock effect of common stock options and restricted stock awards |
|
|
2,745,049 |
|
|
|
1,448,425 |
|
|
Diluted weighted average common shares outstanding |
|
|
37,533,065 |
|
|
|
30,200,114 |
|
For the three months ended March 31, 2021 and 2020, there were potential common shares of 30,000 and approximately 0.1 million, respectively, that were excluded from the computation of diluted EPS, as the inclusion of such common shares would have been anti-dilutive.
Note 8 – Leases
The Company leases office and warehouse space primarily in three locations: Del Mar, CA; Burlingame, CA; and Edwardsville, IL. As each contract does not meet any of the four criteria of ASC 842 for financing lease classification, the Company has determined that each lease arrangement should be classified as an operating lease. The right-of-use assets and lease liabilities for each location are as follows (in thousands):
13
|
|
|
March 31, |
|
|
December 31, |
|
||
|
Right-of-use assets: |
|
2021 |
|
|
2020 |
|
||
|
Del Mar, CA |
|
$ |
579 |
|
|
$ |
613 |
|
|
Burlingame, CA |
|
|
23 |
|
|
|
99 |
|
|
Edwardsville, IL |
|
|
228 |
|
|
|
251 |
|
|
|
|
$ |
830 |
|
|
$ |
963 |
|
|
|
|
|
|
|
|
|
|
|
|
|
|
March 31, |
|
|
December 31, |
|
||
|
Lease liabilities: |
|
2021 |
|
|
2020 |
|
||
|
Del Mar, CA |
|
$ |
608 |
|
|
$ |
641 |
|
|
Burlingame, CA |
|
|
28 |
|
|
|
109 |
|
|
Edwardsville, IL |
|
|
229 |
|
|
|
253 |
|
|
|
|
$ |
865 |
|
|
$ |
1,003 |
|
The Company’s leases generally do not provide an implicit rate, and, therefore, the Company uses its incremental borrowing rate as the discount rate when measuring operating lease liabilities. The incremental borrowing rate represents an estimate of the interest rate the Company would incur at lease commencement to borrow an amount equal to the lease payments on a collateralized basis over the term of a lease within a particular currency environment. The Company uses its incremental borrowing rate as of January 1, 2019 for operating leases that commenced prior to that date. As of January 1, 2019, the Company’s incremental borrowing rate was 5.25%.
Lease expense for these leases is recognized on a straight-line basis over the lease term. For both three month periods ended March 31, 2021 and 2020, lease expense was approximately $0.1 million. Undiscounted future minimum lease payments as of March 31, 2021 that have initial or remaining lease terms in excess of one year are as follows (in thousands):
|
2021 (remainder of year from April 1, 2021 to December 31, 2021) |
|
$ |
231 |
|
|
2022 |
|
|
278 |
|
|
2023 |
|
|
218 |
|
|
2024 |
|
|
177 |
|
|
2025 |
|
|
30 |
|
|
Total undiscounted future minimum lease payments |
|
|
934 |
|
|
Less imputed interest |
|
|
(69 |
) |
|
Present value of lease liabilities |
|
$ |
865 |
|
Note 9 – Intangible Assets and Goodwill
Identifiable intangible assets
The Company’s identifiable intangible assets are associated with its acquisitions of HGP in 2012 and NLEX in 2014, as shown in the table below (in thousands), and are amortized using the straight-line method over their remaining estimated useful lives of one to four years. The Company’s tradename that was acquired as part of the acquisition of NLEX in 2014 has an indefinite life and therefore is not amortized.
|
|
|
Carrying Value |
|
|
|
|
|
|
Carrying Value |
|
||
|
|
|
December 31, |
|
|
|
|
|
|
March 31, |
|
||
|
Amortized Intangible Assets |
|
2020 |
|
|
Amortization |
|
|
2021 |
|
|||
|
Customer Network (HGP) |
|
$ |
62 |
|
|
$ |
(8 |
) |
|
$ |
54 |
|
|
Trade Name (HGP) |
|
|
513 |
|
|
|
(32 |
) |
|
|
481 |
|
|
Customer Relationships (NLEX) |
|
|
111 |
|
|
|
(27 |
) |
|
|
84 |
|
|
Total |
|
|
686 |
|
|
|
(67 |
) |
|
|
619 |
|
|
|
|
|
|
|
|
|
|
|
|
|
|
|
|
Unamortized Intangible Assets |
|
|
|
|
|
|
|
|
|
|
|
|
|
Trade Name (NLEX) |
|
|
2,437 |
|
|
|
— |
|
|
|
2,437 |
|
|
Total |
|
$ |
3,123 |
|
|
$ |
(67 |
) |
|
$ |
3,056 |
|
14
Amortization expense during the three months ended March 31, 2021 and 2020 was $0.1 million.
As of March 31, 2021, the estimated amortization expense for the remainder of the current fiscal year and the next three fiscal years is shown below (in thousands):
|
Year |
|
Amount |
|
|
|
2021 (remainder of year from April 1, 2021 to December 31, 2021) |
|
$ |
203 |
|
|
2022 |
|
|
159 |
|
|
2023 |
|
|
129 |
|
|
2024 |
|
|
128 |
|
|
Total |
|
$ |
619 |
|
Goodwill
The Company’s goodwill is related to its asset liquidation business and is comprised of goodwill from the acquisitions of HGP in 2012 and NLEX in 2014, as shown in the table below (in thousands). There were no additions to goodwill and no impairment losses to the carrying amount of goodwill during the three months ended March 31, 2021.
|
Acquisition |
|
March 31, 2021 |
|
|
December 31, 2020 |
|
||
|
HGP |
|
$ |
2,040 |
|
|
$ |
2,040 |
|
|
NLEX |
|
|
3,545 |
|
|
|
3,545 |
|
|
Total goodwill |
|
$ |
5,585 |
|
|
$ |
5,585 |
|
Note 10 – Debt
The Company had no outstanding debt as of March 31, 2021 and December 31, 2020.
In September 2018, Heritage Global Inc. entered into a secured promissory note and business loan agreement (the “2018 Credit Facility”) with First Choice Bank, for a $1.5 million revolving line of credit. The 2018 Credit Facility had an initial maturity date of October 5, 2019 and replaced the Line of Credit. The Company is permitted to use the proceeds of the loan solely for its business operations. The 2018 Credit Facility accrues interest at a variable rate, which is equal to the rate of interest last quoted by The Wall Street Journal as the “prime rate,” not to be less than 5.25% per annum, with a minimum interest charge of $100.00 per month.
In March 2019, Heritage Global Inc. entered into the Change in Terms Agreement and the First Amendment to Business Loan Agreement (collectively, the “Amendments”), which amended the Company’s 2018 Credit Facility. The Amendments, among other things, (i) increased the principal amount of the revolving line of credit to $3.0 million, (ii) extended the maturity date of the 2018 Credit Facility to April 5, 2020, and (iii) raised the floor interest rate under the 2018 Credit Facility from 5.25% to 5.50%.
On February 10, 2020, the Company entered into a secured promissory note, business loan agreement, commercial security agreement and agreement to provide insurance (the “Credit Facility”) with C3bank, National Association for a $5.0 million revolving line of credit, which replaced the 2018 Credit Facility. The Credit Facility had an initial maturity date of February 5, 2021, which was extended to April 5, 2021 on February 5, 2021. The Company is permitted to use the proceeds of the loan solely for its business operations. The Credit Facility accrues at a variable interest rate, which is equal to the rate of interest last quoted by The Wall Street Journal as the “prime rate,” not to be less than 5.50% per annum. The Company may prepay the Credit Facility without penalty. The Company is the borrower under the Credit Facility. The Credit Facility is secured by a first priority security interest in certain of the Company’s and its certain subsidiaries’ current and future tangible and intangible assets, inventory, chattel paper, accounts, equipment and general intangibles. The availability of additional draws under the Credit Facility is conditioned, among other things, on the compliance with certain customary representations and warranties, including default, insolvency or bankruptcy, material adverse change in financial condition and any guarantor’s attempt to revise its guarantee. The agreement governing the Credit Facility also contains customary affirmative covenants regarding, among other things, the maintenance of records, maintenance of certain insurance coverage, compliance with governmental requirements and maintenance of a debt to equity ratio. The Credit Facility contains certain customary financial covenants and negative covenants that, among other things, include restrictions on the Company’s ability to create, incur or assume indebtedness for borrowed money, including capital leases or to sell, transfer, mortgage, assign, pledge, lease, grant a security interest in, or encumber any of the Company’s assets. During the year ended December 31, 2020, the Company drew
15
on the line of credit for a total of $5.6 million and made repayments of principal totaling $5.6 million resulting in a zero balance as of December 31, 2020. During the three months ended March 31, 2021, the Company made no additional draws or repayments on the line of credit. As described more fully in Note 14—Subsequent Events, the Company entered into a New Credit Facility (as defined herein) for a $10.0 million revolving line of credit, which terminated the Credit Facility.
In January 2018, HG LLC, a wholly-owned subsidiary of HGI, settled a long-standing litigation matter that was commenced against the predecessor in interest of HG LLC. The settlement, which also involved several other co-defendant parties, included a complete release of HG LLC’s predecessor in interest and its successors and affiliates by the plaintiffs from all claims arising from or relating to the facts and circumstances underlying the litigation. The portion of the settlement attributable to HG LLC’s predecessor in interest was paid on behalf of HG LLC by 54 Finance, LLC (“54 Finance”) (an affiliate of a co-defendant in the litigation) in consideration of a promissory note dated January 30, 2018 (the “Note”) from HG LLC in the amount of $1,260,000. Pursuant to a guaranty dated January 30, 2018, HGI has guaranteed the obligations of HG LLC under the Note, which are required to be paid in 36 equal installments of $35,000, with any remaining outstanding balance due and payable in full on January 30, 2021. As of December 31, 2017, the Company accrued the present value of the Note based on the payment terms noted above and at an interest rate of 6.5%. Upon the occurrence of any Event of Default, as defined below, in the sole discretion of 54 Finance, the outstanding principal balance of the Note will bear interest at a rate per annum (computed on the basis of a 360-day year, actual days elapsed) equal to 12%. An “Event of Default” means: (a) any failure of HG LLC to pay when due any amount thereunder, when and as due, (b) any failure on the part of HG LLC to pay upon 54 Finance’s demand any fees, costs, expenses or other charges hereunder or otherwise due to HG LLC under the Note or the Guaranty, (c) any breach, failure or default under the Guaranty, (d) HG LLC or the Company repudiates or revokes, or purports to repudiate or revoke, any obligation under the Note or the Guaranty, or the obligation of the Company under the Guaranty is limited or terminated by operation of law or by the Company, or (e) HG LLC or the Company shall be or become insolvent, however defined, or admit in writing its inability to pay debts as they mature, or make a general assignment for the benefit of its creditors, or shall institute any bankruptcy, insolvency or similar proceeding under the laws of any jurisdiction, or shall take any action to authorize such proceeding. During 2020, the Company made the remaining scheduled payments on the Note totaling $455,000 resulting in a zero balance on the Note as of December 31, 2020.
Note 11 – Income Taxes
As of March 31, 2021, the Company had aggregate tax net operating loss carry forwards of approximately $77.6 million ($61.6 million of unrestricted net operating tax losses and approximately $16.0 million of restricted net operating tax losses). Substantially all of the net operating loss carry forwards expire between 2024 and 2037. The Company’s utilization of restricted net operating tax loss carry forwards against future income for tax purposes is restricted pursuant to the “change in ownership” rules in Section 382 of the Internal Revenue Code.
The reported tax expense varies from the amount that would be provided by applying the statutory U.S. Federal income tax rate to the income from operations before taxes primarily as a result of excess tax benefits from stock option exercises, offset by an increase in state tax expense of approximately $0.6 million due to California’s three-year net operating loss carryforward suspension that became effective on June 29, 2020.
The Company records net deferred tax assets to the extent that it believes such assets will more likely than not be realized. As a result of cumulative losses and uncertainty with respect to future taxable income, the Company has provided a partial valuation allowance against its net deferred tax assets as of March 31, 2021 and December 31, 2020.
Note 12 – Related Party Transactions
As part of the operations of NLEX, the Company leases office space in Edwardsville, IL that is owned by David Ludwig, the Company’s President of its Financial Assets Division and a member of its board of directors. The total amount paid to the related party for the three month periods ended March 31, 2021 and 2020 was approximately $28,000 and $27,000, respectively, and is included in selling, general and administrative expenses in the condensed consolidated income statements. All lease payments during the three months ended March 31, 2021 and the fiscal year ended December 31, 2020 were made to Mr. Ludwig. On June 1, 2018, the Company amended its lease agreement with David Ludwig to extend the term of the lease to May 31, 2023 and to set the rent amounts for the new term.
On March 30, 2021, the Company and Scott West entered into a Separation Agreement and General Release (the “Separation Agreement”). Under the terms of the Separation Agreement, Mr. West’s separation from the Company was effective on March 31, 2021. Mr. West will receive a payment of $200,000 (payable in equal installments over six months) and monthly payments of $775 for up to a year to offset health coverage costs. Further, Mr. West received 25,000 shares of the Company’s common stock, which will be forfeited to the Company during the two years following the effective date of the Separation Agreement in the event Mr. West
16
breaches the terms of the Separation Agreement. In addition, the Separation Agreement provides for customary mutual releases by the Company and Mr. West, and the Separation Agreement includes confidentiality, non-disparagement and other obligations.
Note 13 – Segment Information
The Company reports segment information based on the “management” approach. The management approach designates the internal reporting used by management for making decisions and assessing performance as the source of the Company’s reportable segments. The Company manages its business primarily on differentiated revenue streams for services offered. The Company’s reportable segments consist of the Industrial Asset Division and Financial Assets Division. Our Industrial Assets Division advises enterprise and financial customers on the sale of industrial assets mostly from surplus and sometimes distressed circumstances while acting as an agent, guarantor or principal in the sale. Our Financial Assets Division provides liquidity to issuers of consumer credit that are looking to monetize nonperforming and charged-off loans — loans that creditors have written off as uncollectable. Nonperforming and charged-off loans typically originate from banks that issue unsecured consumer credit.
The Company evaluates the performance of its reportable segments based primarily on net operating income. Further, the Company does not utilize segmented asset information to evaluate the performance of its reportable segments and does not include intercompany transfers between segments for management reporting purposes.
The following table sets forth certain financial information for the Company's reportable segments (in thousands):
|
|
|
Three Months Ended March 31, |
|
|||||
|
|
|
2021 |
|
|
2020 |
|
||
|
Industrial Assets Division: |
|
|
|
|
|
|
|
|
|
Net operating income |
|
$ |
1,340 |
|
|
$ |
47 |
|
|
|
|
|
|
|
|
|
|
|
|
Financial Assets Division: |
|
|
|
|
|
|
|
|
|
Net operating income |
|
$ |
461 |
|
|
$ |
552 |
|
|
|
|
|
|
|
|
|
|
|
|
Corporate and Other: |
|
|
|
|
|
|
|
|
|
Net operating loss |
|
$ |
(755 |
) |
|
$ |
(505 |
) |
|
|
|
|
|
|
|
|
|
|
|
Consolidated: |
|
|
|
|
|
|
|
|
|
Net operating income |
|
$ |
1,046 |
|
|
$ |
94 |
|
Note 14 – Subsequent Events
The Company has evaluated events subsequent to March 31, 2021 for potential recognition or disclosure in its condensed consolidated financial statements. There have been no material subsequent events requiring recognition or disclosure in this Quarterly Report on Form 10-Q, other than noted below.
On May 11, 2021, the Company entered into a promissory note, business loan agreement, commercial security agreement and pledge agreement (the “New Credit Facility”) with C3bank, National Association for a $10.0 million revolving line of credit. The New Credit Facility matures on May 11, 2023 and replaces the Credit Facility. The Company is permitted to use the proceeds of the loan solely for its business operations.
The New Credit Facility accrues at a variable interest rate, which is based on the rate of interest last quoted by The Wall Street Journal as the “prime rate,” plus a margin of 1.70% (such rate not to be less than 4.950% per annum). The Company will pay interest on the New Credit Facility in regular monthly payments, beginning on June 11, 2021. The New Credit Facility also provides for a minimum fee, which is offset by interest payments. The Company may prepay the New Credit Facility without penalty and may convert up to $5.0 million of revolving debt into term debt.
The Company is the borrower under the New Credit Facility. The New Credit Facility is secured by a security interest in certain of the Company’s and its certain subsidiaries’ current and future tangible and intangible assets, inventory, chattel paper, accounts, equipment and general intangibles and a pledge of the equity of the direct and indirect subsidiaries of the Company.
The availability of additional draws under the New Credit Facility is conditioned, among other things, on the compliance with certain customary representations and warranties, including default, insolvency or bankruptcy, material adverse change in financial
17
condition and any guarantor’s attempt to revise its guarantee. The agreement governing the New Credit Facility also contains customary affirmative covenants regarding, among other things, the maintenance of records, maintenance of certain insurance coverage, compliance with governmental requirements and maintenance of several financial covenants.
The New Credit Facility contains certain customary financial covenants and negative covenants that, among other things, include restrictions on the Company’s ability to create, incur or assume indebtedness for borrowed money, including capital leases or to sell, transfer, mortgage, assign, pledge, lease, grant a security interest in, or encumber any of the Company’s assets.
On May 11, 2021, the Company terminated the Credit Facility as a result of entry into the New Credit Facility. See Note 10—Debt for a description of the material terms and conditions of the Credit Facility.
18
Item 2. Management’s Discussion and Analysis of Financial Condition and Results of Operations.
The following discussion and analysis should be read in conjunction with the information contained in the unaudited condensed consolidated interim financial statements of Heritage Global Inc. (together with its consolidated subsidiaries, “we”, “us”, “our” or the “Company”) and the related notes thereto for the three month periods ended March 31, 2021 and 2020, appearing elsewhere herein, and in conjunction with the Management’s Discussion and Analysis of Financial Condition and Results of Operations set forth in the Company’s Annual Report on Form 10-K for the year ended December 31, 2020, filed with the Securities and Exchange Commission (“SEC”) on March 8, 2020 (the “Form 10-K”).
Forward Looking Information
This Quarterly Report on Form 10-Q (the “Report”) contains certain “forward-looking statements” as defined by the Private Securities Litigation Reform Act of 1995 that are based on management’s exercise of business judgment as well as assumptions made by, and information currently available to, management. When used in this document, the words “may,” "will,” “anticipate,” “believe,” “estimate,” “expect,” “intend,” and words of similar import, are intended to identify any forward-looking statements. You should not place undue reliance on these forward-looking statements. We have based these forward-looking statements largely on our current expectations and projections about future events and trends that we believe may affect our financial condition, results of operations, business strategy, short-term and long-term business operations and objectives, and financial needs. These statements are subject to certain risks, uncertainties, and assumptions, including the important factors noted under Item 1A “Risk Factors” in our Form 10-K, and as noted below. Should one or more of these risks or uncertainties materialize, or should underlying assumptions prove incorrect, our actual results could differ materially from those anticipated in these forward-looking statements. We undertake no obligation, and do not intend, to update, revise or otherwise publicly release any revisions to these forward-looking statements to reflect events or circumstances after the date hereof, or to reflect the occurrence of any unanticipated events. Although we believe that our expectations are based on reasonable assumptions, we can give no assurance that our expectations will materialize.
Overview, History and Recent Developments
Heritage Global Inc. (“HGI”) was incorporated in the State of Florida in 1983 under the name “MedCross, Inc.” The Company’s name was changed to “I-Link Incorporated” in 1997, to “Acceris Communications Inc.” in 2003, to “C2 Global Technologies Inc.” in 2005, to “Counsel RB Capital Inc.” in 2011, and to “Heritage Global Inc.” effective in 2013. The most recent name change more closely identifies the Company with its core auction business, Heritage Global Partners, Inc. (“HGP”).
In 2014, HGI acquired all of the issued and outstanding capital stock in National Loan Exchange, Inc. (“NLEX”), a broker of charged-off receivables in the United States and Canada. As a result of this acquisition, NLEX operates as one of our wholly-owned divisions.
In 2019, the Company formed Heritage Global Capital LLC (“HGC”), a wholly-owned subsidiary of HGI, in order to provide specialty financing solutions to investors in charged-off and nonperforming asset portfolios.
19
The organization chart below outlines our basic domestic corporate structure as of March 31, 2021.
|
(1) |
Registrant. |
|
(2) |
Full service, global auction, appraisal and asset advisory company. |
|
(3) |
Asset liquidation company that acquires and monetizes distressed and surplus assets. |
|
(4) |
Mergers and acquisitions (M&A) advisory firm specializing in financially distressed businesses and properties. |
|
(5) |
Broker of charged-off receivables. |
|
(6) |
Specialty financing solutions for charged-off and nonperforming asset portfolios. |
COVID-19
The spread of the novel coronavirus (“COVID-19”) had a minor negative impact on our performance during the first quarter of 2021 due to evolving travel and work restrictions, stimulus payments and credit policies impacting debt sales, and a delay in the sale of certain assets.
Going forward, we do not believe the COVID-19 pandemic will have material negative impacts on our financial performance as our asset liquidation business is highly concentrated in distressed and surplus assets and we expect that there will be an increased supply of distressed and surplus assets as a result of the COVID-19 pandemic and any downward trends in the overall economy, resulting in more potential for principal deals. We believe that the continuing disruptions to the global supply chain, particularly those involving industrial assets, will further increase demand for U.S.-based surplus assets. Further, we expect that the COVID-19 pandemic will have the following positive impacts on our business:
•continued increase in demand for HGP’s online auctions as a result of ongoing social distancing requirements in connection with the COVID-19 pandemic;
•increased activity for NLEX and HGC due to expanding volumes of nonperforming and charged-off consumer loans;
•increased funding opportunities for HGC due to tightening underwriting standards at conventional lenders; and
•incremental valuation opportunities for our valuation business as a result of greater focus on collateral on bank balance sheets.
However, positive expected impacts of the COVID-19 pandemic on our business could be offset, at least in part, by negative impacts on certain of our business units relying on nonperforming and charged-off consumer loans. Any continuation of stimulus payments and additional credit policies impacting debt sales may result in delayed revenues depending on the scope and magnitude of such policies.
20
Asset liquidation
We are a value-driven, innovative leader in financial and capital asset liquidation transactions, valuations and advisory services. We specialize both in acting as an adviser, as well as in acquiring or brokering turnkey manufacturing facilities, surplus industrial machinery and equipment, industrial inventories, real estate, accounts receivable portfolios, intellectual property, and entire business enterprises.
Our asset liquidation business began operations in 2009 with the establishment of Heritage Global LLC (“HG LLC”). In addition to acquiring turnkey manufacturing facilities and used industrial machinery and equipment, HG LLC arranges traditional asset disposition sales, including liquidation and auction sales.
In 2012, we increased our in-house asset liquidation expertise with our acquisition of 100% of the outstanding equity of HGP, a global full-service auction, appraisal and asset advisory firm.
In 2014, we again expanded our asset liquidation operations with the acquisition of 100% of the outstanding equity of NLEX. NLEX is the largest volume broker of charged-off receivables in the United States and Canada, and its offerings include national, state and regional portfolios on behalf of many of the world’s top financial institutions. The NLEX acquisition is consistent with our strategy to expand and diversify the services provided by our asset liquidation business.
In 2019, the Company formed Heritage Global Capital LLC (“HGC”), a wholly-owned subsidiary of HGI, in order to provide specialty financing solutions to investors in charged-off and nonperforming asset portfolios.
As a result of the events and acquisitions outlined above, management believes that our expanded platform will allow us to achieve our long term industry leadership goals.
Industry and Competition
Our asset liquidation business consists primarily of the auction, appraisal and asset advisory services provided by our Industrial Assets division and the accounts receivable brokerage specialty financing services provided by our Financials Assets division, each of which is further described below. Our asset liquidation business also includes the purchase and sale, including at auction, of industrial machinery and equipment, real estate, inventories, accounts receivable and distressed debt. The market for these services and assets is highly fragmented. To acquire auction or appraisal contracts, or assets for resale, we compete with other liquidators, auction companies, dealers and brokers. We also compete with them for potential purchasers, as well as with equipment manufacturers, distributors, dealers and equipment rental companies. Some competitors have significantly greater financial and marketing resources and name recognition.
We believe that our business is positioned to grow in all economic cycles. As the economy encounters situations of recession, flattening yield curves and rising credit costs, the asset liquidation business may experience wider margins on principal asset sales, a favorable lending cycle for charged-off and nonperforming asset portfolios, higher volumes of nonperforming assets and building surplus inventories and bankruptcies. In times of economic growth, our asset liquidation business has demonstrated its ability to experience growth based on our competitive advantages in the industry, including our domain expertise related to deal sourcing and execution capabilities, our diversification of integrated service platforms and our experience across underserved markets. We intend to continue to leverage our competitive advantages to grow within each service line and across platforms through increasing synergies, maintaining high incremental margins, improving earnings predictability, strengthening financial metrics reflected on our balance sheet and managing expenses.
Our business strategy includes the option of partnering with one or more additional purchasers, pursuant to a partnership, joint venture or limited liability company agreement (collectively, “Joint Ventures”). These Joint Ventures give us access to more opportunities, helping to mitigate some of the competition from the market’s larger participants and contribute to our objective to be the leading resource for clients requiring financial and industrial asset solutions.
Our Competitive Strengths
We believe we have attributes that differentiate us from our competitors and provide us with significant competitive advantages. Our key competitive strengths are described below.
21
Differentiated Business Model. We believe we have diversified business lines serving the financial and industrial asset liquidation market. We have multiple revenue streams in our brokerage and principal based auction services, advisory services and secured lending services. Further, our business is event-driven and we have repeat, forward-flow contracts in place with industry leading customers. We expect to drive growth in our revenue streams by taking different roles, and using partners as needed.
Compelling Macro Growth Drivers. Historically, recessions drive an increased supply of surplus assets and increased demand for liquidation services, which we believe we are well positioned to provide. Further, we believe the trend of growth in the marketplace of lending platforms is driving an increased supply of non-performing consumer loans. Additionally, we believe an active market for mergers and acquisitions in manufacturing industries drives demand for industrial asset liquidations and our services. The market in which we operate is highly fragmented, presenting a continued opportunity for the Company to increase market share and drive consolidation.
High Return on Invested Capital. We believe we have an opportunity, upon securing additional working capital, to drive improved auction economics by serving more frequently in the role of principal rather than the lower margin role of broker. Further, we believe we have a strong growth opportunity in providing secured loans to our financial asset debt buyers, a service we are providing through HGC.
Strong Management Team. We have built an experienced executive-level management team with deep domain expertise. Our President and Chief Executive Officer, Ross Dove, is a third-generation auctioneer and a pioneering innovator in applying technology to the asset liquidation industry. Mr. Dove began his career in the auction business over thirty years ago, beginning with a small family-owned auction house and helping to expand it into a global firm, DoveBid, which was sold to a third party in 2008. In addition, our senior management team has deep domain expertise in both industrial asset and financial asset transactions. On September 17, 2020, we entered into an Employment Agreement with Kirk Dove, the former President and Chief Operating Officer of the Company. Upon his resignation, Kirk Dove will continue his employment with us in an advisory capacity until December 31, 2024. Also during 2020, Nick Dove was appointed as President, Industrial Assets Division, and David Ludwig was appointed as President, Financial Assets Division. Nick Dove previously served as Executive Vice President of Sales of Heritage Global Partners since August 2017. David Ludwig previously served as President of NLEX, a wholly-owned subsidiary of the Company, and has served in such capacity since the Company acquired NLEX in 2014.
Our Financial Assets Division
Our Financial Assets division provides liquidity to issuers of consumer credit that are looking to monetize nonperforming and charged-off loans — loans that creditors have written off as uncollectable. Nonperforming and charged-off loans typically originate from banks that issue unsecured consumer credit.
Through NLEX, we act as an advisor for sales of charged-off and nonperforming asset portfolios via an electronic auction exchange platform for banks, the U.S. government, and other debt holders throughout the United States and Canada. Since the 1980s, NLEX has sold over $150 billion face value of performing, nonperforming and charged-off assets. NLEX sales are concentrated in online, automotive, consumer credit card, student loan and real estate charge-offs. The typical credit we broker sells at a deep discount to face value, and we typically receive a commission for these services from both buyers and sellers. We have existing relationships with high quality, top-tier and mid-tier debt buyers. NLEX is in the process of expanding into the FinTech and peer-to-peer lending sectors, where we believe NLEX has opportunity for significant growth. In addition, we plan to add post-sale initiatives, making our services more attractive to our customers as compared to our competitors. We expect that our income from secured lending will consist of upfront fees, interest income, monthly monitoring fees and backend profit share.
Our management team has decades of domain expertise with the ability to leverage extensive funding activity and widespread industry relationships. We believe we have the opportunity for growth through increased penetration of the underserved market of mid-tier buyers of charged-off receivables, providing more economic financing options and a greater variety of funding solutions to our customers.
Our Industrial Assets Division
Our Industrial Assets division advises enterprise and financial customers on the sale of industrial assets mostly from surplus and sometimes distressed circumstances while acting as an agent, guarantor or principal in the sale. The fees for our services typically range from 15–50%, depending on our role and the transaction. This division predominantly targets sellers of surplus or distressed “inside the building” assets. Our buyers consist of both end-users and dealers.
22
Our management team has decades of domain expertise with the ability to leverage extensive industry relationships and has access to a real-time database of actual sales data across 28 industrial sectors. We believe we have the opportunity for growth in our auction services through shifting toward higher-contribution principal deals and, assuming the acceleration of mergers and acquisitions in manufacturing industries continues, increased auction services for sales of surplus equipment. Further, we intend to leverage our Capital Asset Redeployment Enterprise (CARE) software package, which provides an internal asset redeployment management system for corporations. We believe we have the opportunity for growth in our valuation services through the addition of incremental bank-approved vendor lists, geographic expansion and through deeper penetration with our existing bank relationships.
Government Regulation
We are subject to federal, state and local consumer protection laws, including laws protecting the privacy of customer non-public information and regulations prohibiting unfair and deceptive trade practices. Many jurisdictions also regulate “auctions” and “auctioneers” and may regulate online auction services. These consumer protection laws and regulations could result in substantial compliance costs and could interfere with the conduct of our business.
Legislation in the United States has increased public companies’ regulatory and compliance costs as well as the scope and cost of work provided by independent registered public accountants and legal advisors. As regulatory and compliance guidelines continue to evolve, we expect to continue to incur costs, which may or may not be material, in order to comply with legislative requirements or rules, pronouncements and guidelines by regulatory bodies.
Critical Accounting Policies
Management’s Discussion and Analysis of Financial Condition and Results of Operations references our unaudited condensed consolidated interim financial statements, which have been prepared in accordance with generally accepted accounting principles in the United States of America (“GAAP”). This requires management to make estimates and assumptions that affect the reported amounts of assets and liabilities and the disclosure of contingent assets and liabilities at the date of the financial statements, as well as the reported amounts of revenue and expenses during the reporting period. Management bases its estimates and judgments on historical experience and various other factors that are considered to be reasonable under the circumstances. Actual results could differ from those estimates.
Significant estimates required in the preparation of the unaudited condensed consolidated interim financial statements included in this Report include the assessment of collectability of revenue recognized, and the valuation of accounts receivable, inventory, other assets, right-of-use assets, goodwill, intangible assets, liabilities, deferred income tax assets and liabilities and stock-based compensation. These estimates are considered significant either because of the significance of the financial statement items to which they relate, or because they require judgment and estimation due to the uncertainty involved in measuring, at a specific point in time, events that are continuous in nature.
We have no off-balance sheet arrangements.
We have not paid any dividends, and do not expect to pay any dividends in the future.
The critical accounting policies used in the preparation of our audited consolidated financial statements are discussed in our Form 10-K. There have been no changes to these policies in the three months ended March 31, 2021.
Management’s Discussion of Financial Condition
Liquidity and Capital Resources
Liquidity
We had working capital of $13.2 million and $13.0 million at March 31, 2021 and December 31, 2020, respectively.
On October 6, 2020, we completed a public offering (the “2020 Public Offering”) of 5,462,500 shares of our common stock, at a public offering price of $1.75 per share, which included a full exercise of the underwriters’ option to purchase 712,500 additional shares of common stock from us. We received approximately $8.7 million of net proceeds, after deducting underwriting discounts and commissions, but before offering expenses. We intend and continue to use the net proceeds to provide additional funds for general corporate purposes, which may include, without limitation, the expansion of the businesses of HGC and HGP, working capital and growth capital.
23
Our current assets as of March 31, 2021 decreased to $20.7 million compared to $27.0 million as of December 31, 2020 primarily due to decreased cash as a result of cash used in operating activities during the three months ended March 31, 2021. Our current liabilities as of March 31, 2021 decreased to $7.5 million compared to $14.0 million as of December 31, 2020 primarily due to the settlement of auction liabilities for certain auctions held in the fourth quarter of 2020.
During the three months ended March 31, 2021, our primary source of cash was the cash on hand plus the cash provided by our asset liquidation business. Cash disbursements during the three months ended March 31, 2021 consisted primarily of lending activity of $2.5 million under HGC, payment of operating expenses, and settlement of auction liabilities.
We believe we can fund our operations and our debt service obligations during 2021 and beyond through a combination of cash flows from our on-going asset liquidation operations, proceeds from the 2020 Public Offering, and proceeds from our Credit Facility.
Our indebtedness consists of any amounts borrowed under our Credit Facility. On February 10, 2020, we entered into a secured promissory note, business loan agreement, commercial security agreement and agreement to provide insurance (the “Credit Facility”) with C3bank, National Association for a $5.0 million revolving line of credit, which was subsequently amended on March 3, 2021. The Credit Facility had an initial maturity date of February 5, 2021, which was extended to April 5, 2021 on February 5, 2021. We are permitted to use the proceeds from the Credit Facility solely for our business operations. As of March 31, 2021, we had an outstanding balance of zero on the Credit Facility. As described more fully in Part II, Item 5. “Other Information,” the Company entered into a New Credit Facility (as defined herein) for a $10.0 million revolving line of credit, which terminated the Credit Facility.
24
Ownership Structure and Capital Resources
|
|
• |
As of March 31, 2021, the Company had stockholders’ equity of $30.9 million, as compared to $29.9 million as of December 31, 2020. |
|
|
• |
On February 10, 2020, the Company entered into our Credit Facility with C3bank, National Association for a $5.0 million revolving line of credit, which replaced the 2018 Credit Facility. The Credit Facility had an initial maturity date of February 5, 2021, which was extended to April 5, 2021 on February 5, 2021. We had no outstanding borrowings under the Credit Facility as of March 31, 2021. As described more fully in Note 14 to the condensed consolidated financial statements, on May 11, 2021, the Company entered into a New Credit Facility for a $10.0 million revolving line of credit, which terminated the Credit Facility. |
|
|
• |
On October 6, 2020, the Company completed the 2020 Public Offering of an aggregate of 5,462,500 shares of the Company’s common stock, which included 712,500 shares of common stock sold pursuant to the full exercise of the underwriter’s option to purchase additional shares. We received approximately $8.7 million of net proceeds, after deducting underwriting discounts and commissions, but before offering expenses. |
|
|
• |
We determine our future capital and operating requirements based upon our current and projected operating performance and the extent of our contractual commitments. We expect to be able to finance our future operations through cash flows from our asset liquidation business, proceeds from the 2020 Public Offering, and draws on the Credit Facility, as needed. Capital requirements are generally limited to repayment of our debt obligations, investments in notes receivables, purchases of surplus and distressed assets and payment on lease obligations. We believe that our current capital resources are sufficient for these requirements. In the event additional capital is needed, we will draw on the Credit Facility. |
Cash Position and Cash Flows
Cash and cash equivalents as of March 31, 2021 were $15.9 million as compared to $23.4 million as of December 31, 2020, a decrease of approximately $7.5 million.
Cash used in operating activities. Cash used in operations was $5.8 million during the three months ended March 31, 2021 as compared to $0.1 million during the same period in 2020. The approximate $5.7 million increase in cash used in operations was primarily attributable to a change of $6.7 million in operating assets and liabilities during the three months ended March 31, 2021 as compared to the same period in 2020. The amount was partially offset by a decrease in cash used in operations due to a change in net income adjusted for noncash items, which was $1.0 million higher during the three months ended March 31, 2021 as compared to the same period in 2020.
The significant changes in operating assets and liabilities during the three months ended March 31, 2021 as compared to the same period in 2020 are primarily due to the nature of our operations. We earn revenue from discrete asset liquidation deals that vary considerably with respect to their magnitude and timing, and that can consist of fees, commissions, asset sale proceeds, or a combination thereof. The operating assets and liabilities associated with these deals are, therefore, subject to the same variability and can be quite different at the end of any given period.
Cash (used in) provided by investing activities. Cash used in investing activities during the three months ended March 31, 2021 was $1.6 million compared to cash provided by investing activities of $0.6 million during the same period in 2020. The approximate $2.2 million change was primarily attributable to approximately $4.0 million cash received on transfer of notes receivable to partners in the three months ended March 31, 2020, which was not recurring in the same period in 2021. The amount was partially offset by a decrease in the net cash used in investments in notes receivable in excess of payments received on notes receivable of approximately $1.6 million.
Cash used in financing activities. Cash used in financing activities was $0.1 million during the three months ended March 31, 2021 and 2020. Financing activities during the three months ended March 31, 2021 consisted primarily of payments of tax withholdings related to cashless exercises of stock option awards, in excess of proceeds from issuance of common stock related to standard exercises of stock option awards. Financing activities during the same period in 2020 consisted of draws on the Credit Facility of $4.4 million and repayments of third party loans of $4.5 million (including $4.4 million on the Credit Facility).
25
Contractual Obligations
Our significant contractual obligations are our third party loans, client and partner asset liquidation settlement payments and lease obligations. The loan and lease obligations are fully described in the notes to the financial statements included in our Form 10-K.
On October 27, 2020, Heritage Global Partners, Inc. (“HGP”), a wholly-owned subsidiary of the Company, entered into an agreement (the “Lease”) with Hayward FGHK Industrial, LLC (“Landlord”) pursuant to which HGP will lease 30,321 square feet of industrial space in Hayward, California from Landlord. The Lease has a commencement date of April 1, 2021 and an initial term of ninety (90) months, unless terminated earlier by either party pursuant to the terms of the Lease. The Lease provides for an initial monthly base rent of $27,289, which increases on an annual basis to $33,562 per month in the final year. In addition, HGP is obligated to pay its share of maintenance costs of common areas. The Company is a guarantor of HGP’s obligations under the Lease, including the payment of rent. There is no material relationship between the Company, or any of its affiliates, and the landlord, or any of its affiliates, other than the contractual relationship under the Lease.
On March 30, 2021, the Company and Scott West entered into a Separation Agreement and General Release (the “Separation Agreement”). Under the terms of the Separation Agreement, Mr. West’s separation from the Company was effective on March 31, 2021. Mr. West will receive a payment of $200,000 (payable in equal installments over six months) and monthly payments of $775 for up to a year to offset health coverage costs. Further, Mr. West received 25,000 shares of the Company’s common stock, which will be forfeited to the Company during the two years following the effective date of the Separation Agreement in the event Mr. West breaches the terms of the Separation Agreement. In addition, the Separation Agreement provides for customary mutual releases by the Company and Mr. West, and the Separation Agreement includes confidentiality, non-disparagement and other obligations.
Management’s Discussion of Results of Operations
The following table sets out the Company’s condensed consolidated results of operations for the three months ended March 31, 2021 and 2020 (dollars in thousands).
|
|
|
Three Months Ended March 31, |
|
|
Change |
|
||||||||||
|
|
|
2021 |
|
|
2020 |
|
|
Dollars |
|
|
Percent |
|
||||
|
Revenues: |
|
|
|
|
|
|
|
|
|
|
|
|
|
|
|
|
|
Services revenue |
|
$ |
5,030 |
|
|
$ |
4,088 |
|
|
$ |
942 |
|
|
|
23 |
% |
|
Asset sales |
|
|
2,071 |
|
|
|
156 |
|
|
|
1,915 |
|
|
|
1228 |
% |
|
Total revenues |
|
|
7,101 |
|
|
|
4,244 |
|
|
|
2,857 |
|
|
|
67 |
% |
|
|
|
|
|
|
|
|
|
|
|
|
|
|
|
|
|
|
|
Operating costs and expenses: |
|
|
|
|
|
|
|
|
|
|
|
|
|
|
|
|
|
Cost of services revenue |
|
|
1,175 |
|
|
|
551 |
|
|
|
624 |
|
|
|
113 |
% |
|
Cost of asset sales |
|
|
820 |
|
|
|
38 |
|
|
|
782 |
|
|
|
2058 |
% |
|
Selling, general and administrative |
|
|
3,969 |
|
|
|
3,472 |
|
|
|
497 |
|
|
|
14 |
% |
|
Depreciation and amortization |
|
|
91 |
|
|
|
90 |
|
|
|
1 |
|
|
|
1 |
% |
|
Total operating costs and expenses |
|
|
6,055 |
|
|
|
4,151 |
|
|
|
1,904 |
|
|
|
46 |
% |
|
Earnings of equity method investments |
|
|
— |
|
|
|
1 |
|
|
|
(1 |
) |
|
|
(100 |
)% |
|
Operating income |
|
|
1,046 |
|
|
|
94 |
|
|
|
952 |
|
|
|
1013 |
% |
|
Interest and other expense, net |
|
|
3 |
|
|
|
(27 |
) |
|
|
30 |
|
|
|
111 |
% |
|
Income before income tax expense |
|
|
1,049 |
|
|
|
67 |
|
|
|
982 |
|
|
|
1466 |
% |
|
Income tax expense |
|
|
17 |
|
|
|
29 |
|
|
|
(12 |
) |
|
|
(41 |
)% |
|
Net income |
|
$ |
1,032 |
|
|
$ |
38 |
|
|
$ |
994 |
|
|
|
2616 |
% |
Our asset liquidation business model has several components: (1) traditional fee-based asset disposition services, such as commissions from on-line and webcast auctions, liquidations and negotiated sales, and commissions from the NLEX charged-off receivables business, (2) the acquisition and subsequent disposition of distressed and surplus assets, including industrial machinery and equipment and real estate, and (3) fees earned for appraisal, management advisory services and specialty finance services.
We report segment information based on the “management” approach. The management approach designates the internal reporting used by management for making decisions and assessing performance as the source of our reportable segments. We manage our business primarily on differentiated revenue streams for services offered. Our reportable segments consist of the Industrial Asset Division and Financial Assets Division. Our Industrial Assets Division advises enterprise and financial customers on the sale of
26
industrial assets mostly from surplus and sometimes distressed circumstances while acting as an agent, guarantor or principal in the sale. Our Financial Assets Division provides liquidity to issuers of consumer credit that are looking to monetize nonperforming and charged-off loans — loans that creditors have written off as uncollectable. Nonperforming and charged-off loans typically originate from banks that issue unsecured consumer credit.
We evaluate the performance of its reportable segments based primarily on net operating income. Further, we do not utilize segmented asset information to evaluate the performance of its reportable segments and we do not include intercompany transfers between segments for management reporting purposes.
The following table sets forth certain financial information for the Company's reportable segments (in thousands):
|
|
|
Three Months Ended March 31, |
|
|||||
|
|
|
2021 |
|
|
2020 |
|
||
|
Industrial Assets Division: |
|
|
|
|
|
|
|
|
|
Net operating income |
|
$ |
1,340 |
|
|
$ |
47 |
|
|
|
|
|
|
|
|
|
|
|
|
Financial Assets Division: |
|
|
|
|
|
|
|
|
|
Net operating income |
|
$ |
461 |
|
|
$ |
552 |
|
|
|
|
|
|
|
|
|
|
|
|
Corporate and Other: |
|
|
|
|
|
|
|
|
|
Net operating loss |
|
$ |
(755 |
) |
|
$ |
(505 |
) |
|
|
|
|
|
|
|
|
|
|
|
Consolidated: |
|
|
|
|
|
|
|
|
|
Net operating income |
|
$ |
1,046 |
|
|
$ |
94 |
|
Three-Month Period Ended March 31, 2021 Compared to Three-Month Period Ended March 31, 2020
Revenues and cost of revenues – Revenues were $7.1 million during the three months ended March 31, 2021 compared to $4.2 million during the same period in 2020. Costs of services revenue and asset sales were $2.0 million during the three months ended March 31, 2021 compared to $0.6 million during the same period in 2020. The gross profit of these items was $5.1 million during the three months ended March 31, 2021 compared to $3.7 million during the same period in 2020, an increase of approximately $1.4 million, or approximately 38%. The increased gross profit in the first quarter of 2021 reflects the vagaries of the timing and magnitude of asset liquidation transactions.
Selling, general and administrative expense – Selling, general and administrative expense was $4.0 million during the three months ended March 31, 2021 and $3.5 million during the same period in 2020.
27
Significant components of selling, general and administrative expense for the three months ended March 31, 2021 and March 31, 2020 are shown below (dollars in thousands):
|
|
|
Three Months Ended March 31, |
|
|
|
|
|
|||||
|
|
|
2021 |
|
|
2020 |
|
|
% change |
|
|||
|
Compensation |
|
|
|
|
|
|
|
|
|
|
|
|
|
HGP |
|
$ |
1,613 |
|
|
$ |
1,045 |
|
|
|
54 |
% |
|
NLEX |
|
|
873 |
|
|
|
945 |
|
|
|
(8 |
)% |
|
HGI |
|
|
288 |
|
|
|
201 |
|
|
|
43 |
% |
|
HGC |
|
|
130 |
|
|
|
117 |
|
|
|
11 |
% |
|
Stock-based compensation |
|
|
143 |
|
|
|
75 |
|
|
|
91 |
% |
|
|
|
|
|
|
|
|
|
|
|
|
|
|
|
Consulting |
|
|
13 |
|
|
|
48 |
|
|
|
(73 |
)% |
|
Board of Directors fees |
|
|
67 |
|
|
|
64 |
|
|
|
5 |
% |
|
Accounting, tax and legal professional fees |
|
|
255 |
|
|
|
227 |
|
|
|
12 |
% |
|
Insurance |
|
|
121 |
|
|
|
99 |
|
|
|
22 |
% |
|
Occupancy |
|
|
222 |
|
|
|
220 |
|
|
|
1 |
% |
|
Travel and entertainment |
|
|
39 |
|
|
|
176 |
|
|
|
(78 |
)% |
|
Advertising and promotion |
|
|
87 |
|
|
|
152 |
|
|
|
(43 |
)% |
|
Information technology support |
|
|
68 |
|
|
|
63 |
|
|
|
8 |
% |
|
Other |
|
|
50 |
|
|
|
40 |
|
|
|
25 |
% |
|
Total selling, general & administrative expense |
|
$ |
3,969 |
|
|
$ |
3,472 |
|
|
|
14 |
% |
As compared to the first quarter of 2020, there was an increase in selling, general and administrative expense during the first quarter of 2021 due to increased compensation expense within our HGI and HGP divisions as a result of improved financial performance and a one-time expense related to the Separation Agreement. This increase was offset by decreased compensation expense within our NLEX division as a result of declined financial performance, and decreased travel expense as a result of travel restrictions related to the COVID-19 pandemic.
Depreciation and amortization expense – Depreciation and amortization expense was $0.1 million during the three months ended March 31, 2021 and the same period in 2020, which consisted primarily of amortization expense related to intangible assets.
Key Performance Indicators
We monitor a number of financial and non-financial measures on a regular basis in order to track our underlying operational performance and trends. Other than the operating income of our liquidation business (a GAAP financial measure as shown in our condensed consolidated income statements), which we believe is the most important measure of our operational performance and trends, we believe that EBITDA and Adjusted EBITDA (non-GAAP financial measures) are key performance indicators (KPIs) for our business. These KPIs may not be defined or calculated in the same way as similar KPIs used by other companies.
28
We prepared our unaudited condensed consolidated financial statements in accordance with GAAP. We define EBITDA as net income plus depreciation and amortization, interest and other expense, and provision for income taxes. Adjusted EBITDA reflects EBITDA adjusted further to eliminate the effects of stock-based compensation. Management uses EBITDA and Adjusted EBITDA in assessing the Company’s results, evaluating the Company’s performance and in reaching operating and strategic decisions. Management believes that the presentation of EBITDA and Adjusted EBITDA, when considered together with our GAAP financial statements and the reconciliation to the most directly comparable GAAP financial measure, is useful in providing investors a more complete understanding of the factors and trends affecting the underlying performance of the Company on a historical and ongoing basis. Our use of EBITDA and Adjusted EBITDA is not meant to be, and should not be, considered in isolation or as a substitute for, or superior to, any GAAP financial measure. You should carefully evaluate the financial information below, which reconciles our GAAP reported net income to EBITDA and Adjusted EBITDA for the periods presented (in thousands).
|
|
|
Three Months Ended March 31, |
|
|||||
|
|
|
2021 |
|
|
2020 |
|
||
|
Net income |
|
$ |
1,032 |
|
|
$ |
38 |
|
|
Add back: |
|
|
|
|
|
|
|
|
|
Depreciation and amortization |
|
|
91 |
|
|
|
90 |
|
|
Interest and other expense, net |
|
|
(3 |
) |
|
|
27 |
|
|
Income tax expense |
|
|
17 |
|
|
|
29 |
|
|
EBITDA |
|
|
1,137 |
|
|
|
184 |
|
|
|
|
|
|
|
|
|
|
|
|
Management add back: |
|
|
|
|
|
|
|
|
|
Stock based compensation |
|
|
143 |
|
|
|
75 |
|
|
Separation Agreement |
|
|
200 |
|
|
|
— |
|
|
Adjusted EBITDA |
|
$ |
1,480 |
|
|
$ |
259 |
|
Item 3. Quantitative and Qualitative Disclosures about Market Risk.
As a Smaller Reporting Company, we are not required to provide the information required by this item.
Item 4. Controls and Procedures.
As of the end of the period covered by this Report, our Chief Executive Officer and Principal Financial Officer (the “Certifying Officers”) conducted evaluations of our disclosure controls and procedures. As defined in Rules 13a-15(e) and 15d-15(e) of the Securities Exchange Act of 1934, as amended (the “Exchange Act”), the term “disclosure controls and procedures” means controls and other procedures of an issuer that are designed to ensure that information required to be disclosed by the issuer in the reports that it files or submits under the Exchange Act is recorded, processed, summarized and reported, within the time periods specified in the SEC’s rules and forms. Disclosure controls and procedures include, without limitation, controls and procedures designed to ensure that information required to be disclosed by an issuer in the reports that it files or submits under the Exchange Act is accumulated and communicated to the issuer’s management, including the Certifying Officers, to allow timely decisions regarding required disclosure. Based on this evaluation, the Certifying Officers have concluded that our disclosure controls and procedures were effective.
Further, there were no changes in our internal control over financial reporting during the three months ended March 31, 2021 that have materially affected, or are reasonably likely to materially affect, our internal control over financial reporting.
29
There have been no material changes to the legal proceedings discussed in our Form 10-K.
As a Smaller Reporting Company, we are not required to provide the information required by this item.
Item 2. Unregistered Sales of Equity Securities and Use of Proceeds.
On March 10, 2021, the Company issued 12,019 shares of common stock to certain accredited personnel pursuant to the exercise of stock options. These securities were issued in reliance on the exemptions set forth in Rule 506(b) of Regulation D under the Securities Act of 1933 (the “Act”), as amended and Section 4(a)(2) of the Act, respectively.
Item 3. Defaults Upon Senior Securities.
None.
Item 4. Mine Safety Disclosures.
Not applicable.
New Credit Facility
On May 11, 2021, the Company entered into a promissory note, business loan agreement, commercial security agreement and pledge agreement (the “New Credit Facility”) with C3bank, National Association for a $10.0 million revolving line of credit. The New Credit Facility matures on May 11, 2023 and replaces the Credit Facility. The Company is permitted to use the proceeds of the loan solely for its business operations.
The New Credit Facility accrues at a variable interest rate, which is based on the rate of interest last quoted by The Wall Street Journal as the “prime rate,” plus a margin of 1.70% (such rate not to be less than 4.950% per annum). The Company will pay interest on the New Credit Facility in regular monthly payments, beginning on June 11, 2021. The New Credit Facility also provides for a minimum fee, which is offset by interest payments. The Company may prepay the New Credit Facility without penalty and may convert up to $5.0 million of revolving debt into term debt.
The Company is the borrower under the New Credit Facility. The New Credit Facility is secured by a security interest in certain of the Company’s and its certain subsidiaries’ current and future tangible and intangible assets, inventory, chattel paper, accounts, equipment and general intangibles and a pledge of the equity of the direct and indirect subsidiaries of the Company.
The availability of additional draws under the New Credit Facility is conditioned, among other things, on the compliance with certain customary representations and warranties, including default, insolvency or bankruptcy, material adverse change in financial condition and any guarantor’s attempt to revise its guarantee. The agreement governing the New Credit Facility also contains customary affirmative covenants regarding, among other things, the maintenance of records, maintenance of certain insurance coverage, compliance with governmental requirements and maintenance of several financial covenants.
The New Credit Facility contains certain customary financial covenants and negative covenants that, among other things, include restrictions on the Company’s ability to create, incur or assume indebtedness for borrowed money, including capital leases or to sell, transfer, mortgage, assign, pledge, lease, grant a security interest in, or encumber any of the Company’s assets.
On May 11, 2021, the Company terminated the Credit Facility as a result of entry into the New Credit Facility. A description of the material terms and conditions of the Credit Facility are included in the “Liquidity and Capital Resources—Liquidity” section of Part I, Item 2 contained in this Quarterly Report on Form 10-Q.
This summary is qualified in its entirety by reference to the full text of the promissory note, business loan agreement, and commercial security agreement, which are attached hereto as Exhibit 10.2, 10.3, and 10.4, respectively, and incorporated by reference herein.
30
(a) Exhibits
|
Exhibit No. |
|
Identification of Exhibit |
|
3.1 |
|
|
|
3.2 |
|
|
|
|
|
|
|
4.1 |
|
|
|
10.1 |
|
Separation Agreement, dated March 30, 2021, by and between Heritage Global Inc. and Scott West
|
|
10.2 |
|
|
|
|
|
|
|
10.3 |
|
|
|
|
|
|
|
10.4 |
|
|
|
|
|
|
|
10.5 |
|
|
|
|
|
|
|
10.6 |
|
Side Letter, dated May 5, 2021, by and between Heritage Global Inc. and C3bank, National Association |
|
|
|
|
|
31.1 |
|
|
|
|
|
|
|
31.2 |
|
|
|
|
|
|
|
32.1 |
|
|
|
|
|
|
|
32.2 |
|
|
|
|
|
|
|
101.INS |
|
XBRL Instance Document |
|
|
|
|
|
101.SCH |
|
XBRL Taxonomy Extension Schema Document |
|
|
|
|
|
101.CAL |
|
XBRL Taxonomy Extension Calculation Linkbase Document |
|
|
|
|
|
101.DEF |
|
XBRL Taxonomy Extension Definition Linkbase Document |
|
|
|
|
|
101.LAB |
|
XBRL Taxonomy Extension Labels Linkbase Document |
|
|
|
|
|
101.PRE |
|
XBRL Taxonomy Extension Presentation Linkbase Document |
|
|
|
|
31
Pursuant to the requirements of the Securities Exchange Act of 1934, the Registrant has duly caused this report to be signed on its behalf by the undersigned thereunder duly authorized.
|
|
|
Heritage Global Inc. |
||
|
|
|
|
|
|
|
Date: May 13, 2021 |
|
By: |
|
/s/ Ross Dove |
|
|
|
|
|
Ross Dove |
|
|
|
|
|
Chief Executive Officer |
|
|
|
|
|
(Principal Executive Officer) |
|
|
|
|
|
|
|
|
|
By: |
|
/s/ Brian J. Cobb |
|
|
|
|
|
Brian J. Cobb |
|
|
|
|
|
Vice President of Finance and Controller |
|
|
|
|
|
(Principal Financial Officer) |
32