Attached files
| file | filename |
|---|---|
| 8-K - 8-K - Lonestar Resources US Inc. | lone-8xkmay122021earningsc.htm |
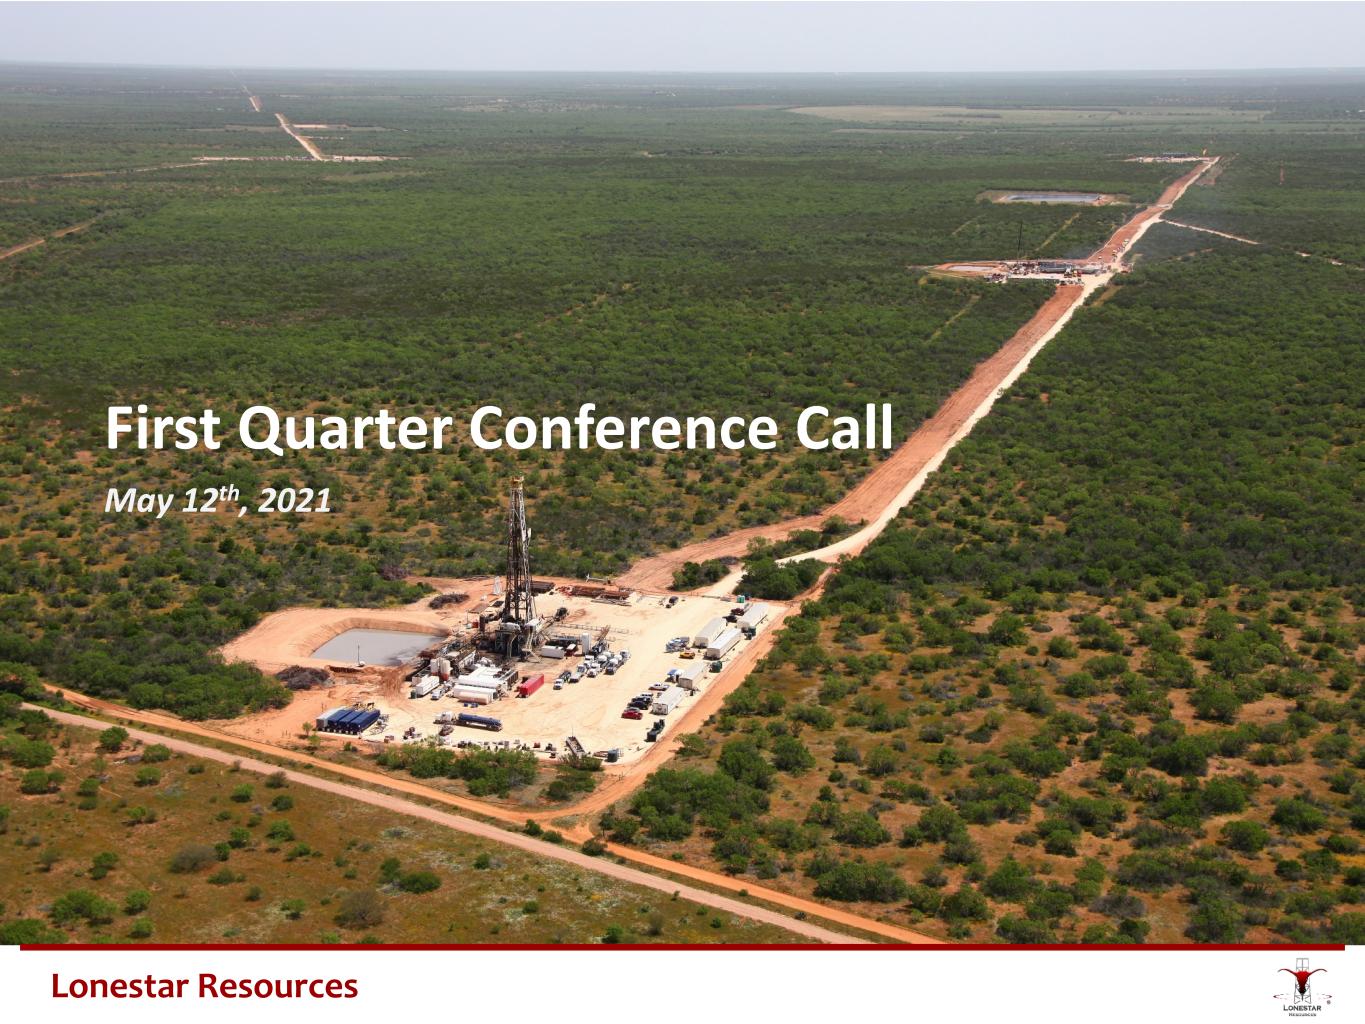
1 First Quarter Conference Call May 12th, 2021 Lonestar Resources
Lonestar Resources 2 Forward Looking Statements The information in this presentation includes “forward-looking statements” that are made pursuant to the Safe Harbor Provisions of the Private Securities Litigation Reform Act of 1995. All statements, other than statements of historical fact included in this presentation, regarding our strategy, future operations, financial position, projected costs, prospects, plans and objectives of management are forward-looking statements. When used in this presentation, the words “could,” “believe,” “anticipate,” “intend,” “estimate,” “expect,” “may,” “continue,” “predict,” “potential,” “project” and similar expressions are intended to identify forward-looking statements, although not all forward-looking statements contain such identifying words. These forward-looking statements are based on Lonestar Resources US Inc.’s (“LONE” or the “Company”) current expectations and assumptions about future events and are based on currently available information as to the outcome and timing of future events. We caution you that these forward-looking statements are subject to all of the risks and uncertainties, most of which are difficult to predict and many of which are beyond our control, incident to the exploration for and development, production, gathering and sale of oil and natural gas. These risks include, but are not limited to, variations in the market demand for, and prices of, crude oil, NGLs and natural gas, lack of proved reserves, estimates of crude oil, NGLs and natural gas data, the adequacy of our capital resources and liquidity including, but not limited to, access to additional borrowing, borrowing capacity under our credit facilities, general economic and business conditions, failure to realize expected value creation from property acquisitions, uncertainties about our ability to replace reserves and economically develop our reserves, risks related to the concentration of our operations, drilling results, potential financial losses or earnings reductions from our commodity price risk management programs, potential adoption of new governmental regulations, our ability to satisfy future cash obligations and environmental costs and the risk factors discussed in or referenced in our filings with the United States Securities and Exchange Commission (“SEC”), including our 2020 Annual Report on Form 10-K, our Quarterly Reports on Form 10-Q fpr the periods ended March 31, 2021, June 30, 2020 and September 30, 2020, respectively and our Current Reports on Form 8-K in each case as amended. You are cautioned not to place undue reliance on any forward-looking statements, which speak only as of the date of this presentation. Except as otherwise required by applicable law, we disclaim any duty to update any forward-looking statements, all of which are expressly qualified by the statements in this section, to reflect events or circumstances after the date of this presentation. Our production forecasts and expectations for future periods are dependent upon many assumptions, including estimates of production decline rates from existing wells and the undertaking and outcome of future drilling activity, which may be affected by significant commodity price declines or cost increases. Reconciliation of Non-GAAP Financial Measure EBITDAX is a financial measure that is not presented in accordance with generally accepted accounting principles in the United States (“GAAP”). Reconciliations of this non- GAAP financial measure can be found in this presentation. Industry and Market Data This presentation has been prepared by LONE and includes market data and other statistical information from third-party sources, including independent industry publications, government publications or other published independent sources. Although LONE believes these third-party sources are reliable as of their respective dates, LONE has not independently verified the accuracy or completeness of this information. Some data are also based on the LONE’s good faith estimates, which are derived from its review of internal sources as well as the third-party sources described above. This document and any related presentation do not constitute an offer or invitation to subscribe for or purchase any securities, and it should not be construed as an offering document. Any decision to purchase securities in the context of a proposed offering, if any, should be made on the basis of information contained in the offering document related to such an offering. This presentation does not constitute a recommendation regarding any securities of Lonestar Resources America, Inc. or Lonestar Resources US Inc. Disclaimer and Forward-Looking Statements
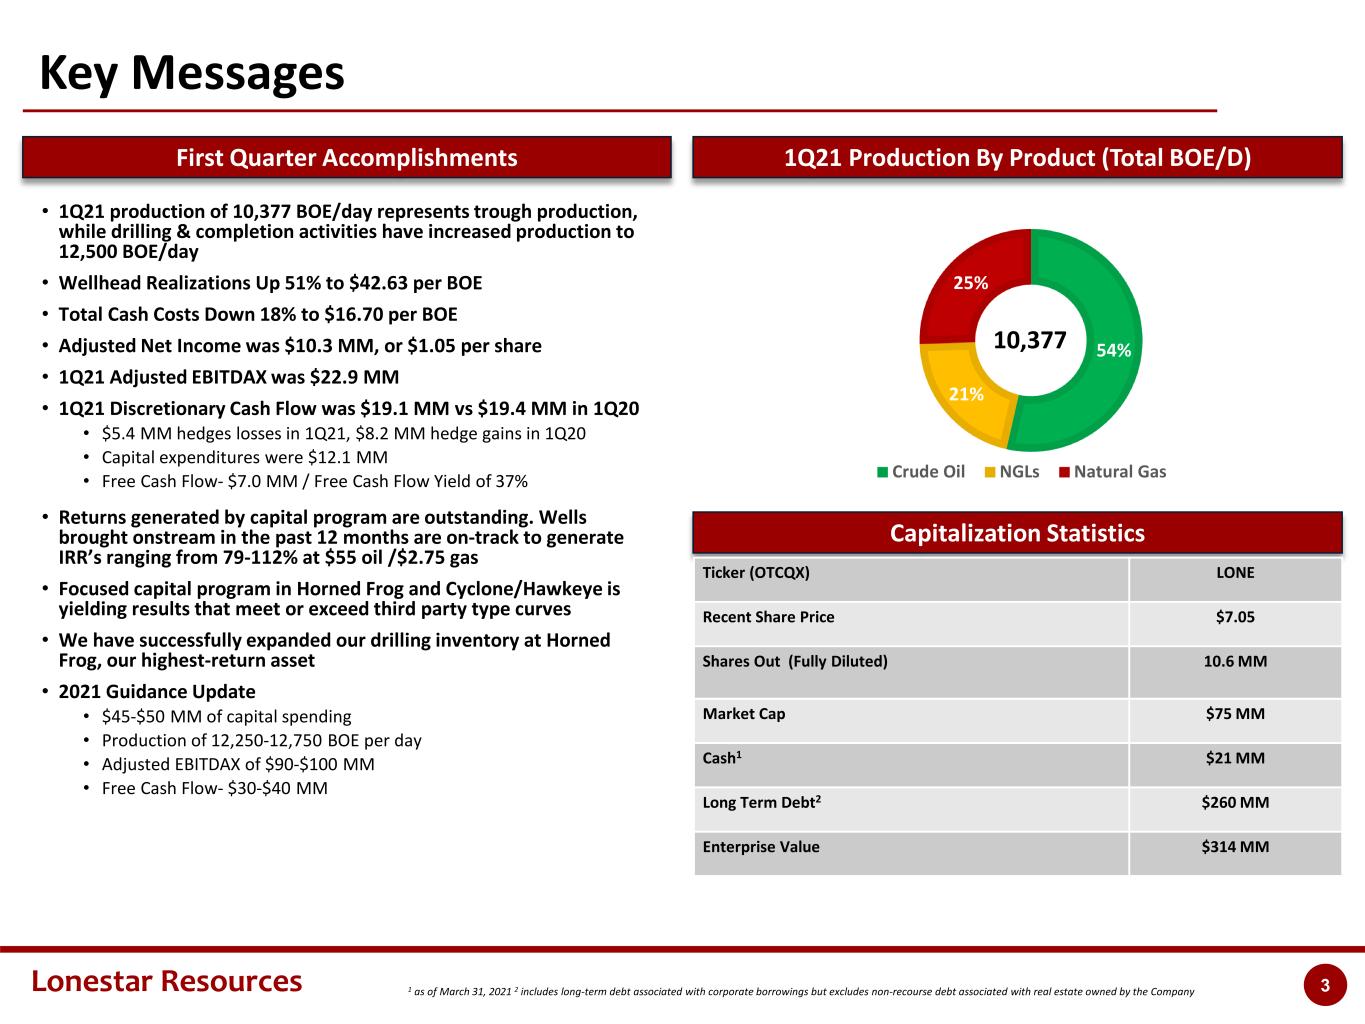
Lonestar Resources 3 Key Messages First Quarter Accomplishments 1Q21 Production By Product (Total BOE/D) Capitalization Statistics 54% 21% 25% Crude Oil NGLs Natural Gas 10,377 • 1Q21 production of 10,377 BOE/day represents trough production, while drilling & completion activities have increased production to 12,500 BOE/day • Wellhead Realizations Up 51% to $42.63 per BOE • Total Cash Costs Down 18% to $16.70 per BOE • Adjusted Net Income was $10.3 MM, or $1.05 per share • 1Q21 Adjusted EBITDAX was $22.9 MM • 1Q21 Discretionary Cash Flow was $19.1 MM vs $19.4 MM in 1Q20 • $5.4 MM hedges losses in 1Q21, $8.2 MM hedge gains in 1Q20 • Capital expenditures were $12.1 MM • Free Cash Flow- $7.0 MM / Free Cash Flow Yield of 37% • Returns generated by capital program are outstanding. Wells brought onstream in the past 12 months are on-track to generate IRR’s ranging from 79-112% at $55 oil /$2.75 gas • Focused capital program in Horned Frog and Cyclone/Hawkeye is yielding results that meet or exceed third party type curves • We have successfully expanded our drilling inventory at Horned Frog, our highest-return asset • 2021 Guidance Update • $45-$50 MM of capital spending • Production of 12,250-12,750 BOE per day • Adjusted EBITDAX of $90-$100 MM • Free Cash Flow- $30-$40 MM 1 as of March 31, 2021 2 includes long-term debt associated with corporate borrowings but excludes non-recourse debt associated with real estate owned by the Company Ticker (OTCQX) LONE Recent Share Price $7.05 Shares Out (Fully Diluted) 10.6 MM Market Cap $75 MM Cash1 $21 MM Long Term Debt2 $260 MM Enterprise Value $314 MM
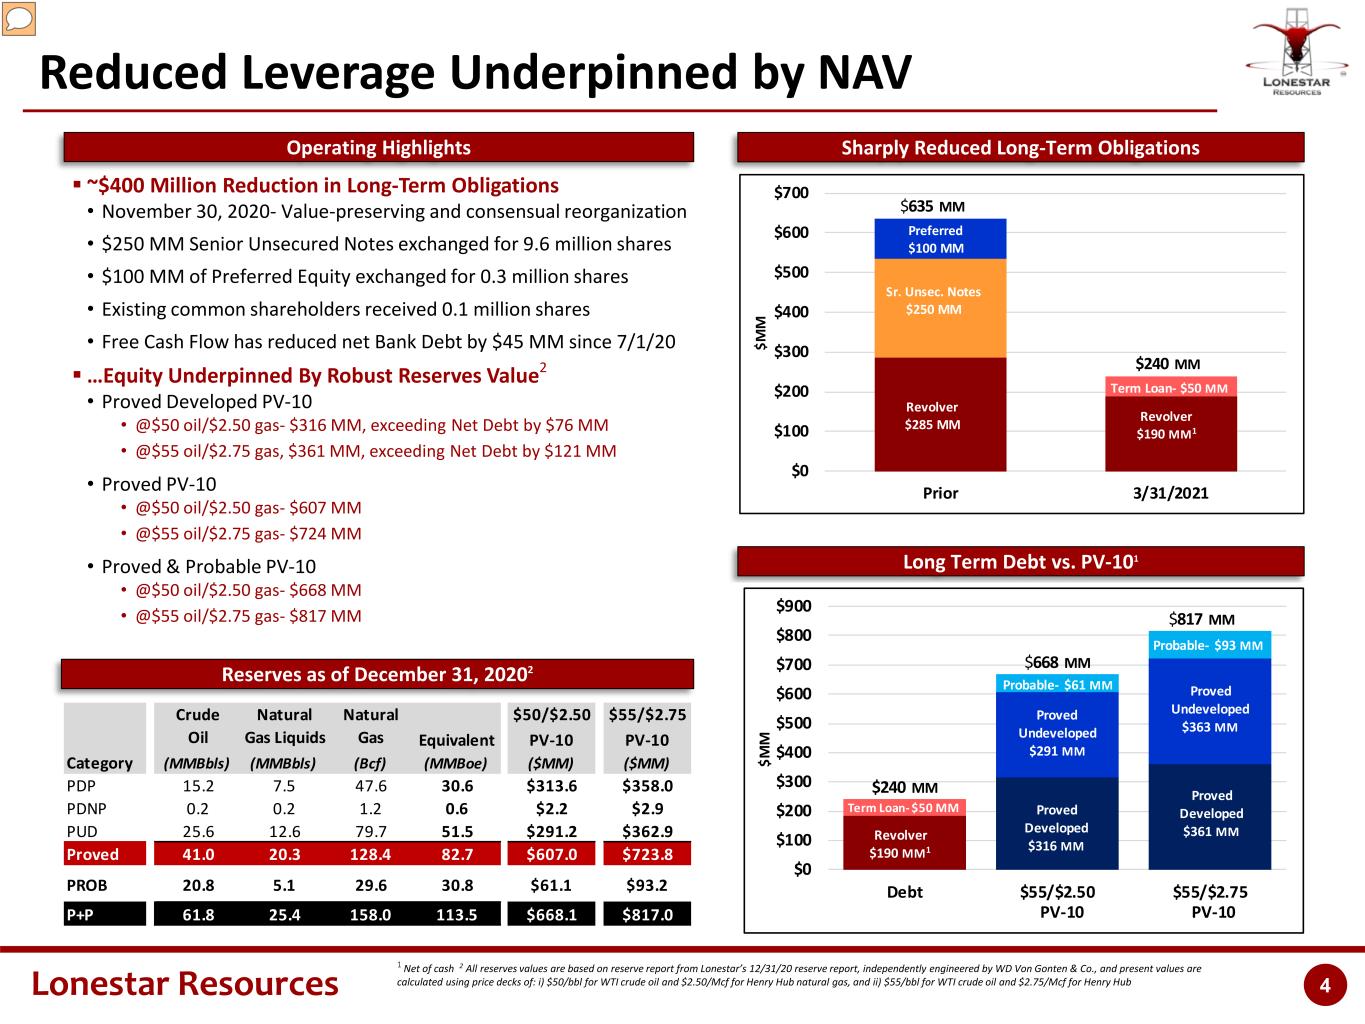
Lonestar Resources 4 $0 $100 $200 $300 $400 $500 $600 $700 Prior 3/31/2021 $M M Revolver $285 MM Revolver $190 MM1 Sr. Unsec. Notes $250 MM Preferred $100 MM Term Loan- $55 MM $635 MM $240 MM Term Loan- $50 MM Reduced Leverage Underpinned by NAV Sharply Reduced Long-Term Obligations ~$400 Million Reduction in Long-Term Obligations • November 30, 2020- Value-preserving and consensual reorganization • $250 MM Senior Unsecured Notes exchanged for 9.6 million shares • $100 MM of Preferred Equity exchanged for 0.3 million shares • Existing common shareholders received 0.1 million shares • Free Cash Flow has reduced net Bank Debt by $45 MM since 7/1/20 …Equity Underpinned By Robust Reserves Value2 • Proved Developed PV-10 • @$50 oil/$2.50 gas- $316 MM, exceeding Net Debt by $76 MM • @$55 oil/$2.75 gas, $361 MM, exceeding Net Debt by $121 MM • Proved PV-10 • @$50 oil/$2.50 gas- $607 MM • @$55 oil/$2.75 gas- $724 MM • Proved & Probable PV-10 • @$50 oil/$2.50 gas- $668 MM • @$55 oil/$2.75 gas- $817 MM Long Term Debt vs. PV-101 Reserves as of December 31, 20202 Operating Highlights 1 Net of cash 2 All reserves values are based on reserve report from Lonestar’s 12/31/20 reserve report, independently engineered by WD Von Gonten & Co., and present values are calculated using price decks of: i) $50/bbl for WTI crude oil and $2.50/Mcf for Henry Hub natural gas, and ii) $55/bbl for WTI crude oil and $2.75/Mcf for Henry Hub Crude Natural Natural $50/$2.50 $55/$2.75 Oil Gas Liquids Gas Equivalent PV-10 PV-10 Category (MMBbls) (MMBbls) (Bcf) (MMBoe) ($MM) ($MM) PDP 15.2 7.5 47.6 30.6 $313.6 $358.0 PDNP 0.2 0.2 1.2 0.6 $2.2 $2.9 PUD 25.6 12.6 79.7 51.5 $291.2 $362.9 Proved 41.0 20.3 128.4 82.7 $607.0 $723.8 PROB 20.8 5.1 29.6 30.8 $61.1 $93.2 P+P 61.8 25.4 158.0 113.5 $668.1 $817.0 $0 $100 $200 $300 $400 $500 $600 $700 $800 $900 Debt $55/$2.50 $55/$2.75 $M M Proved Developed $316 MM Revolver $190 MM1 $668 MM $817 MM Term Loan- $50 MM Proved Developed $361 MM Proved Undeveloped $291 MM Proved Undeveloped $363 MM Probable- $61 MM Probable- $93 MM PV-10 PV-10 $240 MM
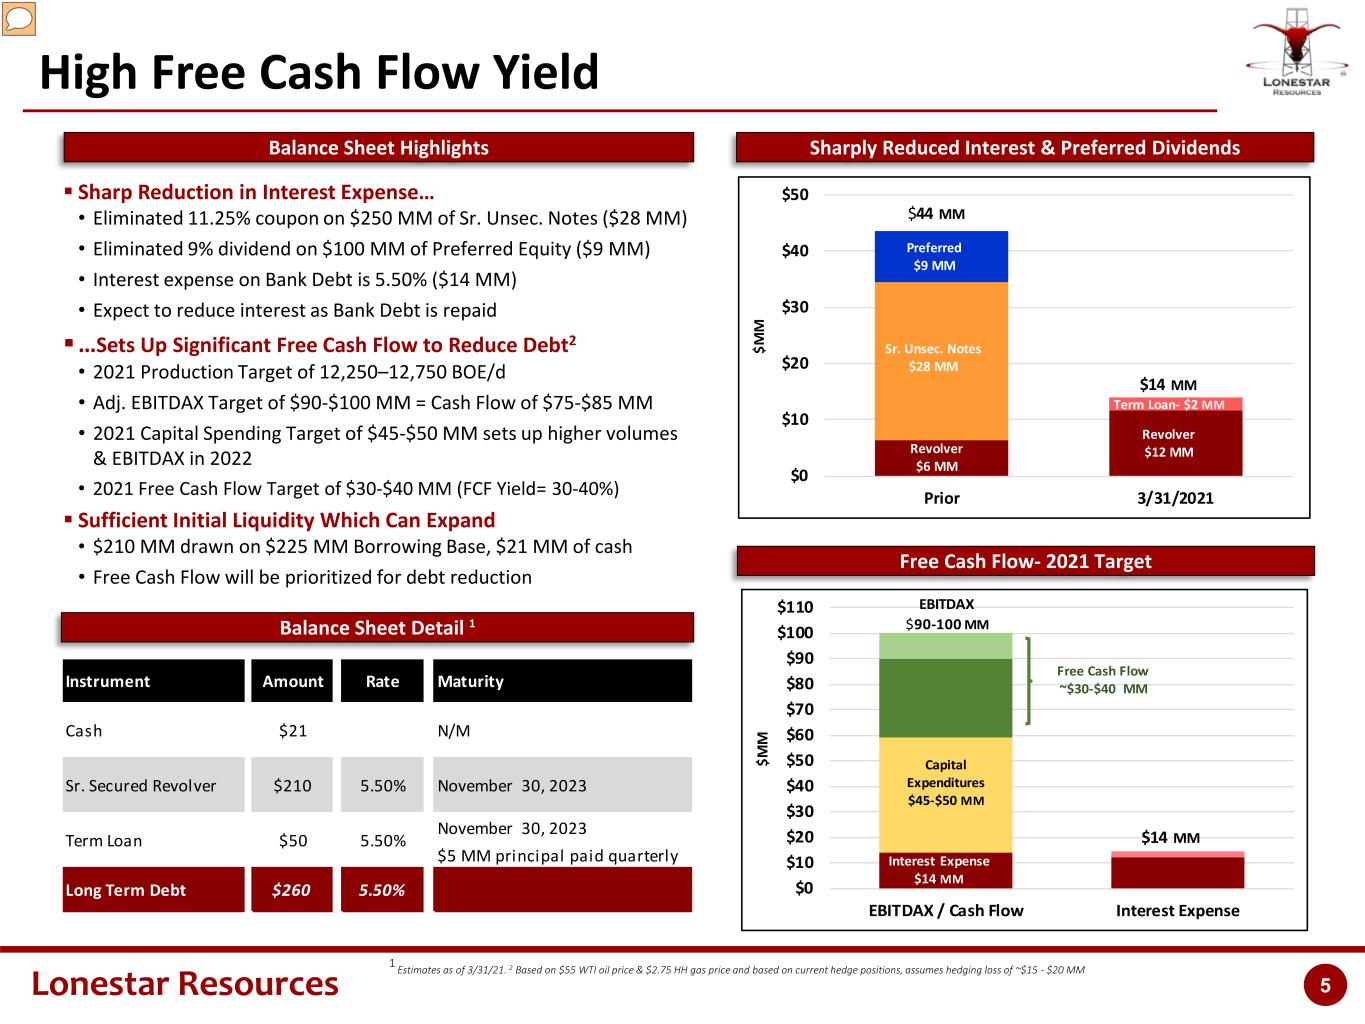
Lonestar Resources 5 Free Cash Flow- 2021 Target High Free Cash Flow Yield Sharply Reduced Interest & Preferred Dividends 1 Estimates as of 3/31/21. 2 Based on $55 WTI oil price & $2.75 HH gas price and based on current hedge positions, assumes hedging loss of ~$15 - $20 MM Sharp Reduction in Interest Expense… • Eliminated 11.25% coupon on $250 MM of Sr. Unsec. Notes ($28 MM) • Eliminated 9% dividend on $100 MM of Preferred Equity ($9 MM) • Interest expense on Bank Debt is 5.50% ($14 MM) • Expect to reduce interest as Bank Debt is repaid …Sets Up Significant Free Cash Flow to Reduce Debt2 • 2021 Production Target of 12,250–12,750 BOE/d • Adj. EBITDAX Target of $90-$100 MM = Cash Flow of $75-$85 MM • 2021 Capital Spending Target of $45-$50 MM sets up higher volumes & EBITDAX in 2022 • 2021 Free Cash Flow Target of $30-$40 MM (FCF Yield= 30-40%) Sufficient Initial Liquidity Which Can Expand • $210 MM drawn on $225 MM Borrowing Base, $21 MM of cash • Free Cash Flow will be prioritized for debt reduction Balance Sheet Detail 1 Balance Sheet Highlights November 30, 2023 $5 MM principal paid quarterly Long Term Debt $260 5.50% Maturity Term Loan $50 5.50% Instrument Amount Rate Cash $21 N/M Sr. Secured Revolver $210 5.50% November 30, 2023 $0 $10 $20 $30 $40 $50 Prior 3/31/2021 $M M Preferred $9 MM Sr. Unsec. Notes $28 MM Revolver $6 MM Revolver $12 MM Term Loan- $2 MM $44 MM $14 MM $0 $10 $20 $30 $40 $50 $60 $70 $80 $90 $100 $110 EBITDAX / Cash Flow Interest Expense $M M $14 MM Capital Expenditures $45-$50 MM Interest Expense $14 MM Free Cash Flow ~$30-$40 MM EBITDAX $90-100 MM
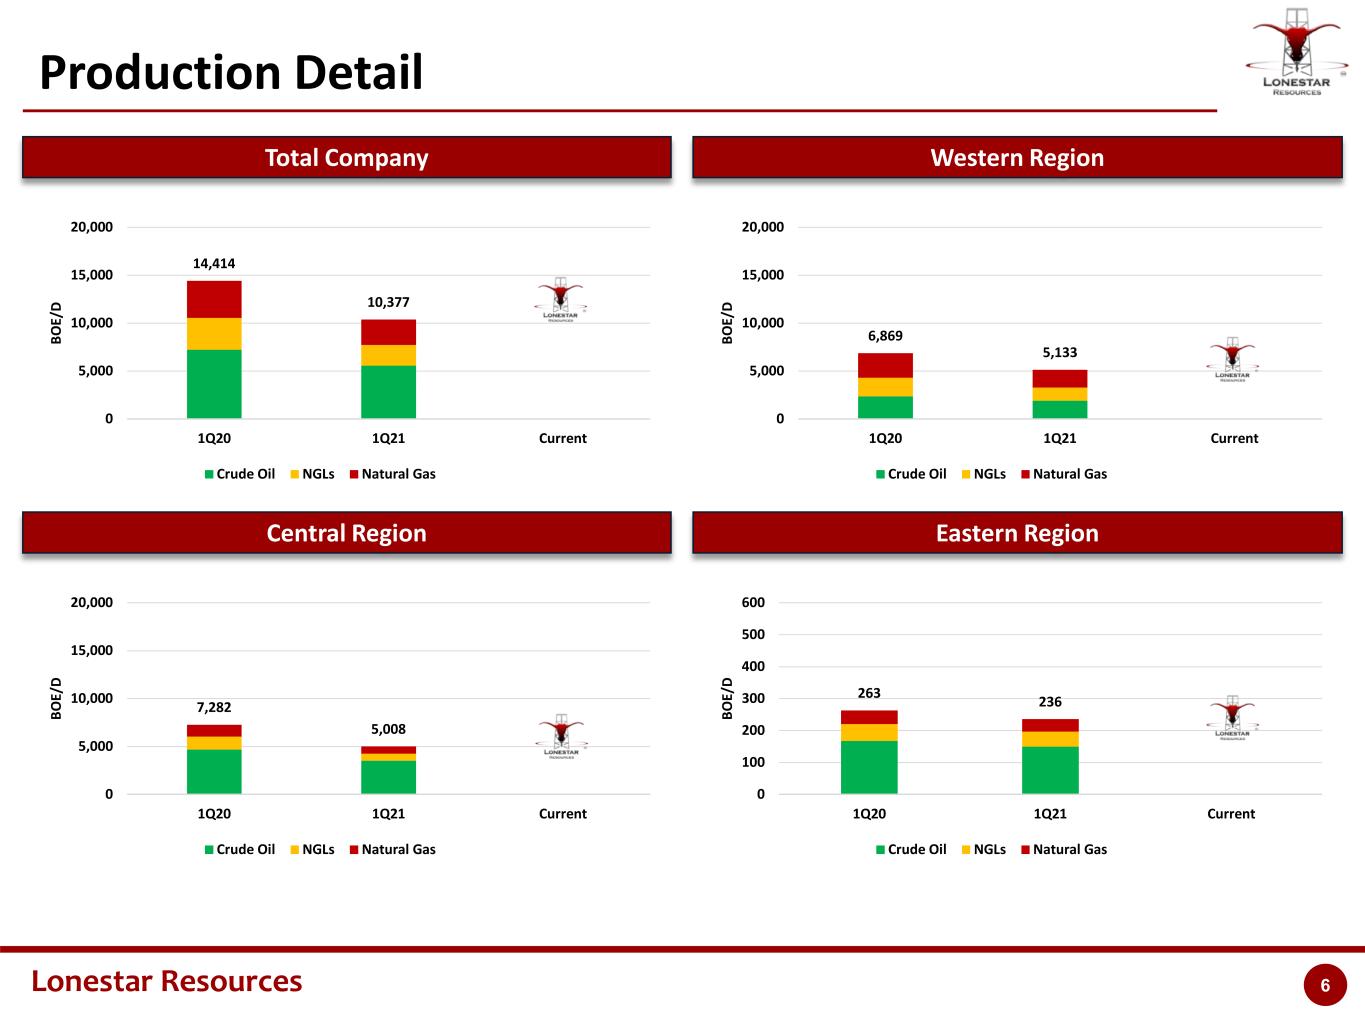
Lonestar Resources 6 6,869 5,133 0 5,000 10,000 15,000 20,000 1Q20 1Q21 Current BO E/ D Crude Oil NGLs Natural Gas Total 14,414 10,377 0 5,000 10,000 15,000 20,000 1Q20 1Q21 Current BO E/ D Crude Oil NGLs Natural Gas Total Production Detail Total Company Western Region Central Region Eastern Region 7,282 5,008 0 5,000 10,000 15,000 20,000 1Q20 1Q21 Current BO E/ D Crude Oil NGLs Natural Gas Total 263 236 0 100 200 300 400 500 600 1Q20 1Q21 Current BO E/ D Crude Oil NGLs Natural Gas Total
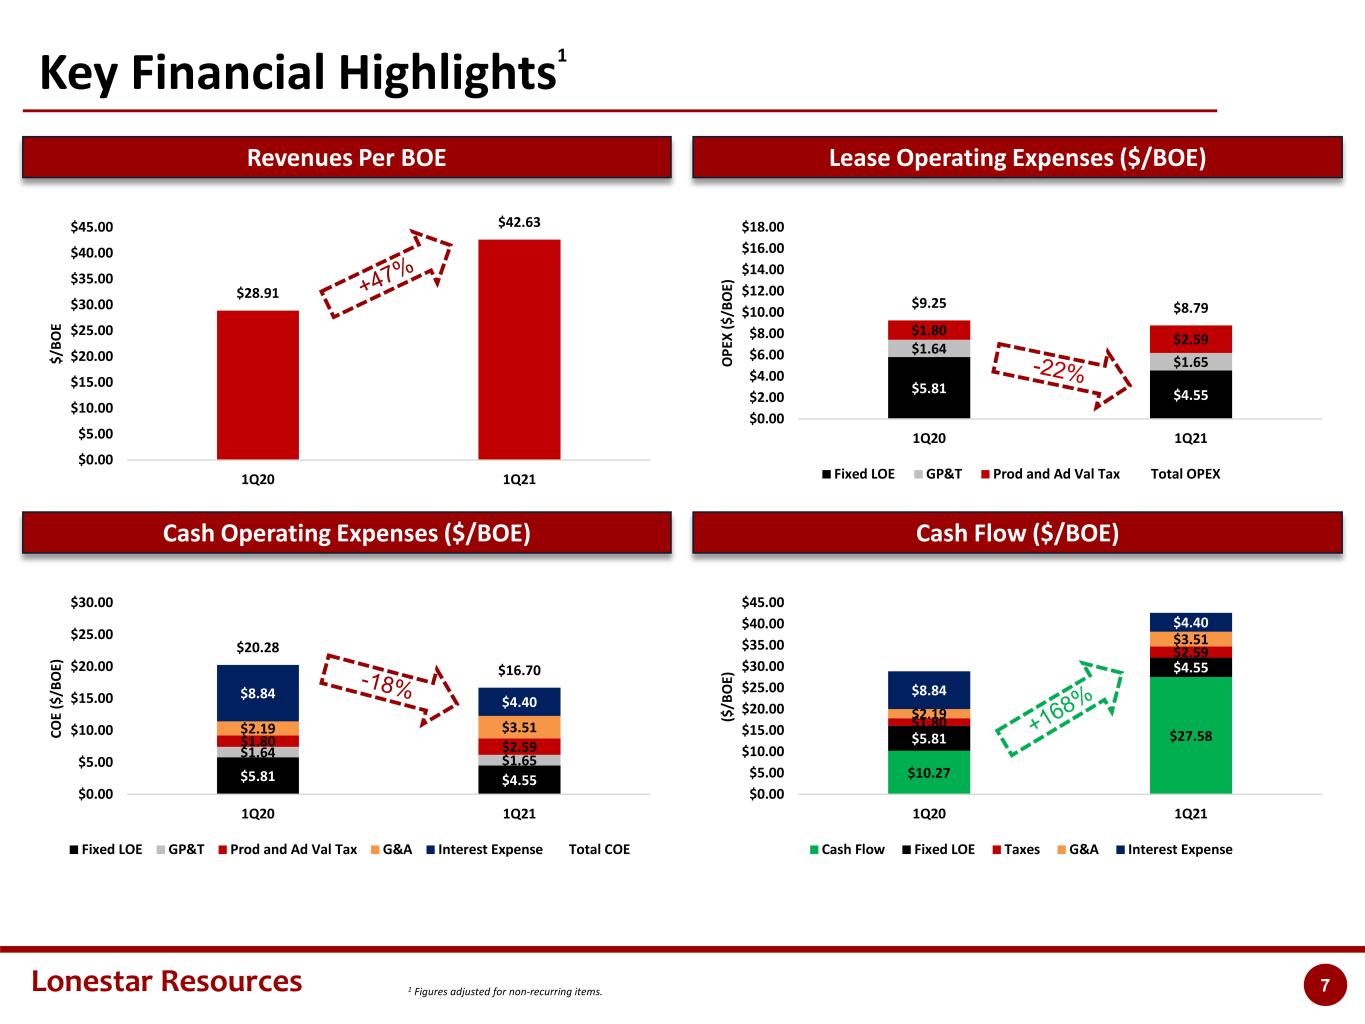
Lonestar Resources 7 $10.27 $27.58$5.81 $4.55 $1.80 $2.59 $2.19 $3.51 $8.84 $4.40 $0.00 $5.00 $10.00 $15.00 $20.00 $25.00 $30.00 $35.00 $40.00 $45.00 1Q20 1Q21 ($ /B O E) Cash Flow Fixed LOE Taxes G&A Interest Expense $5.81 $4.55 $1.64 $1.65 $1.80 $2.59 $2.19 $3.51 $8.84 $4.40 $20.28 $16.70 $0.00 $5.00 $10.00 $15.00 $20.00 $25.00 $30.00 1Q20 1Q21 CO E ($ /B O E) Fixed LOE GP&T Prod and Ad Val Tax G&A Interest Expense Total COE $5.81 $4.55 $1.64 $1.65 $1.80 $2.59 $9.25 $8.79 $0.00 $2.00 $4.00 $6.00 $8.00 $10.00 $12.00 $14.00 $16.00 $18.00 1Q20 1Q21 O PE X ($ /B O E) Fixed LOE GP&T Prod and Ad Val Tax Total OPEX 1 Figures adjusted for non-recurring items. Key Financial Highlights1 Revenues Per BOE Lease Operating Expenses ($/BOE) Cash Operating Expenses ($/BOE) Cash Flow ($/BOE) $28.91 $42.63 $0.00 $5.00 $10.00 $15.00 $20.00 $25.00 $30.00 $35.00 $40.00 $45.00 1Q20 1Q21 $/ BO E
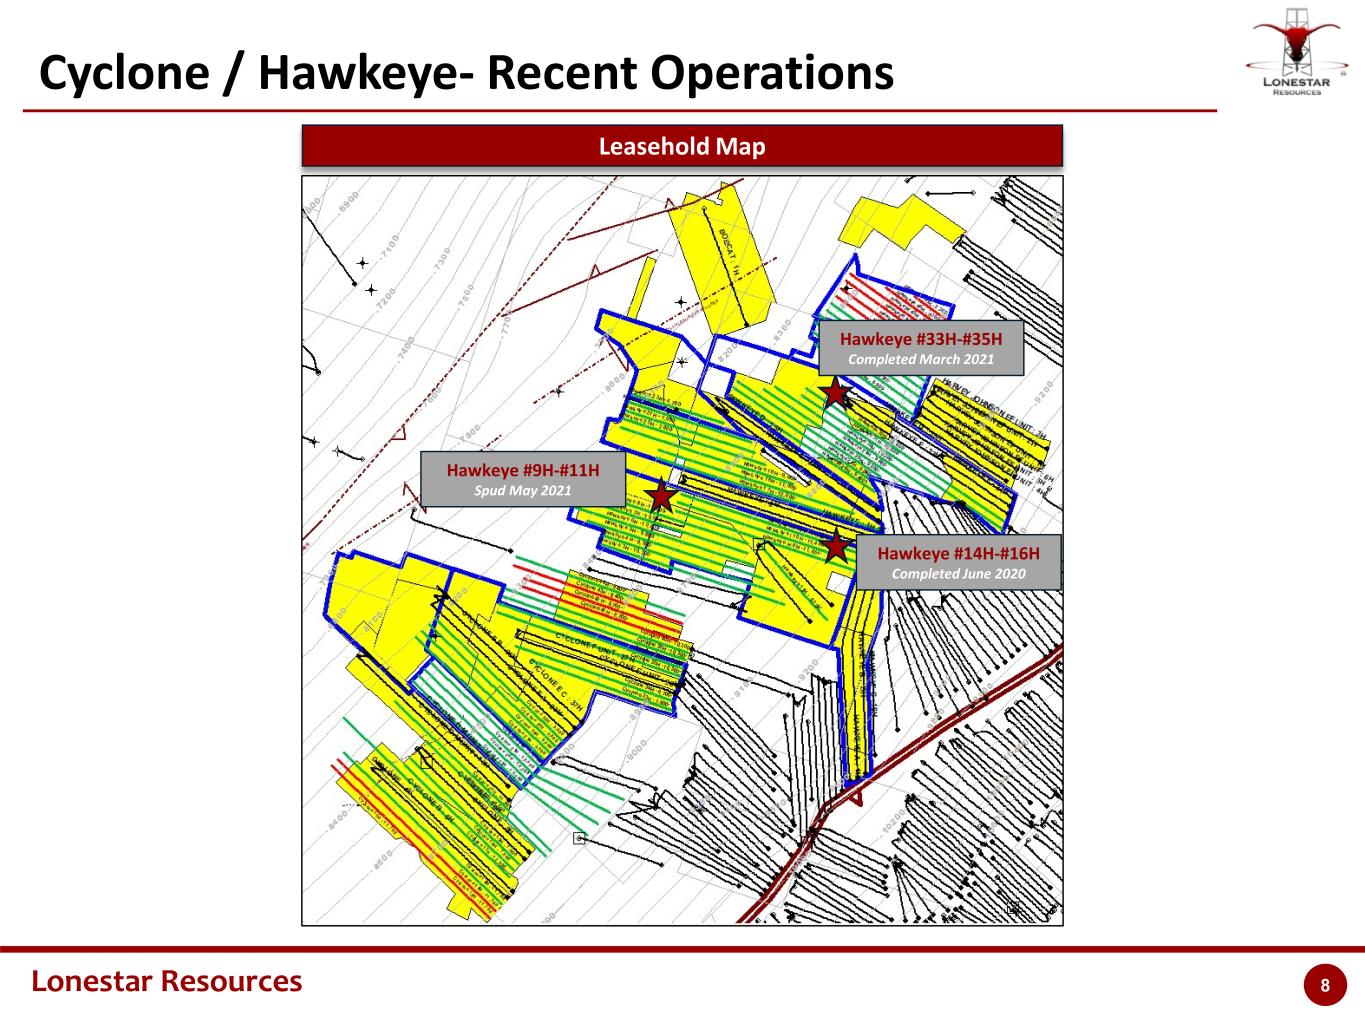
Lonestar Resources 8 Cyclone / Hawkeye- Recent Operations Leasehold Map Hawkeye #14H-#16H Completed June 2020 Hawkeye #33H-#35H Completed March 2021 Hawkeye #9H-#11H Spud May 2021
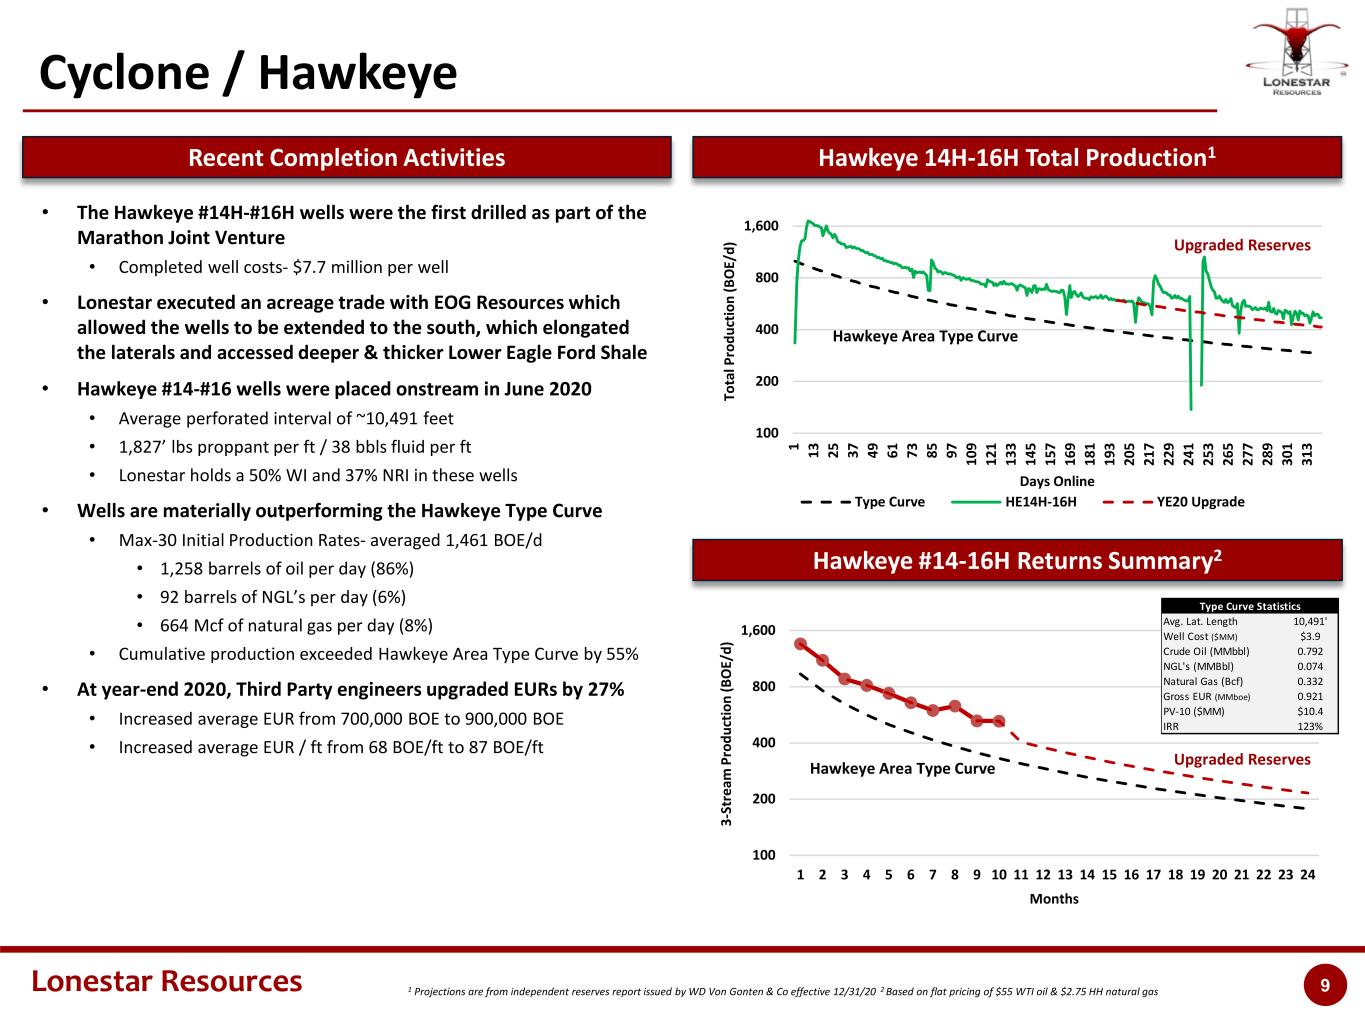
Lonestar Resources 9 Cyclone / Hawkeye • The Hawkeye #14H-#16H wells were the first drilled as part of the Marathon Joint Venture • Completed well costs- $7.7 million per well • Lonestar executed an acreage trade with EOG Resources which allowed the wells to be extended to the south, which elongated the laterals and accessed deeper & thicker Lower Eagle Ford Shale • Hawkeye #14-#16 wells were placed onstream in June 2020 • Average perforated interval of ~10,491 feet • 1,827’ lbs proppant per ft / 38 bbls fluid per ft • Lonestar holds a 50% WI and 37% NRI in these wells • Wells are materially outperforming the Hawkeye Type Curve • Max-30 Initial Production Rates- averaged 1,461 BOE/d • 1,258 barrels of oil per day (86%) • 92 barrels of NGL’s per day (6%) • 664 Mcf of natural gas per day (8%) • Cumulative production exceeded Hawkeye Area Type Curve by 55% • At year-end 2020, Third Party engineers upgraded EURs by 27% • Increased average EUR from 700,000 BOE to 900,000 BOE • Increased average EUR / ft from 68 BOE/ft to 87 BOE/ft Recent Completion Activities Hawkeye 14H-16H Total Production1 Hawkeye #14-16H Returns Summary2 100 200 400 800 1,600 1 13 25 37 49 61 73 85 97 10 9 12 1 13 3 14 5 15 7 16 9 18 1 19 3 20 5 21 7 22 9 24 1 25 3 26 5 27 7 28 9 30 1 31 3 To ta l P ro du ct io n (B O E/ d) Days Online Type Curve HE14H-16H YE20 Upgrade 1 Projections are from independent reserves report issued by WD Von Gonten & Co effective 12/31/20 2 Based on flat pricing of $55 WTI oil & $2.75 HH natural gas 100 200 400 800 1,600 1 2 3 4 5 6 7 8 9 10 11 12 13 14 15 16 17 18 19 20 21 22 23 24 3- St re am P ro du ct io n (B O E/ d) Months 10,491' $3.9 0.792 NGL's (MMBbl) 0.074 0.332 0.921 $10.4 123% Natural Gas (Bcf) Gross EUR (MMboe) PV-10 ($MM) IRR Type Curve Statistics Avg. Lat. Length Well Cost ($MM) Crude Oil (MMbbl) Hawkeye Area Type Curve Hawkeye Area Type Curve Upgraded Reserves Upgraded Reserves
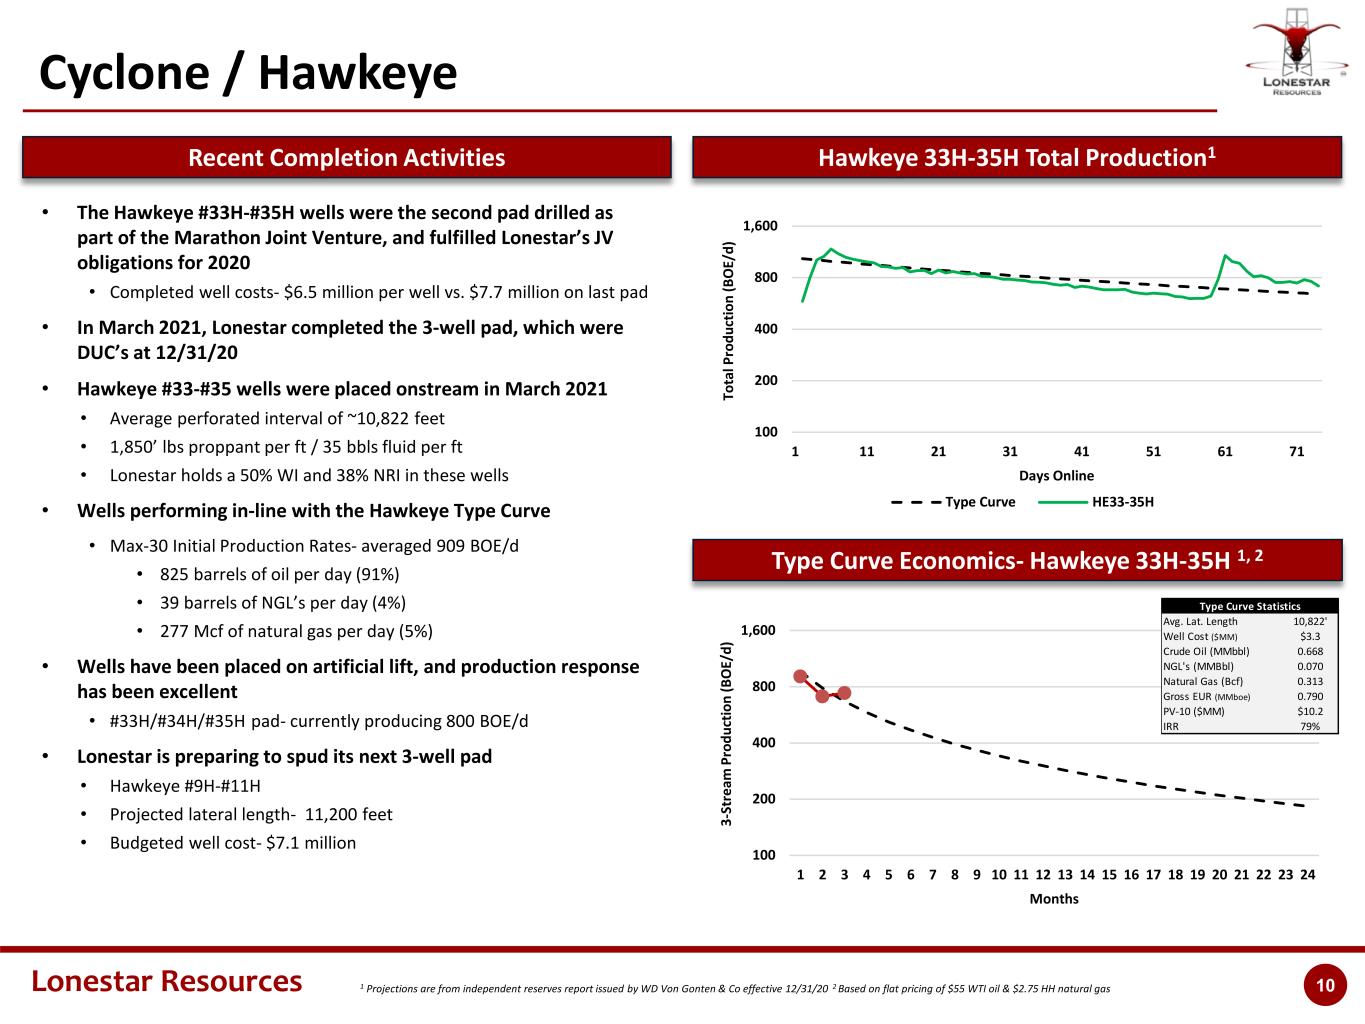
Lonestar Resources 10 100 200 400 800 1,600 1 2 3 4 5 6 7 8 9 10 11 12 13 14 15 16 17 18 19 20 21 22 23 24 3- St re am P ro du ct io n (B O E/ d) Months 1 Projections are from independent reserves report issued by WD Von Gonten & Co effective 12/31/20 2 Based on flat pricing of $55 WTI oil & $2.75 HH natural gas Cyclone / Hawkeye • The Hawkeye #33H-#35H wells were the second pad drilled as part of the Marathon Joint Venture, and fulfilled Lonestar’s JV obligations for 2020 • Completed well costs- $6.5 million per well vs. $7.7 million on last pad • In March 2021, Lonestar completed the 3-well pad, which were DUC’s at 12/31/20 • Hawkeye #33-#35 wells were placed onstream in March 2021 • Average perforated interval of ~10,822 feet • 1,850’ lbs proppant per ft / 35 bbls fluid per ft • Lonestar holds a 50% WI and 38% NRI in these wells • Wells performing in-line with the Hawkeye Type Curve • Max-30 Initial Production Rates- averaged 909 BOE/d • 825 barrels of oil per day (91%) • 39 barrels of NGL’s per day (4%) • 277 Mcf of natural gas per day (5%) • Wells have been placed on artificial lift, and production response has been excellent • #33H/#34H/#35H pad- currently producing 800 BOE/d • Lonestar is preparing to spud its next 3-well pad • Hawkeye #9H-#11H • Projected lateral length- 11,200 feet • Budgeted well cost- $7.1 million Recent Completion Activities Hawkeye 33H-35H Total Production1 100 200 400 800 1,600 1 11 21 31 41 51 61 71 To ta l P ro du ct io n (B O E/ d) Days Online Type Curve HE33-35H Type Curve Economics- Hawkeye 33H-35H 1, 2 10,822' $3.3 0.668 NGL's (MMBbl) 0.070 0.313 0.790 $10.2 79% Natural Gas (Bcf) Gross EUR (MMboe) PV-10 ($MM) IRR Type Curve Statistics Avg. Lat. Length Well Cost ($MM) Crude Oil (MMbbl)
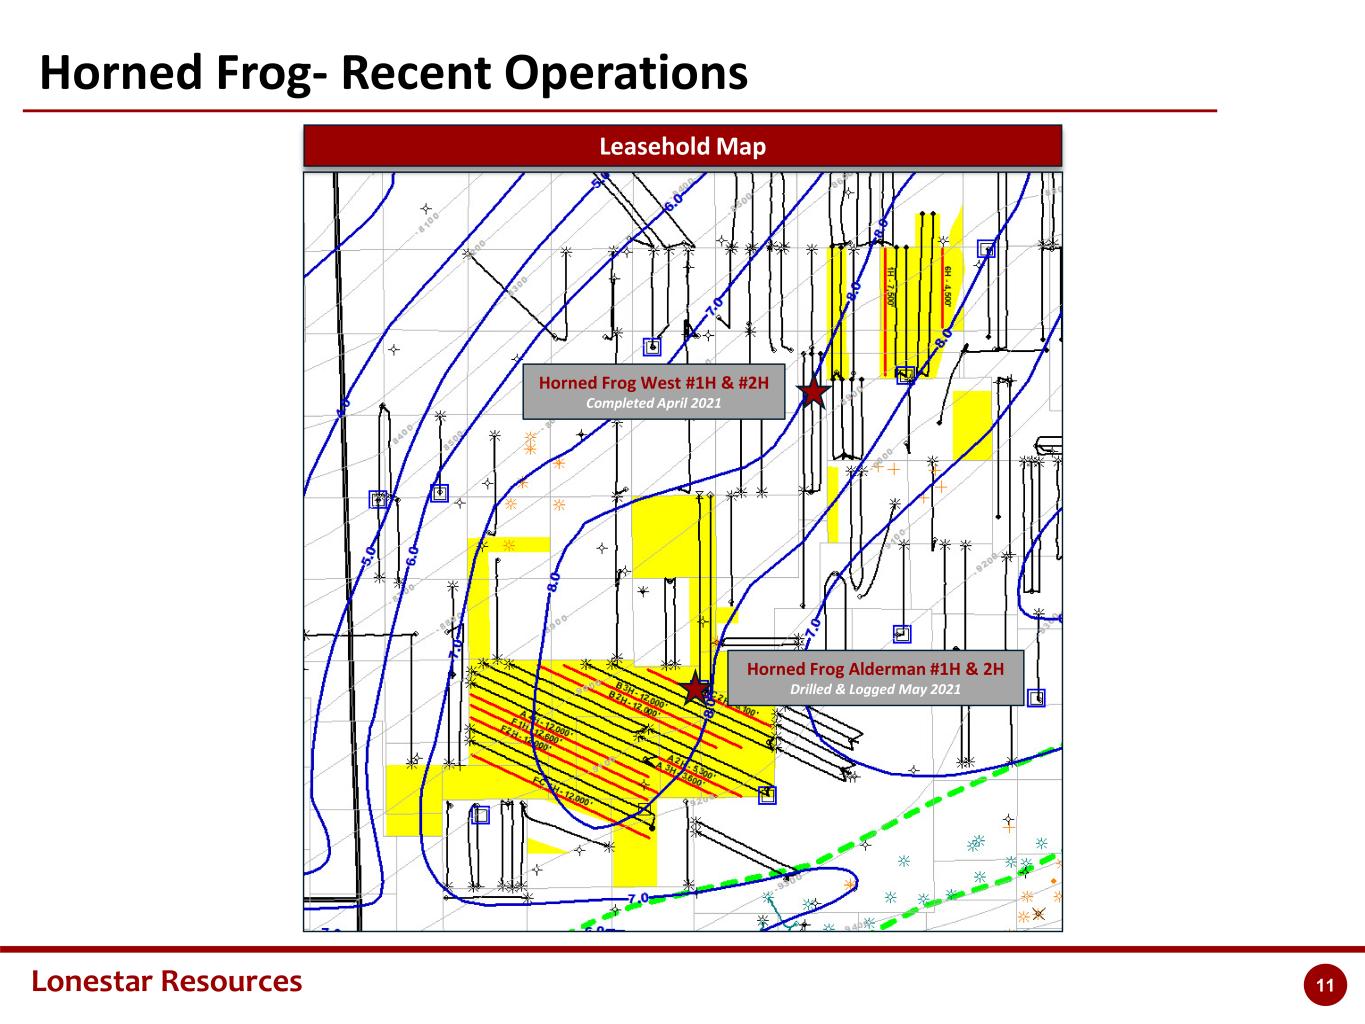
Lonestar Resources 11 Horned Frog- Recent Operations Leasehold Map Horned Frog Alderman #1H & 2H Drilled & Logged May 2021 Horned Frog West #1H & #2H Completed April 2021
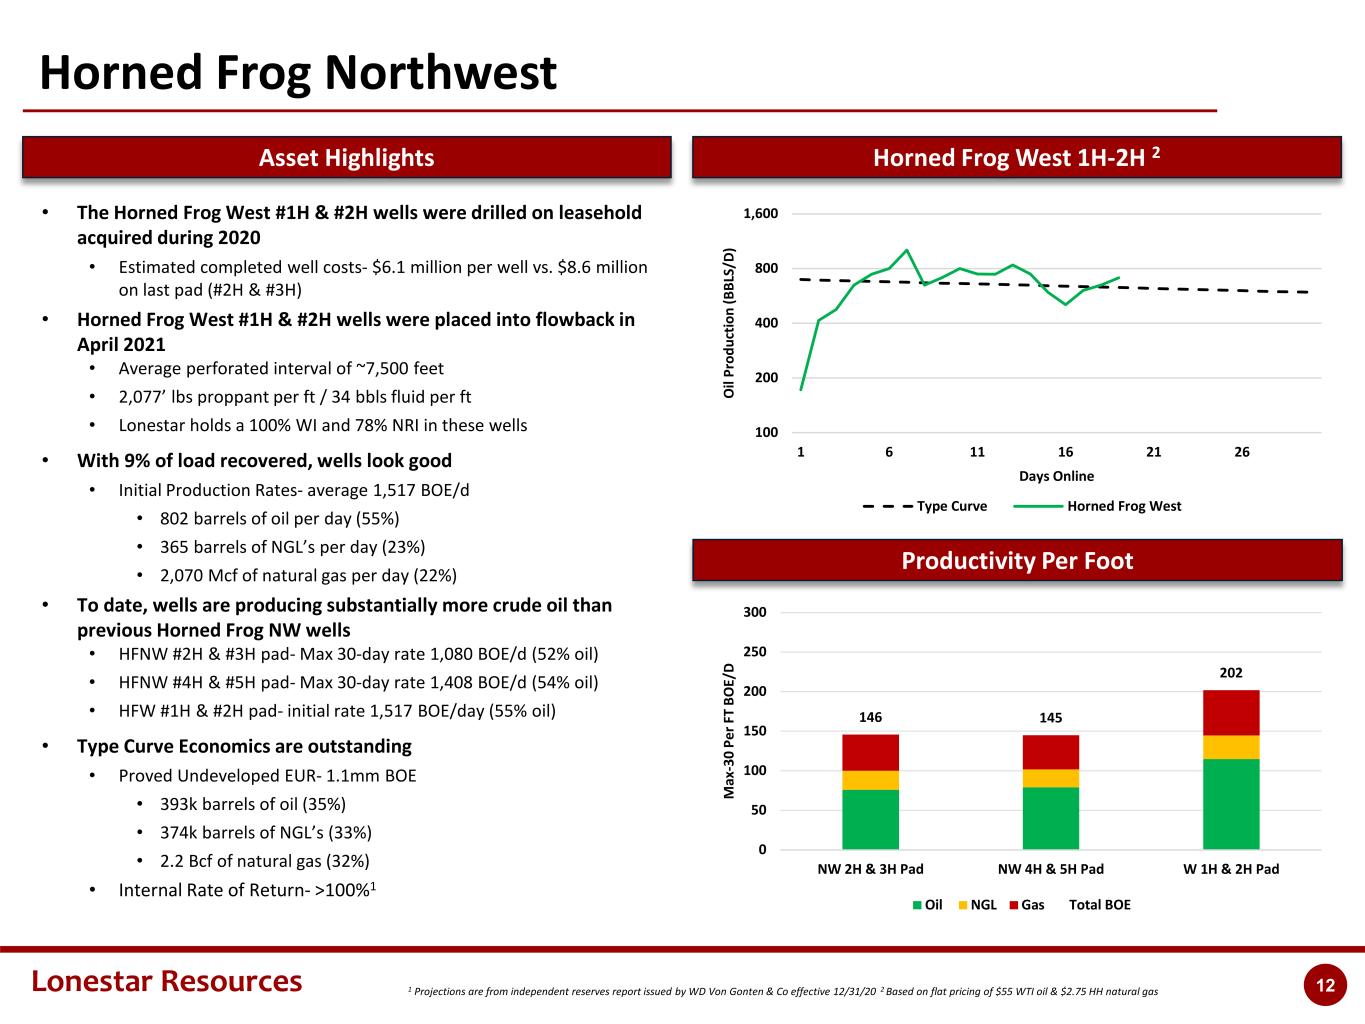
Lonestar Resources 12 146 145 202 0 50 100 150 200 250 300 NW 2H & 3H Pad NW 4H & 5H Pad W 1H & 2H Pad M ax -3 0 Pe r F T BO E/ D Oil NGL Gas Total BOE Horned Frog Northwest Asset Highlights Horned Frog West 1H-2H 2 100 200 400 800 1,600 1 6 11 16 21 26 O il Pr od uc ti on (B BL S/ D ) Days Online Type Curve Horned Frog West • The Horned Frog West #1H & #2H wells were drilled on leasehold acquired during 2020 • Estimated completed well costs- $6.1 million per well vs. $8.6 million on last pad (#2H & #3H) • Horned Frog West #1H & #2H wells were placed into flowback in April 2021 • Average perforated interval of ~7,500 feet • 2,077’ lbs proppant per ft / 34 bbls fluid per ft • Lonestar holds a 100% WI and 78% NRI in these wells • With 9% of load recovered, wells look good • Initial Production Rates- average 1,517 BOE/d • 802 barrels of oil per day (55%) • 365 barrels of NGL’s per day (23%) • 2,070 Mcf of natural gas per day (22%) • To date, wells are producing substantially more crude oil than previous Horned Frog NW wells • HFNW #2H & #3H pad- Max 30-day rate 1,080 BOE/d (52% oil) • HFNW #4H & #5H pad- Max 30-day rate 1,408 BOE/d (54% oil) • HFW #1H & #2H pad- initial rate 1,517 BOE/day (55% oil) • Type Curve Economics are outstanding • Proved Undeveloped EUR- 1.1mm BOE • 393k barrels of oil (35%) • 374k barrels of NGL’s (33%) • 2.2 Bcf of natural gas (32%) • Internal Rate of Return- >100%1 Productivity Per Foot 1 Projections are from independent reserves report issued by WD Von Gonten & Co effective 12/31/20 2 Based on flat pricing of $55 WTI oil & $2.75 HH natural gas
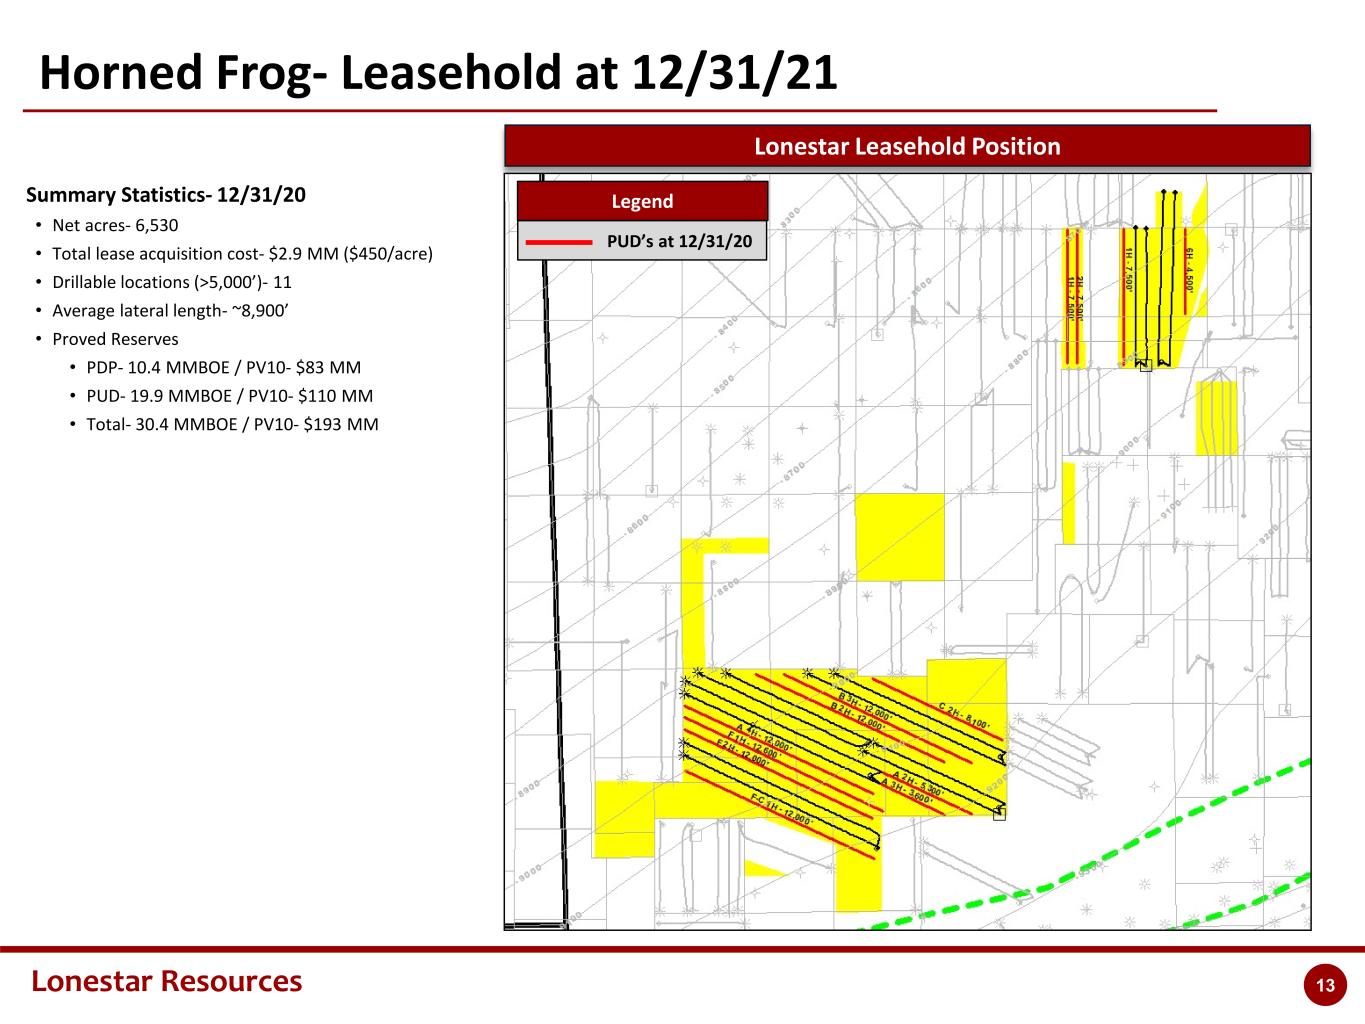
Lonestar Resources 13 Horned Frog- Leasehold at 12/31/21 Lonestar Leasehold Position Summary Statistics- 12/31/20 • Net acres- 6,530 • Total lease acquisition cost- $2.9 MM ($450/acre) • Drillable locations (>5,000’)- 11 • Average lateral length- ~8,900’ • Proved Reserves • PDP- 10.4 MMBOE / PV10- $83 MM • PUD- 19.9 MMBOE / PV10- $110 MM • Total- 30.4 MMBOE / PV10- $193 MM PUD’s at 12/31/20 Legend
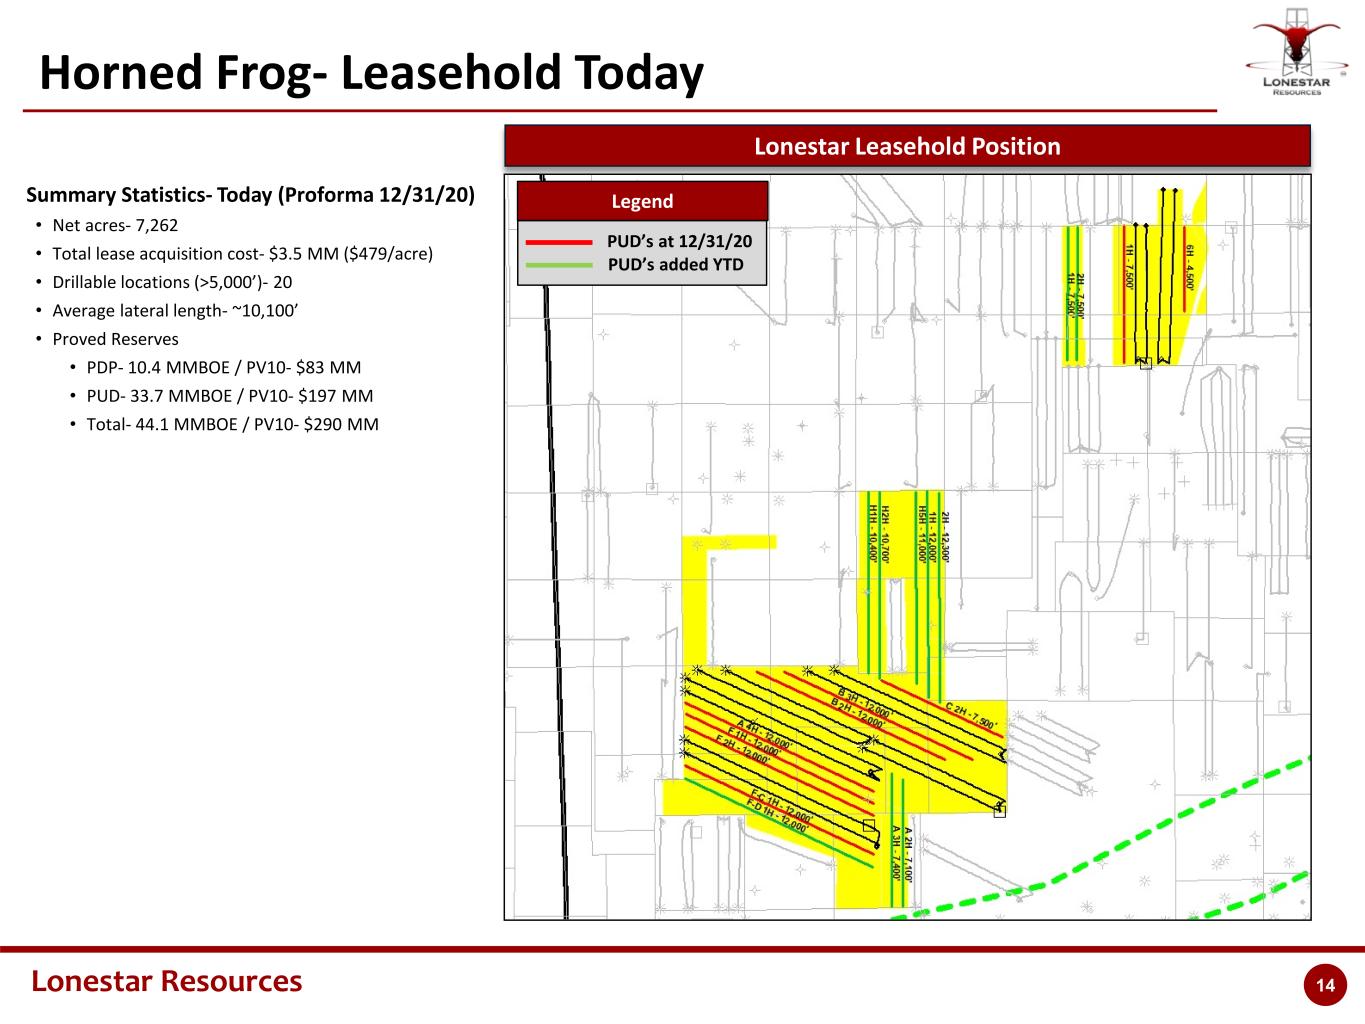
Lonestar Resources 14 Horned Frog- Leasehold Today Lonestar Leasehold Position Summary Statistics- Today (Proforma 12/31/20) • Net acres- 7,262 • Total lease acquisition cost- $3.5 MM ($479/acre) • Drillable locations (>5,000’)- 20 • Average lateral length- ~10,100’ • Proved Reserves • PDP- 10.4 MMBOE / PV10- $83 MM • PUD- 33.7 MMBOE / PV10- $197 MM • Total- 44.1 MMBOE / PV10- $290 MM PUD’s at 12/31/20 PUD’s added YTD Legend
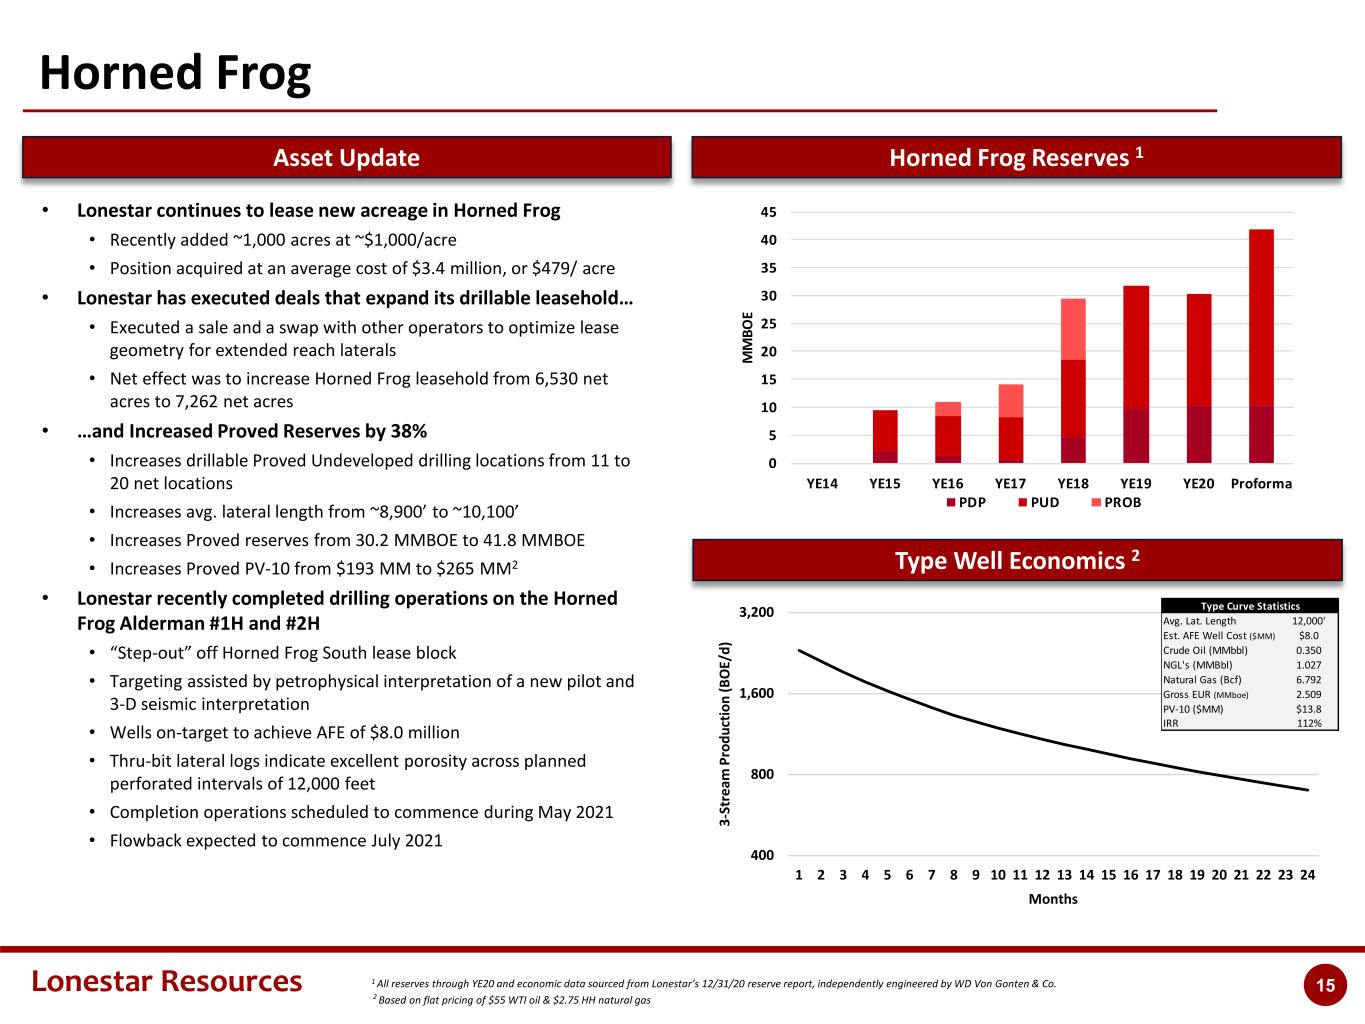
Lonestar Resources 15 400 800 1,600 3,200 1 2 3 4 5 6 7 8 9 10 11 12 13 14 15 16 17 18 19 20 21 22 23 24 3- St re am P ro du ct io n (B O E/ d) Months Horned Frog • Lonestar continues to lease new acreage in Horned Frog • Recently added ~1,000 acres at ~$1,000/acre • Position acquired at an average cost of $3.4 million, or $479/ acre • Lonestar has executed deals that expand its drillable leasehold… • Executed a sale and a swap with other operators to optimize lease geometry for extended reach laterals • Net effect was to increase Horned Frog leasehold from 6,530 net acres to 7,262 net acres • …and Increased Proved Reserves by 38% • Increases drillable Proved Undeveloped drilling locations from 11 to 20 net locations • Increases avg. lateral length from ~8,900’ to ~10,100’ • Increases Proved reserves from 30.2 MMBOE to 41.8 MMBOE • Increases Proved PV-10 from $193 MM to $265 MM2 • Lonestar recently completed drilling operations on the Horned Frog Alderman #1H and #2H • “Step-out” off Horned Frog South lease block • Targeting assisted by petrophysical interpretation of a new pilot and 3-D seismic interpretation • Wells on-target to achieve AFE of $8.0 million • Thru-bit lateral logs indicate excellent porosity across planned perforated intervals of 12,000 feet • Completion operations scheduled to commence during May 2021 • Flowback expected to commence July 2021 Asset Update Horned Frog Reserves 1 1 All reserves through YE20 and economic data sourced from Lonestar’s 12/31/20 reserve report, independently engineered by WD Von Gonten & Co. 2 Based on flat pricing of $55 WTI oil & $2.75 HH natural gas Type Well Economics 2 12,000' $8.0 0.350 NGL's (MMBbl) 1.027 6.792 2.509 $13.8 112% Gross EUR (MMboe) PV-10 ($MM) IRR Type Curve Statistics Avg. Lat. Length Est. AFE Well Cost ($MM) Crude Oil (MMbbl) Natural Gas (Bcf) I need to update 0 5 10 15 20 25 30 35 40 45 YE14 YE15 YE16 YE17 YE18 YE19 YE20 Proforma M M BO E PDP PUD PROB
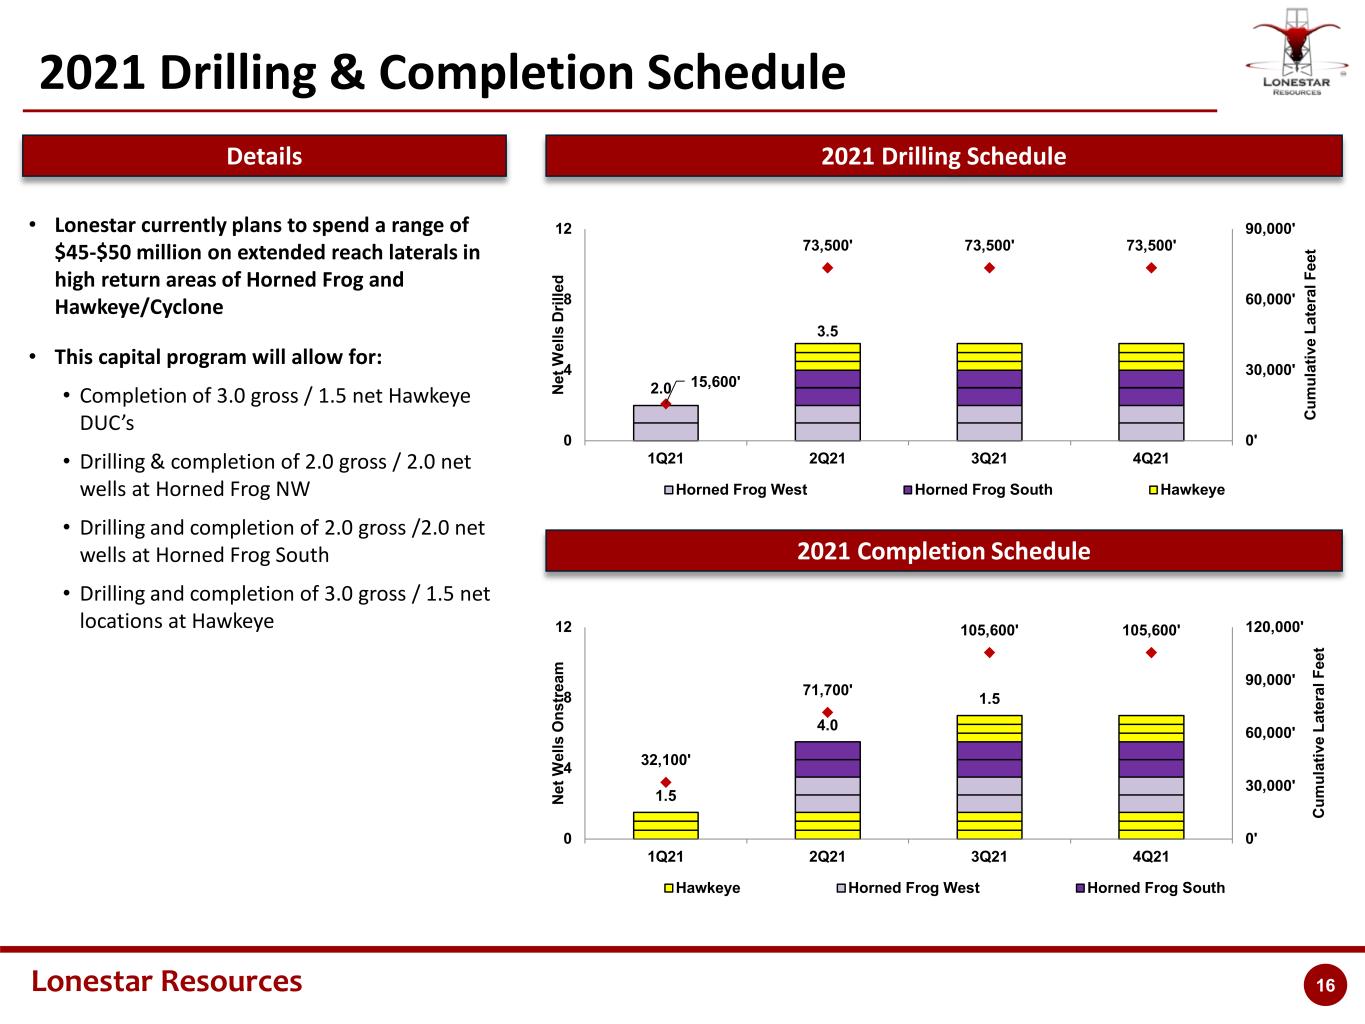
Lonestar Resources 16 1.5 4.0 1.5 32,100' 71,700' 105,600' 105,600' 0' 30,000' 60,000' 90,000' 120,000' 0 4 8 12 1Q21 2Q21 3Q21 4Q21 C um ul at iv e La te ra l F ee t N et W el ls O ns tr ea m Hawkeye Horned Frog West Horned Frog South 2021 Drilling & Completion Schedule 2021 Drilling Schedule 2021 Completion Schedule 2.0 3.5 15,600' 73,500' 73,500' 73,500' 0' 30,000' 60,000' 90,000' 0 4 8 12 1Q21 2Q21 3Q21 4Q21 C um ul at iv e La te ra l F ee t N et W el ls D ri lle d Horned Frog West Horned Frog South Hawkeye • Lonestar currently plans to spend a range of $45-$50 million on extended reach laterals in high return areas of Horned Frog and Hawkeye/Cyclone • This capital program will allow for: • Completion of 3.0 gross / 1.5 net Hawkeye DUC’s • Drilling & completion of 2.0 gross / 2.0 net wells at Horned Frog NW • Drilling and completion of 2.0 gross /2.0 net wells at Horned Frog South • Drilling and completion of 3.0 gross / 1.5 net locations at Hawkeye Details
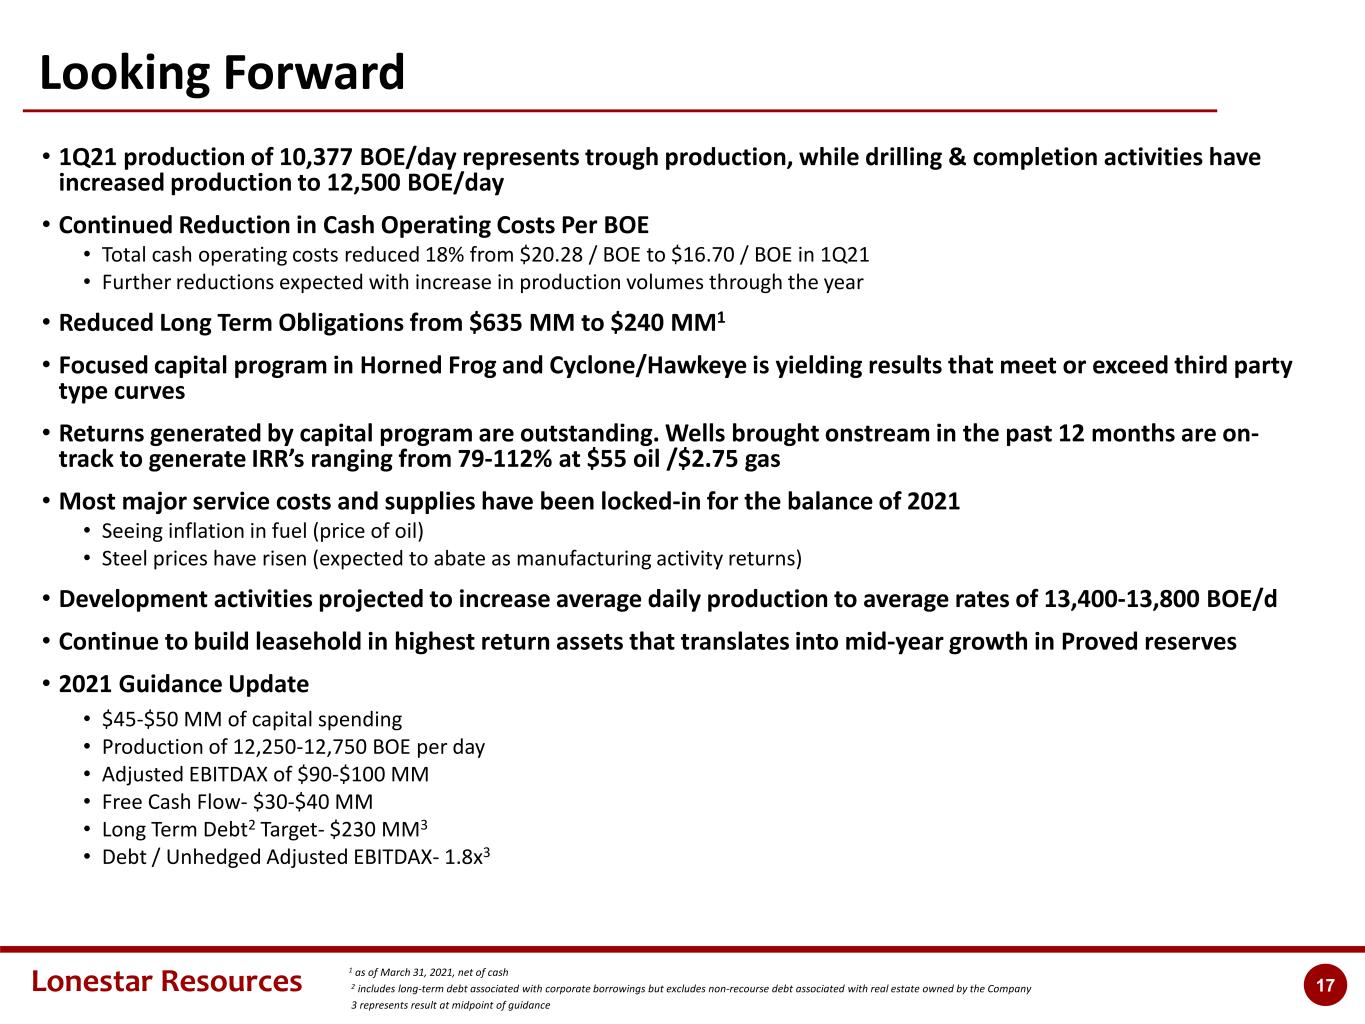
Lonestar Resources 17 Looking Forward • 1Q21 production of 10,377 BOE/day represents trough production, while drilling & completion activities have increased production to 12,500 BOE/day • Continued Reduction in Cash Operating Costs Per BOE • Total cash operating costs reduced 18% from $20.28 / BOE to $16.70 / BOE in 1Q21 • Further reductions expected with increase in production volumes through the year • Reduced Long Term Obligations from $635 MM to $240 MM1 • Focused capital program in Horned Frog and Cyclone/Hawkeye is yielding results that meet or exceed third party type curves • Returns generated by capital program are outstanding. Wells brought onstream in the past 12 months are on- track to generate IRR’s ranging from 79-112% at $55 oil /$2.75 gas • Most major service costs and supplies have been locked-in for the balance of 2021 • Seeing inflation in fuel (price of oil) • Steel prices have risen (expected to abate as manufacturing activity returns) • Development activities projected to increase average daily production to average rates of 13,400-13,800 BOE/d • Continue to build leasehold in highest return assets that translates into mid-year growth in Proved reserves • 2021 Guidance Update • $45-$50 MM of capital spending • Production of 12,250-12,750 BOE per day • Adjusted EBITDAX of $90-$100 MM • Free Cash Flow- $30-$40 MM • Long Term Debt2 Target- $230 MM3 • Debt / Unhedged Adjusted EBITDAX- 1.8x3 1 as of March 31, 2021, net of cash 2 includes long-term debt associated with corporate borrowings but excludes non-recourse debt associated with real estate owned by the Company 3 represents result at midpoint of guidance
Lonestar Resources 18 Appendix
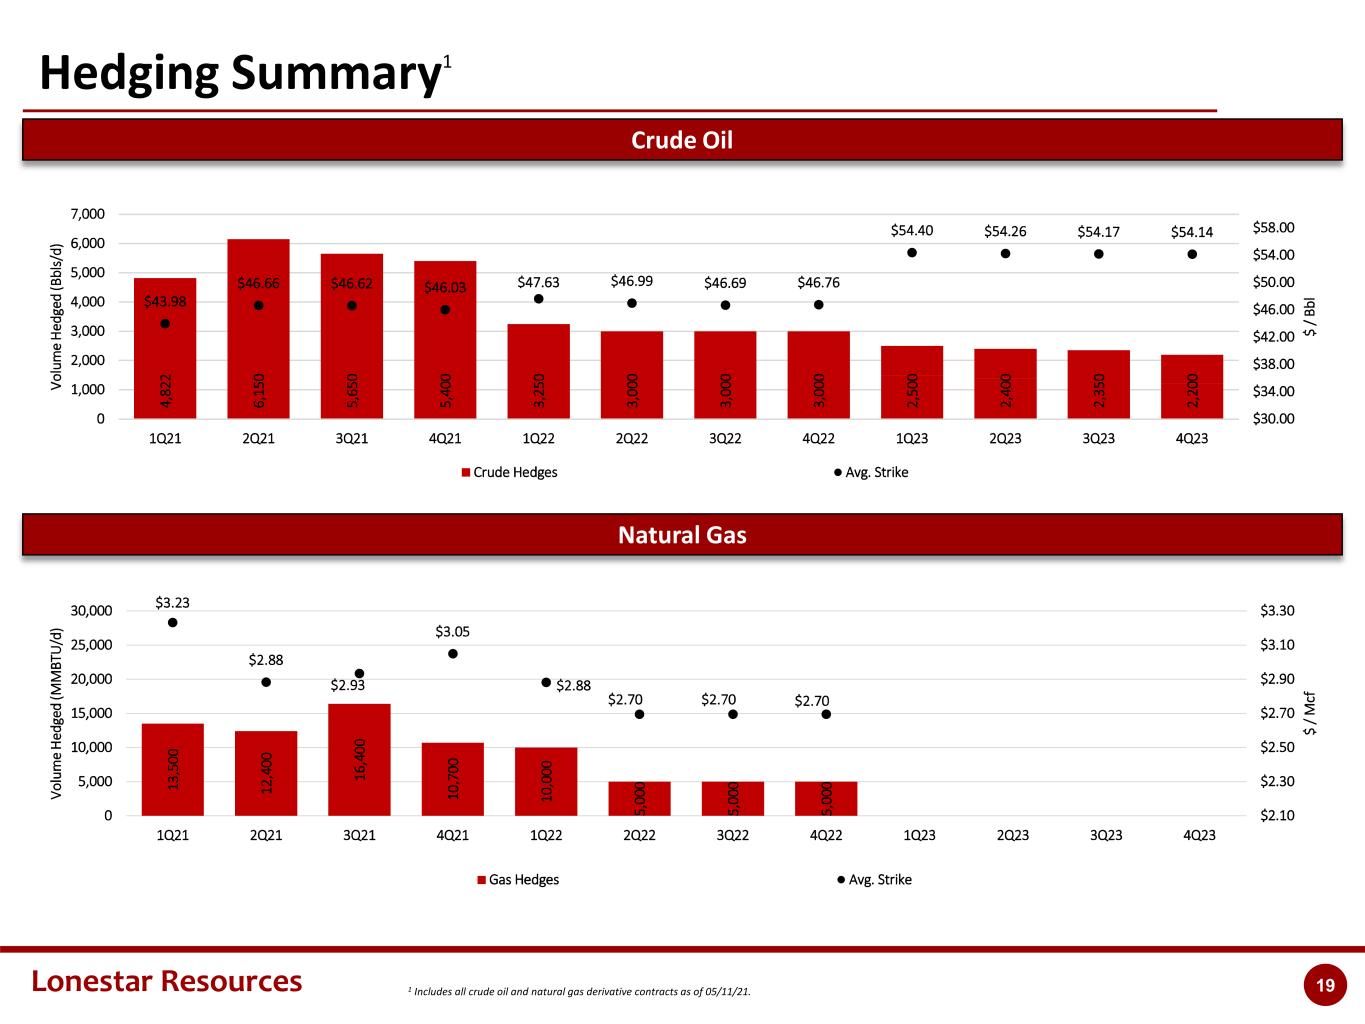
Lonestar Resources 191 Includes all crude oil and natural gas derivative contracts as of 05/11/21. Hedging Summary1 Crude Oil Natural Gas 13 ,5 00 12 ,4 00 16 ,4 00 10 ,7 00 10 ,0 00 5, 00 0 5, 00 0 5, 00 0 $3.23 $2.88 $2.93 $3.05 $2.88 $2.70 $2.70 $2.70 $2.10 $2.30 $2.50 $2.70 $2.90 $3.10 $3.30 0 5,000 10,000 15,000 20,000 25,000 30,000 1Q21 2Q21 3Q21 4Q21 1Q22 2Q22 3Q22 4Q22 1Q23 2Q23 3Q23 4Q23 $ / M cf V ol um e H ed ge d (M M BT U /d ) Gas Hedges Avg. Strike 4, 82 2 6, 15 0 5, 65 0 5, 40 0 3, 25 0 3, 00 0 3, 00 0 3, 00 0 2, 50 0 2, 40 0 2, 35 0 2, 20 0 $43.98 $46.66 $46.62 $46.03 $47.63 $46.99 $46.69 $46.76 $54.40 $54.26 $54.17 $54.14 $30.00 $34.00 $38.00 $42.00 $46.00 $50.00 $54.00 $58.00 0 1,000 2,000 3,000 4,000 5,000 6,000 7,000 1Q21 2Q21 3Q21 4Q21 1Q22 2Q22 3Q22 4Q22 1Q23 2Q23 3Q23 4Q23 $ / Bb l V ol um e H ed ge d (B bl s/ d) Crude Hedges Avg. Strike
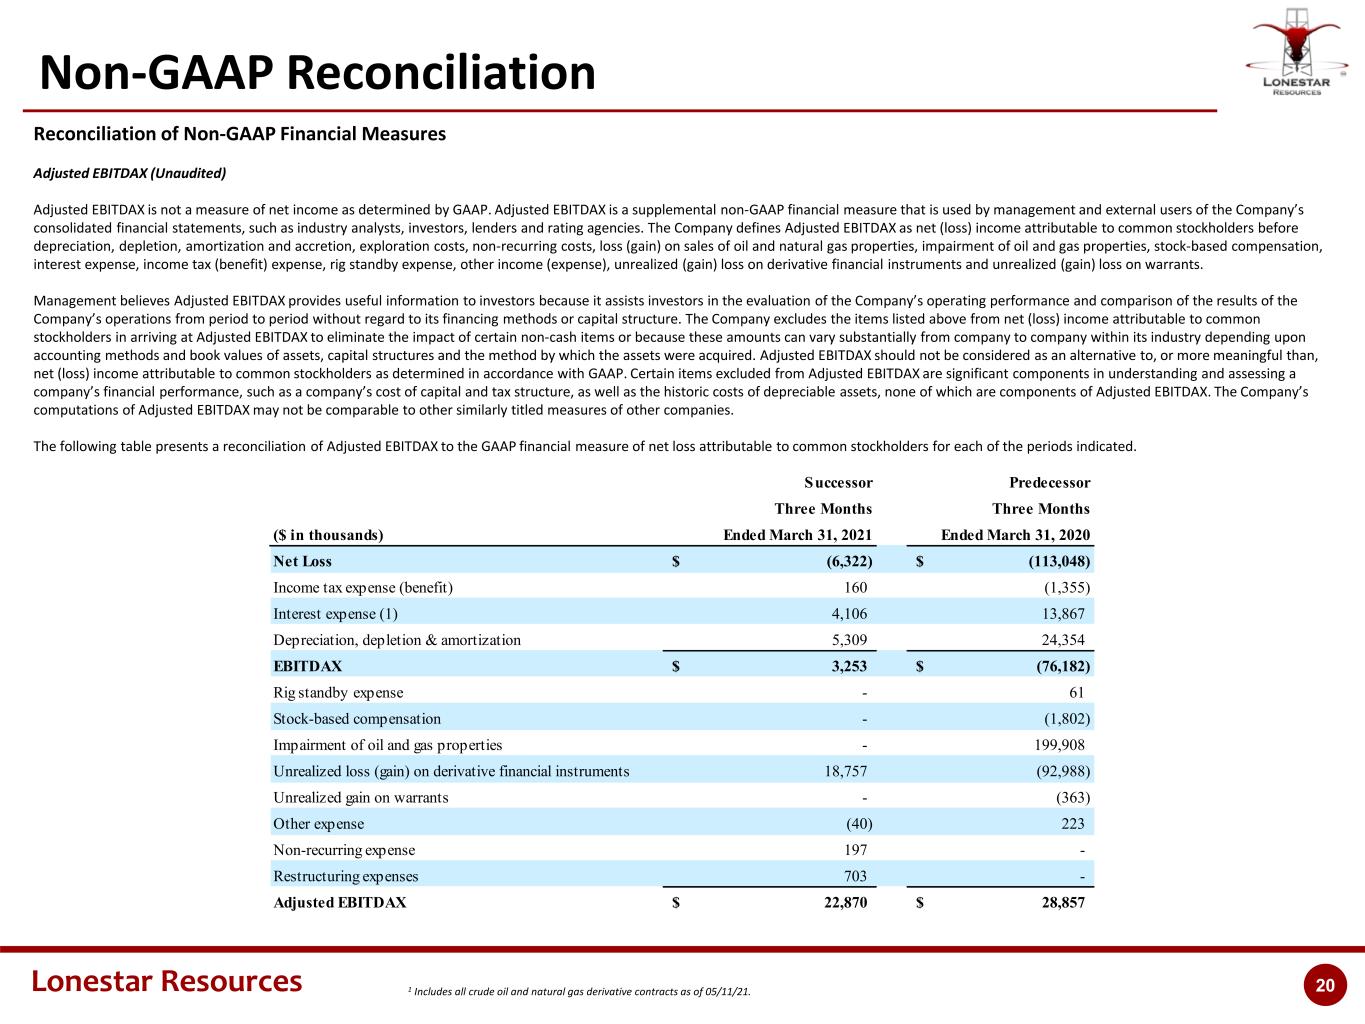
Lonestar Resources 201 Includes all crude oil and natural gas derivative contracts as of 05/11/21. Non-GAAP Reconciliation Reconciliation of Non-GAAP Financial Measures Adjusted EBITDAX (Unaudited) Adjusted EBITDAX is not a measure of net income as determined by GAAP. Adjusted EBITDAX is a supplemental non-GAAP financial measure that is used by management and external users of the Company’s consolidated financial statements, such as industry analysts, investors, lenders and rating agencies. The Company defines Adjusted EBITDAX as net (loss) income attributable to common stockholders before depreciation, depletion, amortization and accretion, exploration costs, non-recurring costs, loss (gain) on sales of oil and natural gas properties, impairment of oil and gas properties, stock-based compensation, interest expense, income tax (benefit) expense, rig standby expense, other income (expense), unrealized (gain) loss on derivative financial instruments and unrealized (gain) loss on warrants. Management believes Adjusted EBITDAX provides useful information to investors because it assists investors in the evaluation of the Company’s operating performance and comparison of the results of the Company’s operations from period to period without regard to its financing methods or capital structure. The Company excludes the items listed above from net (loss) income attributable to common stockholders in arriving at Adjusted EBITDAX to eliminate the impact of certain non-cash items or because these amounts can vary substantially from company to company within its industry depending upon accounting methods and book values of assets, capital structures and the method by which the assets were acquired. Adjusted EBITDAX should not be considered as an alternative to, or more meaningful than, net (loss) income attributable to common stockholders as determined in accordance with GAAP. Certain items excluded from Adjusted EBITDAX are significant components in understanding and assessing a company’s financial performance, such as a company’s cost of capital and tax structure, as well as the historic costs of depreciable assets, none of which are components of Adjusted EBITDAX. The Company’s computations of Adjusted EBITDAX may not be comparable to other similarly titled measures of other companies. The following table presents a reconciliation of Adjusted EBITDAX to the GAAP financial measure of net loss attributable to common stockholders for each of the periods indicated. Successor Predecessor Three Months Three Months ($ in thousands) Ended March 31, 2021 Ended March 31, 2020 Net Loss (6,322)$ (113,048)$ Income tax expense (benefit) 160 (1,355) Interest expense (1) 4,106 13,867 Depreciation, depletion & amortization 5,309 24,354 EBITDAX 3,253$ (76,182)$ Rig standby expense - 61 Stock-based compensation - (1,802) Impairment of oil and gas properties - 199,908 Unrealized loss (gain) on derivative financial instruments 18,757 (92,988) Unrealized gain on warrants - (363) Other expense (40) 223 Non-recurring expense 197 - Restructuring expenses 703 - Adjusted EBITDAX 22,870$ 28,857$
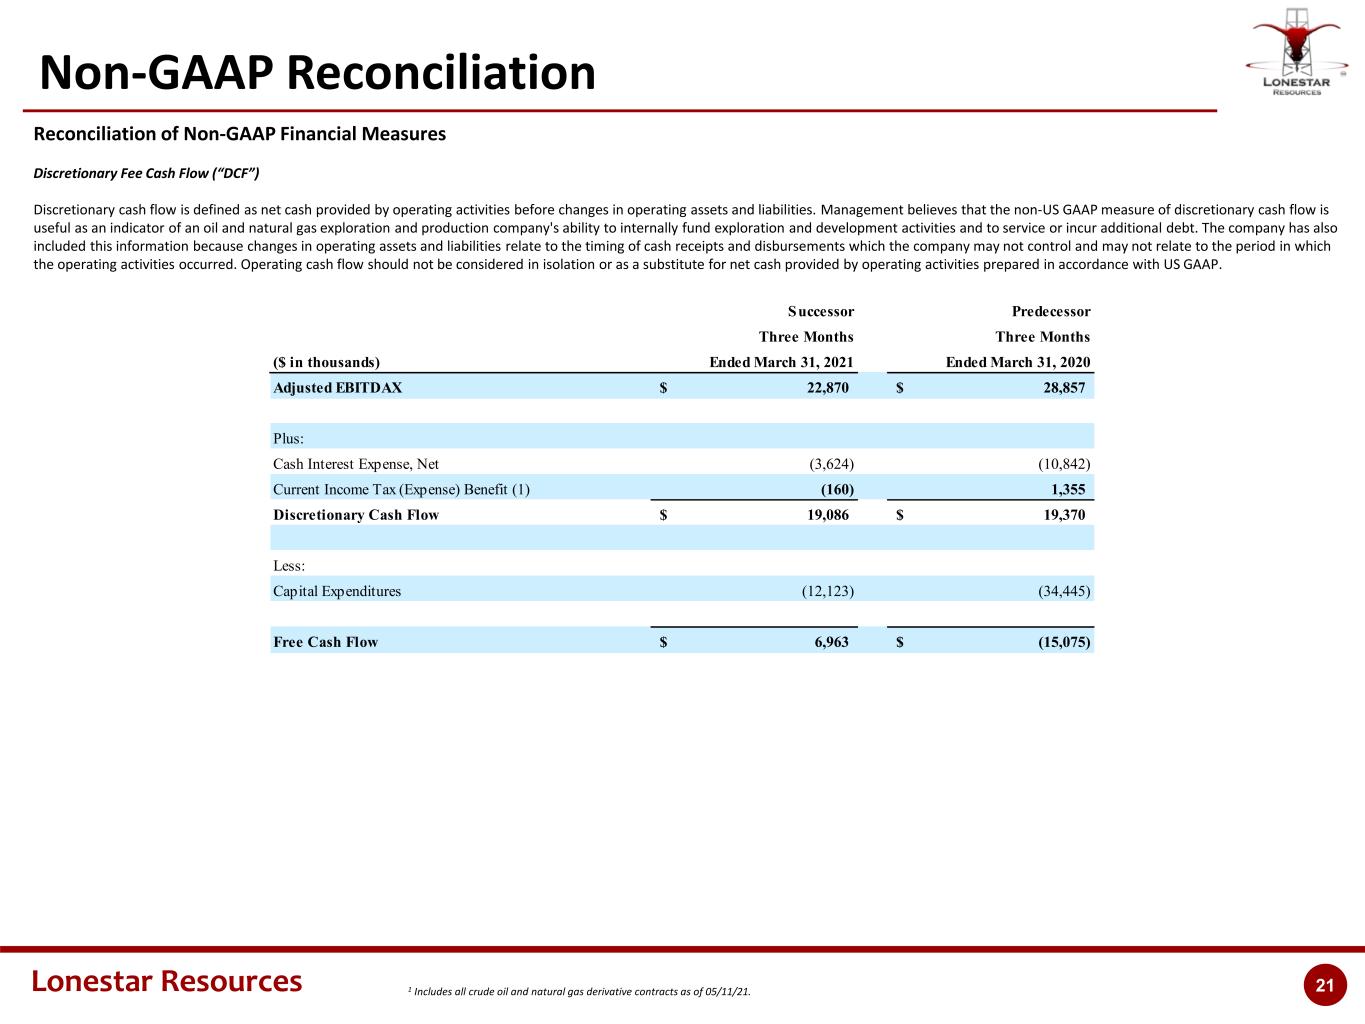
Lonestar Resources 211 Includes all crude oil and natural gas derivative contracts as of 05/11/21. Non-GAAP Reconciliation Reconciliation of Non-GAAP Financial Measures Discretionary Fee Cash Flow (“DCF”) Discretionary cash flow is defined as net cash provided by operating activities before changes in operating assets and liabilities. Management believes that the non-US GAAP measure of discretionary cash flow is useful as an indicator of an oil and natural gas exploration and production company's ability to internally fund exploration and development activities and to service or incur additional debt. The company has also included this information because changes in operating assets and liabilities relate to the timing of cash receipts and disbursements which the company may not control and may not relate to the period in which the operating activities occurred. Operating cash flow should not be considered in isolation or as a substitute for net cash provided by operating activities prepared in accordance with US GAAP. Successor Predecessor Three Months Three Months ($ in thousands) Ended March 31, 2021 Ended March 31, 2020 Adjusted EBITDAX 22,870$ 28,857$ Plus: Cash Interest Expense, Net (3,624) (10,842) Current Income Tax (Expense) Benefit (1) (160) 1,355 Discretionary Cash Flow 19,086$ 19,370$ Less: Capital Expenditures (12,123) (34,445) Free Cash Flow 6,963$ (15,075)$
