Attached files
| file | filename |
|---|---|
| 8-K - FORM 8-K - FIRST UNITED CORP/MD/ | tm2116119d1_8k.htm |
Exhibit 99.1

Investor Presentation First Quarter 2021 Dated May 12, 2021

2 2 Forward looking statements This presentation contains forward - looking statements as defined by the Private Securities Litigation Reform Act of 1995. Forward - looking statements do not represent historical facts, but are statements about management's beliefs, plans and objectives about the future, as well as its assumptions and judgments concerning such beliefs, plans and objectives. These statements are evidenced by terms such as "anticipate," "estimate," "should," "expect," "believe," "intend," and similar expressions. Although these statements reflect management's good faith beliefs and projections, they are not guarantees of future performance and they may not prove true. The beliefs, plans and objectives on which forward - looking statements are based involve risks and uncertainties that could cause actual results to differ materially from those addressed in the forward - looking statements. For a discussion of these risks and uncertainties, see the section of the periodic reports that First United Corporation files with the Securities and Exchange Commission entitled "Risk Factors", including the risk factor set forth in First United Corporation’s Annual Report on Form 10 - K, as amended, for the year ended December 31, 2020 entitled, “The outbreak of the recent coronavirus (“COVID - 19”), or an outbreak of another highly infectious or contagious disease, could adversely affect First United Corporation’s business, financial condition and results of operations.” and any updates thereto that might be contained in subsequent reports filed by First United Corporation. The risks and uncertainties associated with the COVID - 19 pandemic and its impact on First United Corporation will depend on, among other things, the length of time that the pandemic continues; the potential imposition of further restrictions on travel in the future; the effect of the pandemic on the global, national, and local economies and on the businesses of our borrowers and their ability to make payments on their obligations; the remedial actions and stimulus measures adopted by federal, state, and local governments; and the inability of employees to work due to illness, quarantine, or government mandates. Whether actual results will conform to expectations and predictions is subject to known and unknown risks and uncertainties. Actual results could be materially different from management’s expectations. This presentation should be read in conjunction with our Annual Report on Form 10 - K, as amended, for the year ended December 31, 2020, including the sections of the report entitled “Risk Factors”, as well as the reports and other documents that we subsequently file with the Securities and Exchange Commission (“SEC”), which are available on the SEC’s website at www.sec.gov or at our website at www.mybank.com . Except as required by law, we do not intend to publish updates or revisions of any forward - looking statements we make to reflect new information, future events or otherwise.

3 3 Table of Contents I. First United Pg. 4 II. COVID - 19 Response Pg. 10 III. Operating and Financial Performance Pg. 15 IV. Our Commitment To Strong Governance Pg. 31 V. Appendix Pg. 34

4 4 I. First United

5 5 Executive Summary First United has proactively responded to COVID - 19 and is now re - imagining the future Execution of our strategy is producing steady profitable growth Our Board is continuing to strengthen its governance profile – The health and well - being of our associates and clients guided the implementation and execution of our pandemic policies and procedures – Flexible work schedules, work - at - home accommodations and enhanced communication are key to maintaining culture of the Company during an unprecedented pandemic and in the “new - normal” environment – Supporting the recovery of the communities we serve is paramount to the financial strength of our Company as we participate in PPP, provide loan modifications, and charity/non - profit support – Applying the best practices implemented during the pandemic environment to improve how we will more efficiently execute our business model in a post - pandemic world – Ongoing board refreshment, including formal adoption of diversity and inclusion policies – Proposals on Shareholders’ Meeting Agenda in May 2021, with full Board support Board declassification Majority vote standard Proxy access – Enhanced shareholder engagement and communication – In 1Q21 we grew earnings per share compared to 1Q20 by 96% (GAAP) and increased our dividend by 15% – Pre - provision net revenue (*) for 1Q21, adjusted for settlement expense, increased 61% compared to 1Q20 – Capital, liquidity and asset quality remain strong – Heightened risk management and fraud monitoring in light of current economic environment (*) See Appendix for a reconciliation of this non - GAAP financial measure

6 6 Mission Statement To enrich the lives of our customers, our employees and our shareholders through uncommon commitment to service and effective financial solutions Company Overview Founded: 1900 Headquarters: Oakland, Maryland Locations: 25 branches + 1 Advisory Center Business Lines: Commercial & Retail Banking, Trust Services, Wealth Management Ticker: FUNC (Nasdaq) Website: www.mybank.com Financial Highlights (as of or for the 3 months ended March 31, 2021) Assets: $1.78 billion Loans: $1.20 billion Deposits: $1.47 billion AUM: $1.38 billion Efficiency Ratio (*): 56.1 % TCE Ratio (*): 6.67% Dividends Declared Per Share : $0.15 Tangible Book Value Per Share (*): $16.89 Diluted EPS - GAAP: $0.49 Diluted EPS - non - GAAP (*): $0.86 NIM: 3.11% NPAs/Total Assets: 1.07% NCOs/Avg. Loans: 0.0% West Virginia Maryland Star denotes Oakland, Maryland Headquarters Franchise Overview (*) See Appendix for a reconciliation of these non - GAAP financial measures

7 7 Q1 2021 Highlights Highlights • Increased pre - provision net revenue (1) to $7.9 million in 1Q21 from $6.3 million in 4Q20 and $4.9 million in 1Q20 • Fee income of $2.5 million driven by strong wealth management revenue as assets under management were $1.4 billion at March 31, 2021 due to expansion of existing relationships, addition of new client relationships and favorable market returns • Paycheck Protection Program (“PPP”) 2020 production of $148.9 million in 2020, with $77 million forgiven by end of April 2021; YTD April 2021 production of $65 million • Mortgage production totaled $27.5 million in 1Q21 compared to $42.8 million in 4Q20 and $23.5 million in the 1Q20, primarily in loans sold to the secondary market, leading to strong net gains of $0.6 million for 1Q21 • Allowance for Loan Losses to gross loans 1.38% including PPP loans; 1.57% excluding PPP loans. No release of provision in 2020 or 1Q21. Asset quality remained strong, with low delinquency and most loans returning to full principal and interest payments • Net interest margin reduced due to PPP loans and high cash balances • Opened a new Advisory Center in Cheat Lake, Monongalia County, WV *1Q21 annualized $6.0 million Adj. Net Income (1) $0.86 Adj. Diluted EPS (1) 1.36%* ROAA (1) 19.89%* ROATCE (1) 3.11% NIM Key Facts (1) See Appendix for a reconciliation of these non - GAAP financial measures
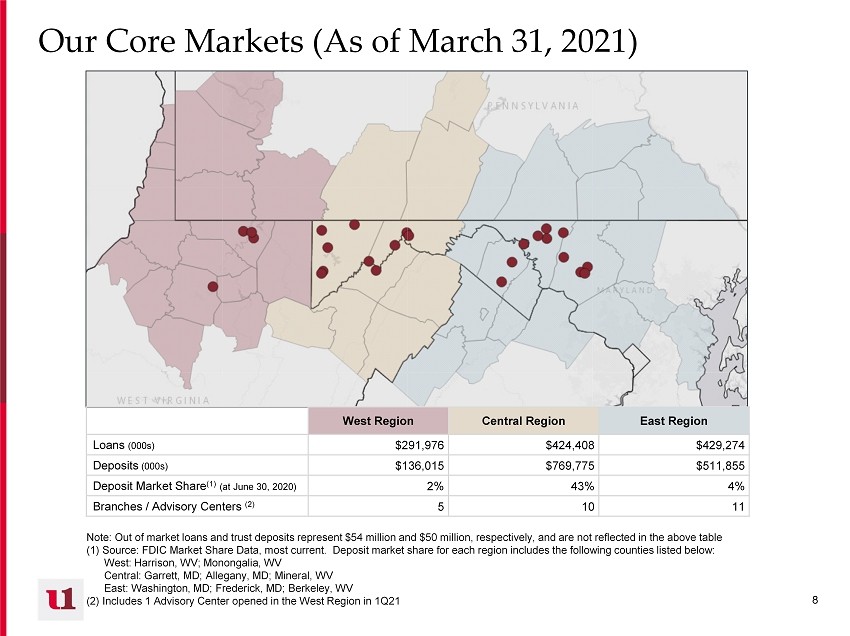
8 8 Our Core Markets (As of March 31, 2021) Note: Out of market loans and trust deposits represent $54 million and $50 million, respectively, and are not reflected in th e a bove table (1) Source: FDIC Market Share Data, most current. Deposit market share for each region includes the following counties liste d b elow: West: Harrison, WV; Monongalia, WV Central: Garrett, MD; Allegany, MD; Mineral, WV East: Washington, MD; Frederick, MD; Berkeley, WV (2) Includes 1 Advisory Center opened in the West Region in 1Q21 West Region Central Region East Region Loans (000s) $291,976 $424,408 $429,274 Deposits (000s) $136,015 $769,775 $511,855 Deposit Market Share (1) (at June 30, 2020) 2% 43% 4% Branches / Advisory Centers (2) 5 10 11

9 9 Our Core Strengths Engaged and Diverse Board & Management • Our diverse and experienced Board challenges management and has been conducting a robust refreshment plan, which has been in place since 2014 Core Deposit Franchise Diversified Revenue Stream Forward - Thinking Approach Robust Enterprise Risk Management Passionate Associates • Reflects stable legacy markets, produces steady low - cost funding • Growing via utilization of technology and deepening of business relationships • Diversified revenue stream driven by trust and brokerage fee income provides protection during times of low interest rates • Innovative and dynamic approach to attracting and retaining clients, leading to future growth and efficiencies • Enhanced underwriting guidelines and risk management framework • Focus on risk mitigation and managing loan concentrations • Passionate and engaged associates committed to helping clients and the communities we serve Prepared for the Impacts of COVID - 19 • Robust infrastructure for business continuity and remote work • Helping protect local businesses and jobs (Paycheck Protection Program & loan modifications)
10 10 II. COVID - 19 Response

11 11 COVID - 19 Response for Stakeholders • Quickly responded to COVID - 19 through our well - designed and tested Business Continuity Plan, focusing on the health, safety, and financial well - being of our associates and clients • Proactive communication and outreach with shareholders , clients and associates regarding enhanced measures and procedures • Assisted our associates through work - at - home accommodations, pandemic pay policies, Financial First Responder bonuses, and flexible schedules • Excellent delivery for new and existing clients on the Paycheck Protection Program origination and forgiveness, funding over $148 million in 2020, of which $77 million were forgiven through April 24, 2021, and an additional $65 million in 2021 funded through April 24, 2021 • Provided Covid - 19 loan modifications for 643 loans totaling $260.4 million for our business and consumer clients in 2020, active modifications remaining for 12 loans totaling $5.7 million • Utilized recent branch enhancements to deliver updated technology to our clients and to properly social distance clients and associates • Relieved financial pressures for clients through various measures, including loan modifications, waiving early withdrawal penalties and overdraft fees, and temporarily suspending repossession and foreclosure activity • Supported our communities through continued support of non - profit groups and special banking accommodations

12 12 Active Commercial COVID - 19 Modifications For Commercial COVID - 19 modifications updated actual and proforma Financial Statements are required at the initial deferral and after the second; evaluated interest only vs. P&I deferral, strength of guarantor, collateral coverage Risk rating impact of COVID - 19 Modifications: Up to 6 months deferral – no change; COVID - 19 third request – downgrade to Special Mention; COVID - 19 fourth request – downgrade to Sub - Standard Status: Credit: Count Balance 3.31 (000) Average # of Months Modified Pass 3 388 3 COVID-19-First Deferral 3 388 3 Deferred P or I 2 358 3 RE/Rental/Leasing - Multifamily 1 298 3 RE/Rental/Leasing - All Other 1 60 2 Deferred P & I 1 30 3 Construction - All Other 1 30 3 Sub-standard 2 4,575 15 COVID-19-Fourth Deferral 2 4,575 15 Deferred P & I 2 4,575 15 Accommodations 2 4,575 15 Grand Total 5 4,963 8 Count Balance 3.31 (000) Wtd DSC Wtd LTV CRE 3 4,873 1.13 65.54% Hotel Accommodations 2 4,575 1.13 65.17% Guar: Personal 2 4,575 1.13 65.17% Student Rentals RE/Rental/Leasing - Multifamily 1 298 1.13 71.91% Guar: Personal 1 298 1.13 71.91% C&I 2 90 1.35 NA Unsecured RE/Rental/Leasing - All Other 1 60 2.02 NA Guar: Personal 1 60 2.02 NA Equipment Construction - All Other 1 30 - NA Guar: Personal 1 30 - NA Grand Total 5 4,963 1.14 65.54%

13 13 Status of PPP Loans Originated in 2020 • 1Q21 period - end portfolio balance - $85 million from 2020 originations and $60 million from 2021 originations, 1Q21 average balance of all PPP loans - $142 million • Based on current and projected forgiveness activity, management estimates that $34 million will remain at 2021 year - end from both programs • Total net fees relating to 2020 PPP round (cash received less deferred expenses) of $3.7 million, of which $2.0 million were recognized in 2020 and $1.0 million in 1Q21 • Estimated negative impact on 1Q21 margin of 3 bps • New customers comprised 26% of the number of PPP loans granted in 2020. Actively cultivating new relationships and deepening existing relationships, adding approximately $45 million in new non - PPP loans and $42 million in new non - PPP deposits through March 2021 Count % of Count Amount (000)% of Amount Forgiven 836 71.2% 81,101 54.5% Under $150K 729 62.1% 27,811 18.7% $150K-$2M 105 8.9% 45,677 30.7% >$2M 2 0.2% 7,612 5.1% Forgiveness Review In process 74 6.3% 41,211 27.7% Under $150K 48 4.1% 1,516 1.0% $150K-$2M 18 1.5% 10,401 7.0% >$2M 8 0.7% 29,294 19.7% Forgiveness Not Yet Sought 264 22.5% 26,543 17.8% Under $150K 225 19.2% 8,401 5.6% $150K-$2M 39 3.3% 18,142 12.2% Grand Total 1,174 100.0% 148,855 100.0%

14 14 PPP Loans Originated in 2021 by Size and Count As of April 30, 2021, we have processed an additional 849 requests for $66 million. First time requests represent 34% of the count and 8% of the total amount requested. Total net fees (fees assessed less deferred expenses) of $2.7 million, of which minimal were recognized in 1Q21

15 15 III. Operating and Financial Performance

16 16 Key Initiatives and Strategic Priorities Optimize shareholder return through a keen focus on future growth, profitability, efficiencies, the client experience, and a reimagined future Create Exceptional Client Experience • Provide seamless client experience across all business lines using integrated relationship teams • Educate clients on digital banking and technology utilizing high - tech branch network • Customize financial solutions to grow client relationships and loyalty • Develop focused marketing plans utilizing data analytics to increase relationship and product profitability Grow Strategically • Amplify consumer and small business relationships utilizing community relationship managers and universal relationship advisors • Opportunistically identify and hire banking talent to capitalize on market disruption and client acquisition • Expand into new markets utilizing Financial Center model and mortgage originations • Pursue wealth management M&A and strategic bank partnerships Optimize Profitability and Enhance Efficiency • Fine tune regional/line of business financial goals and incentive plans to achieve improved operating leverage • Utilize profitability metrics to focus and align customer engagement efforts • Capitalize on existing infrastructure to build stronger revenue streams • Implement next stages of operational restructure and consolidation initiative • Leverage technology to streamline processes and procedures Underlying all initiatives is a commitment to strong risk management, monitoring and mitigation Reimagine the Future • Develop hybrid work environment to capture efficiencies and attract/ retain talent • Explore real estate partnerships and physical space alternatives • Further promote diversity, equity and inclusion in workforce and client base • Establish Fintech partnerships to capitalize on digital financial offerings

17 17 Strong Risk Management, Monitoring and Mitigation Underlies all strategic priorities Asset Quality • Low net charge - offs and strong asset quality as a result of conservative and proactive credit culture • Maintaining protective provision of $5.4 million recorded in 2020 related to qualitative factor adjustments due to COVID - 19 uncertainties • Strong reserves - ALL level of 1.57%, excluding PPP loans; future provisioning based on loan growth and asset quality changes • Diversified commercial loan portfolio and geographic footprint • Disciplined loan growth strategy, concentration management, stress testing and exception tracking and monitoring • Well - defined loan approval levels • CECL implementation January 2023 Liquidity Management • Loan to deposit ratio of 82% • Liquidity contingency plan in place • Liquidity stress testing performed quarterly with strong liquidity under various scenarios • Available borrowing capacity of $396.2 million through correspondent lines of credit, FHLB and PPPLF • Strong, stable low - cost core deposit franchise of 79% of total interest - earning assets Capital • Strong capital levels well above regulatory “well - capitalized” definition • Conservative dividend payout policy to improve TCE • Capital stress tests indicate Bank is well positioned to absorb potential losses Cyber - Security and Fraud Monitoring • Board regularly briefed on cyber - security matters • Robust information security training programs for associates and Board • Regular third - party review and testing of information security and compliance processes and cybersecurity controls • No security breaches to - date • Adaptive fraud detection and management

18 18 $14.7 $15.5 $17.8 $23.2 $7.9 2017 2018 2019 2020 1Q21 $1,039 $1,068 $1,142 $1,422 $1,468 2017 2018 2019 2020 Mar-21 $882 $996 $1,039 $1,168 $1,199 2017 2018 2019 2020 Mar-21 $1,054 Our Strategic Plan is Generating Reliable Growth… Pre - tax Pre - Provision Income ($ in millions) (*) Tangible Book Value per Share (*) Total Deposits ($ in millions) Total Net Loans, including PPP ($ in millions) First United is delivering consistent growth, increasing profits and tangible book value / share which should translate into increased long - term shareholder return $13.78 $14.97 $16.17 $17.17 $16.89 2017 2018 2019 2020 Mar-21 +30.4% YoY - .2% vs. 2020 +2.7% vs. 2020 +3.2% vs. 2020 $145 PPP $114 (*) See Appendix for a reconciliation of these non - GAAP financial measures

19 19 4.52% 9.39% 10.44% 10.89% 18.23% 2017 2018 2019 2020 1Q21 * 0.40% 0.81% 0.93% 0.86% 1.36% 2017 2018 2019 2020 1Q21 * …As Well As Solid Profitability • First United has consistently improved return on assets and return on average equity enabling us to fund the dividend and invest in future growth • Conservative provisioning for loan losses, given the uncertain duration of the pandemic and its impact on the economic environment, has resulted in lower returns for the current year • Strategic initiatives underway to enhance growth and lower expenses, allowing us to continue improving profitability Core ROAE (non - GAAP (1) ) Core ROAA (non - GAAP (1) ) Strategic Target 1.0% - 1.25% Strategic Target 10% - 14% * 1Q21 annualized (1) See Appendix for a reconciliation of these non - GAAP financial measures
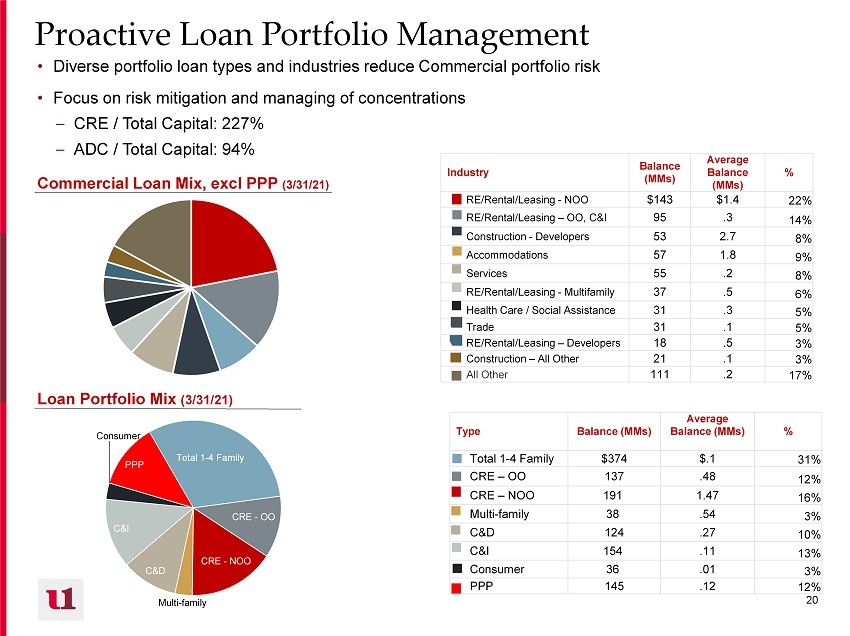
20 20 Total 1 - 4 Family CRE - OO CRE - NOO Multi - family C&D C&I Consumer PPP Proactive Loan Portfolio Management • Diverse portfolio loan types and industries reduce Commercial portfolio risk • Focus on risk mitigation and managing of concentrations – CRE / Total Capital: 227% – ADC / Total Capital: 94% Loan Portfolio Mix (3/31/21) Commercial Loan Mix, excl PPP (3/31/21) Industry Balance (MMs) Average Balance (MMs) % RE/Rental/Leasing - NOO $143 $1.4 22% RE/Rental/Leasing – OO, C&I 95 .3 14% Construction - Developers 53 2.7 8% Accommodations 57 1.8 9% Services 55 .2 8% RE/Rental/Leasing - Multifamily 37 .5 6% Health Care / Social Assistance 31 .3 5% Trade 31 .1 5% RE/Rental/Leasing – Developers 18 .5 3% Construction – All Other 21 .1 3% All Other 111 .2 17% Type Balance (MMs) Average Balance (MMs) % Total 1 - 4 Family $374 $.1 31% CRE – OO 137 .48 12% CRE – NOO 191 1.47 16% Multi - family 38 .54 3% C&D 124 .27 10% C&I 154 .11 13% Consumer 36 .01 3% PPP 145 .12 12%

21 21 Commercial Acquisition and Development Commercial Construction 1 - 4 Family Commercial Construction Amortizing Consumer Lot Loans 1 - 4 Family Residential Construction Construction and Development Portfolio • Geographically diverse construction and development portfolio mitigates risk to portfolio • Construction portfolio has been reduced from 22% of portfolio in 2007 to 10% in March 2021 By Region (3/31/21) Central East West Geography Balance (MMs) Average Balance (MMs) % Central $31 $.11 25% East 52 .40 42% West 41 1.11 33% By Purpose (3/31/21) Purpose Balance (MMs) Average Balance (MMs) % Commercial A&D $57 $1.02 46% Commercial Construction 29 3.58 23% 1 - 4 Family Commercial Construction 6 .48 5% Amortizing Consumer Lot Loans 19 .06 16% 1 - 4 Family Residential Construction 13 .25 10%

22 22 $37 $45 $53 $53 $50 Q1 20 Q2 20 Q3 20 Q4 20 1Q21 Asset Quality NPAs / Total Assets Criticized Loans by Segment Criticized loans (Rolling quarters ended 1Q21, in millions) Nonaccrual Loans / Total Loans 1.37% 0.95% 1.40% 0.35% 0.66% 2017 2018 2019 2020 1Q21 Underwriting and Monitoring • Appraisal policy requires 18 - month updates for impaired or special assets • Proactive, ongoing client engagement and experienced work - out teams • Bi - weekly regional portfolio Quarterly Criticized Asset Reviews • Centralized risk rating, robust external loan review and monitoring of risk rating migration and delinquency trends • Annual third - party loan review • Decreased maximum HE LTV to 80% 1.68% 1.17% 1.30% 0.99% 1.07% 2017 2018 2019 2020 1Q21

23 23 Loan Loss Allowance (“ALL”) Provision Expense (Rolling Quarters ended 1Q21) ALL Trends ALL % by Segment (Rolling Quarters ending 1Q21, excluding PPP loans) 1.12% 1.10% 1.19% 1.41% 1.38% 2017 2018 2019 2020 1Q21 Excluding PPP Loans, which are guaranteed, ALL = 1.57% 0.28% 0.11% - 0.02% 0.13% 0.00% 2017 2018 2019 2020 1Q21 Net Charge - Offs / Average Loans In 2020, due to the unknown impact of the pandemic on credit quality, we increased the provision expense by $4.1 million primarily through qualitative factor adjustments, resulting in an increase in the ALL from 1.19% in 2019 to 1.56% (excluding guaranteed PPP loans) in 2020. In 1Q21, we had no provision release, as we are continuing to monitor the underlying businesses cash flow and financial data as the economy improves.

24 24 Industry Leading Deposit Franchise • The strength of our deposit franchise is driven by both our stable legacy markets and our growing portfolio of commercial deposit accounts • Community office upgrades and forward - thinking technology enhancements have driven an increase in low - cost deposits; 1Q21 cost of deposits of 0.32%. • Noninterest bearing deposits have grown from 8% of portfolio in 2009 to 33% as of March 31, 2021 • 5 - year cumulative deposit beta was 21% through September 2019; 12 - month cumulative deposit beta was 14% through 1Q21 Deposit Composition (3/31/21) Historical Cost of Deposits Deposit Type Balance (MMs) % NIB Demand $485.3 33% IB Demand $207.1 14% MMA & Savings $550.1 38% CDs < $100K $87.1 6% CDs > $100K $138.7 9% Brokered CDs $0.0 0% Core deposits comprise 85% of deposits 0.32% 0.42% 0.70% 0.49% 0.32% 0.43% 0.57% 0.80% 0.53% 0.30% 0.33% 0.47% 0.69% 0.47% 0.26% 2017 2018 2019 2020 1Q21 FUNC ISS Median Proxy Median

25 25 3.37% 3.74% 3.68% 3.34% 3.11% 2017 2018 2019 2020 1Q21 85.8% 94.3% 92.1% 82.1% 81.7% 2017 2018 2019 2020 1Q21 Net Interest Margin • Disciplined loan and deposit pricing has produced a strong margin that is in line with our peers • Margin contraction was primarily due to core loans adjusting down and new loan volume, including PPP, at lower rates due to the current rate environment. • Our strategy for 2021 will be to shift excess cash to the investment portfolio in high quality, short to moderate duration securities • The lower interest income was partially offset by lower cost of funds on the long - term borrowings and interest - bearing deposits • Our team approach to full client relationships, our focus on community - oriented business owners and our high - tech branch network provide continued access to low - cost deposits, treasury management and commercial loans Net Interest Margin (*) Loans / Deposits Current Strategic Target 3.3% - 3.7% Significant influx of deposits due to volatility of economy created excess cash levels Current Strategic Target 87% - 90% (*) See Appendix for a reconciliation of this non - GAAP financial measure

26 26 Diversified Fee Income an Advantage to First United • Federal Reserve actions early in 2020 have led to industry - wide decreases in net interest margin – Fee - based business provides stable growth and a diversified revenue stream not directly tied to interest rates, as well as opportunities to build client relationships • First United’s diverse array of products provides opportunities to fully engage with customers and produce stable increases to earnings – First United’s fee income comprised 30% of operating revenue for 1Q21 Trust and Brokerage Assets Under Management (MMs) Non - Interest Income Mix – 1Q21 75% $1,104 $1,084 $1,212 $1,377 $1,383 2017 2018 2019 2020 Mar-21 Revenue Breakdown Trust and Brokerage 47% Service Charges 12% Net Gain on Loan Sales 11% Debit Card Income 15% Bank - owned Life Insurance 5% Other Noninterest Income 10%

27 27 71.1% 70.2% 68.4% 64.3% 56.1% 2017 2018 2019 2020 Mar-21 Expense Discipline • Significant portion of earnings improvement can be attributed to expense reductions • First United’s investment in its wealth management business line generates additional expenses; even so, efficiency ratio has decreased ~15 points since 2017 and is approaching peer levels • We have identified several initiatives, already underway, to continue lowering expenses and to be more competitive versus our peers • Initiatives implemented as a result of the COVID - 19 environment are expected to provide on - going efficiencies and savings ( Docusign , virtual meetings, digital account openings and loan documentation, etc.) Efficiency Ratio (*) • Successful contract negotiation with core processor resulting in savings of $0.9 million in 2021 and $0.5 million ongoing annually; inclusive of over 30 new products and services • Restructuring and consolidation of regional operating structure • Analyzing real estate partnerships and physical space alternatives • Exploring outsourcing options for operational functions • Reviewing benefits structure and tax - saving strategies • Existing operational infrastructure and technology investments positioned for continued growth Future Identified Efficiencies Underway Strategic Target 58% - 63% (*) See Appendix for a reconciliation of this non - GAAP financial measure

28 28 Prudent Capital Management $13.78 $14.97 $16.17 $17.17 $16.89 2017 2018 2019 2020 Mar-21 Growing Tangible Book – TBV/S 16.24% 14.87% 15.70% FUNC ISS Peer Median Proxy Peer Median Total RBC Ratio Note: ISS and Proxy peer groups are defined in the Appendix to this presentation • Management has consistently grown tangible book value per share (6.5% CAGR) while simultaneously taking decisive action to benefit shareholders • Reintroduction and subsequent increase of dividend has improved shareholders’ return • Proactive share repurchases have supported the Company’s stock price while benefiting tangible book value per share – New repurchase plan of up to 400,000 shares recently became effective in March 2021 – Repurchased 360,737 shares on April 16, 2021 • The Company has all the while maintained regulatory capital ratios above or in - line with peers and significantly above regulatory requirements “Well - capitalized”: 10.00%

29 29 Total Shareholder Return Source: S&P Global Market Intelligence; includes price change and reinvested cash dividends (1) SNL U.S. $1B - $5B Bank Index (2) Peer groups are defined in the Appendix to this presentation. Peer group refers to median unless stated otherwise • Our long - term performance reflects the fundamental operations and earnings growth of our company • The banking industry has been significantly impacted by the current pandemic and its effect on the economy. Our short - term stock price reflects the uncertainties of how this crisis will influence our clients, our local economic environment and our balance sheet • Stock price influenced by market anticipation of exit from Russell 3000 in June 2021 Total Return as of April 30, 2021 1 - Year 3 - Year 5 - Year

30 30 Strategic Targets Post - COVID - 19 Metric Actual 12/31/2019 Actual 12/31/2020 Long Term Strategic Target Range Strong Shareholder Return EPS Growth (YoY) 23% 7% 2% - 15% Dividend Payout Ratio 21.7% 26.3% 20% - 25% ROAA 0.93% 0.86% 1.00% - 1.25% ROAE 10.44% 10.89% 10% - 14% TCE Ratio 8.03% 6.97% 8% - 10% High Quality, Diversified Revenue Stream Revenue Growth (YoY) 6.3% 5.8% 2% - 7% NII / Revenue 26.5% 27.4% 24% - 28% N IM 3.68% 3.34% 3.3% - 3.7% Balance Sheet Growth % Loan Growth 4.4% 11.3% incl PPP 6% - 11% Loans / Assets 73% 67% 71% - 76% Loans / Deposits 92% 82% 87% - 90% Highly Efficient Operations Efficiency Ratio (adjusted for non - core items) 68.4% 64.3% 58% - 63% Positive Operating Leverage Operating Leverage Ratio 3.4% 5.9% 1% - 5% Robust Risk Enterprise Management NPLs / Loans 1.2% 0.35% 0.50% - 1.00% NCOs / Avg. Total Loans (0.02%) 0.13% 0.10% - 0.50%

31 31 IV. Our Commitment to Strong Corporate Governance

32 32 Our Governance Enhancements Board Declassification • In response to feedback from our institutional investors and market views on best - in - class governance practices, First United's Board has proposed this change at the 2021 annual meeting: • Declassify the Board , instituting annual election of directors • First United’s Board is asking for advisory votes by the shareholders if they’d like the Board to try to implement: • Majority Vote Standard – simple majority • Proxy Access – 3% ownership for 3 years Governance Enhancements • In response to feedback from institutional investors, and in keeping with evolving Board best practices, First United's Nominating and Governance Committee has formalized a policy requiring that a diverse slate of candidates be considered for each future open board seat Formalized Diversity & Inclusion Policy

33 33 Strong Investor Relations and Shareholder Communications and Engagement Clear long - term strategic plan with performance targets x Dedicated Investor Relations contact x Investor conferences and prospective investor engagement x Members of the Board and senior management routinely engage with shareholders and other stakeholders, and management regularly updates the Board on the context of ongoing investor discussions. These engagements help the Board and management gain feedback on a variety of topics, including strategic and financial performance, executive compensation, Board composition, and leadership structure. Investor presentations and periodic outreach to institutional and retail shareholders x How to contact your Board: Shareholders and interested parties wishing to contact our Board may send a letter to First United Co rporation Board of Directors, c/o Tonya K. Sturm, Secretary, First United Corporation, 19 South Second Street, Oakland, Maryland, 21550 - 0009 or by e - mail at tsturm@mybank.com. The Secretary will deliver all shareholder communications directly to the Board for consideration

34 34 V. Appendix
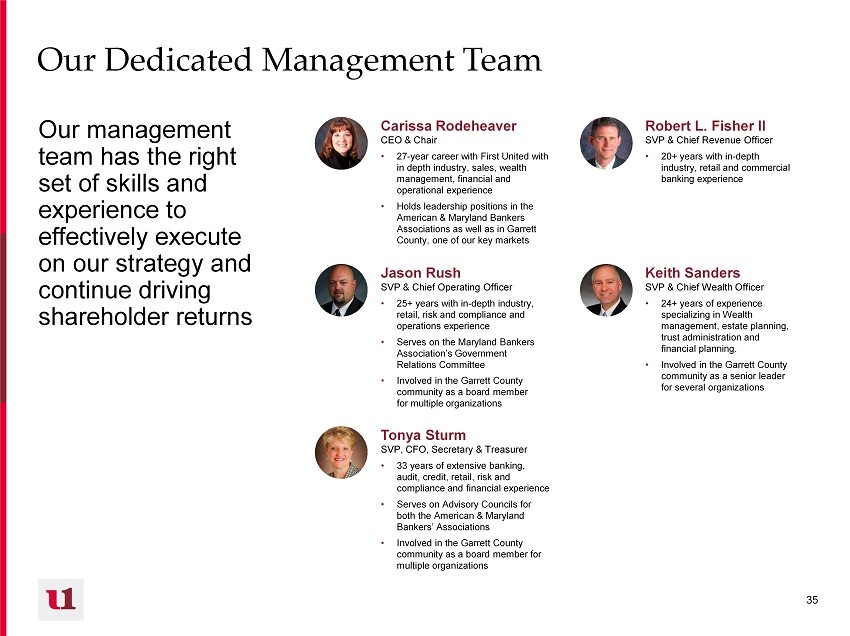
35 35 Our Dedicated Management Team Our management team has the right set of skills and experience to effectively execute on our strategy and continue driving shareholder returns Carissa Rodeheaver CEO & Chair • 27 - year career with First United with in depth industry, sales, wealth management, financial and operational experience • Holds leadership positions in the American & Maryland Bankers Associations as well as in Garrett County, one of our key markets Robert L. Fisher II SVP & Chief Revenue Officer • 20+ years with in - depth industry, retail and commercial banking experience Jason Rush SVP & Chief Operating Officer • 25+ years with in - depth industry, retail, risk and compliance and operations experience • Serves on the Maryland Bankers Association’s Government Relations Committee • Involved in the Garrett County community as a board member for multiple organizations Keith Sanders SVP & Chief Wealth Officer • 24+ years of experience specializing in Wealth management, estate planning, trust administration and financial planning. • Involved in the Garrett County community as a senior leader for several organizations Tonya Sturm SVP, CFO, Secretary & Treasurer • 33 years of extensive banking, audit, credit, retail, risk and compliance and financial experience • Serves on Advisory Councils for both the American & Maryland Bankers’ Associations • Involved in the Garrett County community as a board member for multiple organizations

36 36 Board of Directors Our directors know our markets and customers and are leaders in the communities we serve Note: Includes Sanu Chadha and Christy DiPietro who joined the board in January 2021. Name / Affiliation Unique Expertise Carissa Rodeheaver CEO & Chair • Certified Public Accountant, ABA and MBA with 27 - year career at First United and in - depth industry, company, and operational experience • Involvement in community activities, including board seats at Garrett College Foundation and Garrett Development Corporation John McCullough Lead Director ( Nom/Gov Chair) • Certified Public Accountant and retired partner of Ernst & Young, LLP with extensive audit and accounting experience • Public company M&A advisory experience, particularly with financial companies John Barr Independent Director • Business ownership and operational experience in Maryland and the surrounding area • Involvement in Washington County, Maryland and is a former 3 - term Washington County Commissioner Brian Boal Independent Director (Audit Chair) • Certified public accountant and previous tax manager at PwC with extensive ownership, accounting, public company, M&A and business advisory experience, most recently in Garrett County • Serves as the treasurer of several organizations in Garrett County M Kathryn Burkey Independent Director (Comp Chair) • Certified public accountant with substantial business ownership, accounting, M&A and business advisory experience, most recently in Allegany County • Former Chairman of the Board and committee member of Western Maryland Health System Sanu Chadha Independent Director • Certified Project Management Professional • Business and ownership experience in Monongalia County WV in a management and solutions company that provides consulting services to enterprise organizations across the United States and abroad for strategic process and technology solutions, project management, process improvement, data analytics, and cloud solutions Name / Affiliation Unique Expertise Christy DiPietro Independent Director • Chartered Financial Analyst • Private investor who provides wealth management services for a diverse portfolio of assets, including investment analysis and strategy, asset allocation, tax matters, insurance matters, estate planning, property management, and charitable giving. • Operational experience in a large public investment firm where she managed $2.3 billion in high - quality taxable fixed income assets for numerous institutional clients Patricia Milon Independent Director • Accomplished regulatory expert • Enterprise risk management and corporate governance experience with expertise in compliance, legal and regulatory risk for public companies • Consulting roles for fintech and regtech companies Gary Ruddell Independent Director • Business ownership and operational experience in Garrett County in a successful logistical and back - office support services business • Director experience at various community organizations Irvin Robert Rudy Independent Director • Business ownership and operational experience in Garrett County • Board and committee experience as a trustee of The Ohio University Foundation, past first prevention Commissioner, retired chief of local fire department Marisa Shockley Independent Director • Business ownership and operational experience in Frederick County • Chairman for the Maryland Auto Dealers’ Association, past President of Maryland School for the Deaf; TIME Quality Award regional finalist Hoye Andrew Walls III Independent Director • Business ownership and operational experience in Monongalia County, WV in a large printing company • Director experience at various community organizations such as United Way, Public Theatre, Red Cross and the Salvation Army Note: Includes Gary Ruddell and M Kathryn Burkey, who will be retiring in May 2021.

37 37 Non - GAAP Reconciliation This presentation includes certain non - GAAP financial measures, including pre - provision net revenue, net income, earnings per share (basic and diluted), return on average assets, return on average stockholders’ equity, return on average tangible commo n e quity, equity, tangible common equity, tangible assets, the ratio of tangible common equity to tangible assets, tangible book value per shar e, share, net interest margin, and efficiency ratio. These non - GAAP financial measures and any other non - GAAP financial measures th at are that are discussed in this presentation should not be considered in isolation, and should be considered as additions to, and not substitutes for or superior to, measures of financial performance prepared in accordance with GAAP. There are a number of lim ita tions limitations related to the use of these non - GAAP financial measures versus their nearest GAAP equivalents. For example, other co mpanies companies may calculate non - GAAP financial measures differently or may use other measures to evaluate their performance, all of which of which could reduce the usefulness of the Company’s non - GAAP financial measures as tools for comparison. See the Appendix to t his to this presentation for a reconciliation of the non - GAAP financial measures used in (or conveyed orally during) this presentati on to their to their most directly comparable GAAP financial measures. ($000s, except where otherwise noted) YTD LTM 2017 2018 2019 2020 Q1 2020 Q2 2020 Q3 2020 Q4 2020 Q1 2021 3/31/2021 3/31/2021 Pre-Provision Net Revenue ("PPNR") Pre-tax income, as reported 12,214$ 13,431$ 16,465$ 17,788$ 2,277$ 3,281$ 6,356$ 5,874$ 4,529$ 4,529$ 20,040$ Add back: Provision expense 2,534 2,111 1,320 5,401 2,654 2,167 160 420 110 110 2,857 Add back: Settlement expense, gross - - - - - - - - 3,300 3,300 3,300 Pre-Provision Net Revenue, as adjusted 14,748$ 15,542$ 17,785$ 23,189$ 4,931$ 5,448$ 6,516$ 6,294$ 7,939$ 7,939$ 26,197$ Net Income Net income, as reported 5,269$ 10,667$ 13,129$ 13,841$ 1,755$ 2,570$ 4,960$ 4,556$ 3,430$ 3,430$ 15,516$ Less: Preferred stock dividends (1,215) - - - - - - - - - - Net income, available to common shareholders,as reported (a) 4,054$ 10,667$ 13,129$ 13,841$ 1,755$ 2,570$ 4,960$ 4,556$ 3,430$ 3,430$ 15,516$ Add back: Settlement expense, net of tax - - - - - - - - 2,565 2,565 2,565 Net income, as adjusted (b) 4,054$ 10,667$ 13,129$ 13,841$ 1,755$ 2,570$ 4,960$ 4,556$ 5,995$ 5,995$ 18,081$ Common shares outstanding - basic (actual) (d) 7,067,425 7,086,632 7,110,022 6,992,911 6,966,898 6,983,523 6,988,998 6,992,911 6,998,617 6,998,617 6,998,617 Common shares outstanding - diluted (actual) (e) 7,067,425 7,086,632 7,110,022 6,997,981 6,991,902 6,988,593 6,994,068 6,997,981 7,001,997 7,001,997 7,001,997 Earnings Per Share - Basic Earnings Per Share - Basic, as reported (a)/(d) 0.57$ 1.51$ 1.85$ 1.98$ 0.25$ 0.37$ 0.71$ 0.65$ 0.49$ 0.49$ 2.22$ Add back: Settlement expense, net of tax - - - - - - - - 0.37 0.37 0.37 Earnings Per Share - Basic, as adjusted (b)/(d) 0.57$ 1.51$ 1.85$ 1.98$ 0.25$ 0.37$ 0.71$ 0.65$ 0.86$ 0.86$ 2.58$ Earnings Per Share - Diluted Earnings Per Share - Diluted, as reported (a)/(e) 0.57$ 1.51$ 1.85$ 1.97$ 0.25$ 0.37$ 0.71$ 0.65$ 0.49$ 0.49$ 2.22$ Add back: Settlement expense, net of tax - - - - - - - - 0.37 0.37 0.37 Earnings Per Share - Diluted, as adjusted (b)/(e) 0.57$ 1.51$ 1.85$ 1.97$ 0.25$ 0.37$ 0.71$ 0.65$ 0.86$ 0.86$ 2.58$

38 38 Non - GAAP Reconciliation, continued ($000s, except where otherwise noted) YTD LTM 2017 2018 2019 2020 Q1 2020 Q2 2020 Q3 2020 Q4 2020 Q1 2021 3/31/2021 3/31/2021 Return on Average Assets (quarter and YTD annualized) Average Assets ( c) 1,322,013$ 1,311,902$ 1,418,928$ 1,613,669$ 1,444,456$ 1,599,603$ 1,681,917$ 1,710,900$ 1,765,133$ 1,765,133$ 1,640,402$ Return on Average Assets, as reported (a)/(c) 0.40% 0.81% 0.93% 0.86% 0.49% 0.64% 1.18% 1.07% 0.78% 0.78% 0.95% Add back: Settlement expense, net of tax - - - - - - - - 0.58% 0.58% 0.16% Return on Average Assets, as adjusted (b)/(c) 0.40% 0.81% 0.93% 0.86% 0.49% 0.64% 1.18% 1.07% 1.36% 1.36% 1.10% Return on Average Common Stockholders' Equity Average common stockholders' equity (f) 106,332$ 113,659$ 125,774$ 127,101$ 125,517$ 122,697$ 128,103$ 132,087$ 131,541$ 131,541$ 127,989$ Less: Average goodwill 11,004 11,004 11,004 11,004 11,004 11,004 11,004 11,004 11,004 11,004 11,004 Average tangible common equity (g) 95,328$ 102,655$ 114,770$ 116,097$ 114,513$ 111,693$ 117,099$ 121,083$ 120,537$ 120,537$ 116,985$ Return on average common stockholders' equity, as reported (a)/(f) 3.81% 9.39% 10.44% 10.89% 5.59% 8.38% 15.49% 13.80% 10.43% 10.43% 12.12% Add back: Settlement expense, net of tax - - - - - - - - 7.80% 7.80% 2.00% Return on average common stockholders' equity, as adjusted (b)/(f) 3.81% 9.39% 10.44% 10.89% 5.59% 8.38% 15.49% 13.80% 18.23% 18.23% 14.13% Return on Average Tangible Common Stockholders' Equity Return on average tangible common equity, as reported (a)/(g) 4.25% 10.39% 11.44% 11.92% 6.13% 9.20% 16.94% 15.05% 11.38% 11.38% 13.26% Add back: Settlement expense, net of tax - - - - - - - - 8.51% 8.51% 2.19% Return on average tangible common equity, as adj (b)/(g) 4.25% 10.39% 11.44% 11.92% 6.13% 9.20% 16.94% 15.05% 19.89% 19.89% 15.46% Tangible Book Value per Common Share Total common equity, as reported (h) 108,390$ 117,066$ 125,940$ 131,047$ 118,549$ 124,453$ 130,237$ 131,047$ 129,189$ 129,189$ 129,189$ Less: Goodwill 11,004 11,004 11,004 11,004 11,004 11,004 11,004 11,004 11,004 11,004 11,004 Total tangible common equity (i) 97,386$ 106,062$ 114,936$ 120,043$ 107,545$ 113,449$ 119,233$ 120,043$ 118,185$ 118,185$ 118,185$ Tangible book value per basic common share (i)/(d) 13.78$ 14.97$ 16.17$ 17.17$ 15.44$ 16.25$ 17.06$ 17.17$ 16.89$ 16.89$ 16.89$ Tangible common equity to tangible assets ("TCE Ratio") Total assets, as reported (j) 1,336,470 1,384,516 1,442,966 1,733,414 1,461,513 1,639,636 1,685,907 1,733,414 1,781,833 1,781,833 1,781,833 Less: Goodwill 11,004 11,004 11,004 11,004 11,004 11,004 11,004 11,004 11,004 11,004 11,004 Total tangible assets (k) 1,325,466$ 1,373,512$ 1,431,962$ 1,722,410$ 1,450,509$ 1,628,632$ 1,674,903$ 1,722,410$ 1,770,829$ 1,770,829$ 1,770,829$ Tangible common equity to tangible assets (i)/(k) 7.35% 7.72% 8.03% 6.97% 7.41% 6.97% 7.12% 6.97% 6.67% 6.67% 6.67% Net interest margin (tax equivalent) Net interest income 39,578$ 44,182$ 46,391$ 48,546$ 11,887$ 12,656$ 11,902$ 12,101$ 12,236$ 12,236$ 48,895$ Tax equivalent adjustment 637 796 868 917 223 226 228 239 239 239 933 Tax equivalent net interest income (m) 40,215$ 44,978$ 47,259$ 49,463$ 12,110$ 12,882$ 12,130$ 12,340$ 12,475$ 12,475$ 49,828$ Average earning assets (n) 1,193,949$ 1,203,813$ 1,285,019$ 1,480,165$ 1,318,529$ 1,468,694$ 1,545,323$ 1,586,360$ 1,627,190$ 1,627,190$ 1,509,219$ Net interest margin (tax equivalent) (m)/(n) 3.37% 3.74% 3.68% 3.34% 3.69% 3.53% 3.12% 3.09% 3.11% 3.11% 3.30% Efficiency Ratio Noninterest expense, as reported 39,170$ 43,808$ 45,389$ 43,934$ 11,005$ 11,427$ 10,540$ 10,962$ 12,927$ 12,927$ 45,856$ Less: Foreclosure & Repo Expense (Income) 369 1,582 1,618 170 50 33 43 44 (364) (364) (244) Add back: Settlement expense - - - - - - - - 3,300 3,300 3,300 Noninterest expense, adjusted (o) 38,801$ 42,226$ 43,771$ 43,764$ 10,955$ 11,394$ 10,497$ 10,918$ 9,991$ 9,991$ 42,800$ Net interest income 39,578$ 44,182$ 46,391$ 48,546$ 11,887$ 12,656$ 11,902$ 12,101$ 12,236$ 12,236$ 48,895$ Noninterest income 14,340 15,168 16,783 18,577 4,049 4,219 5,154 5,155 5,330 5,330 19,858 Tax equivalent adjustment 637 796 868 917 223 226 228 239 239 239 933 Total tax equivalent revenue (p) 54,555$ 60,146$ 64,042$ 68,040$ 16,159$ 17,101$ 17,284$ 17,495$ 17,805$ 17,805$ 69,686$ Efficiency ratio, as adjusted (o)/(p) 71.12% 70.21% 68.35% 64.32% 67.80% 66.63% 60.73% 62.41% 56.11% 56.11% 61.42%

39 39 Selected Peer Groups • Proxy peers can be found in First United’s 2021 definitive proxy statement found here: https://www.sec.gov/Archives/edgar/data/763907/000110465920048280/tm2016149d1_defc14a.htm – Proxy peers include: ACNB, ASRV, CFFI, CHMG, CVLY, CZFS, CZNC, EVBN, FDBC, FRAF, MVBF, NKSH, OPOF, ORRF, PWOD, RIVE, SAL, SMMF and UNB • ISS peers can be found in the 2021 ISS Annual Benchmark Report – Includes ASRV, CFFI, CHMG, CVLY, CZFS, CZNC, ESXB, EVBN, FDBC, FNLC, FRAF, MBCN, MVBF, NKSH, NWFL, OPOF, ORRF, PWOD, RIVE, SAL, SHBI, SLCT, TCFC and UNB