Attached files
| file | filename |
|---|---|
| 8-K - 8-K - CubeSmart | cube-20210512x8k.htm |
Exhibit 99.1
| New York City Portfolio Presentation May 2021 |
| Safe Harbor Statement The forward-looking statements contained in this presentation are subject to various risks and known and unknown uncertainties. Although the Company believes the expectations reflected in such forward-looking statements are based on reasonable assumptions, there can be no assurance that the Company's expectations will be achieved. Factors which could cause the Company's actual results, performance, or achievements to differ significantly from the results, performance, or achievements expressed or implied by such statements are set forth under the captions "Item 1A. Risk Factors" and "Forward-Looking Statements" in our annual report on Form 10-K and in our quarterly reports on Form 10-Q and described from time to time in the Company's filings with the SEC. Forward-looking statements are not guarantees of performance. For forward-looking statements herein, the Company claims the protection of the safe harbor for forward-looking statements contained in the Private Securities Litigation Reform Act of1995. The Company assumes no obligation to update or supplement forward-looking statements that become untrue because of subsequent events. Use ofNon-GAAP Financial Measures This presentation contains certain non-GAAP financial measures. The definitions of these terms, the reasons for their use, and reconciliations to the most directly comparable GAAP measures are included in our Earnings Release as well as the Non-GAAP Financial Measures section under the caption "Management's Discussion and Analysis of Financial Condition and Results of Operations" (or similar captions) in our quarterly reports on Forms 10-Q and 10-K, and described from time to time in the Company's filings with the SEC. 21 wfu p *&h m tioo--------------------------------- |
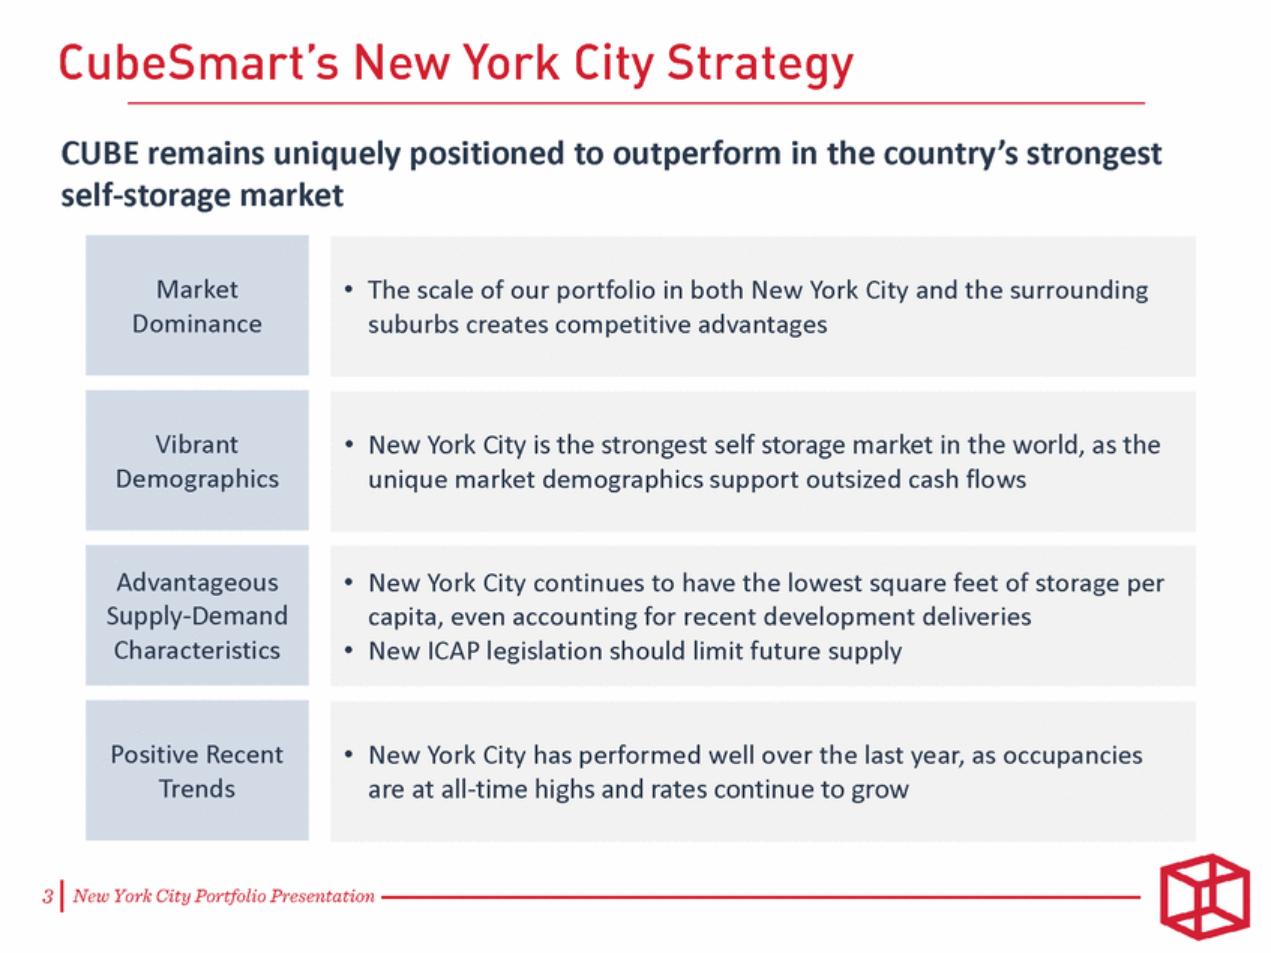
| CUBE remains uniquely positioned to outperform in the country’s strongest self-storage market • New York City has performed well over the last year, as occupancies are at all-time highs and rates continue to grow Positive Recent Trends • New York City continues to have the lowest square feet of storage per capita, even accounting for recent development deliveries • New ICAP legislation should limit future supply Advantageous Supply-Demand Characteristics • New York City is the strongest self storage market in the world, as the unique market demographics support outsized cash flows Vibrant Demographics • The scale of our portfolio in both New York City and the surrounding suburbs creates competitive advantages Market Dominance |
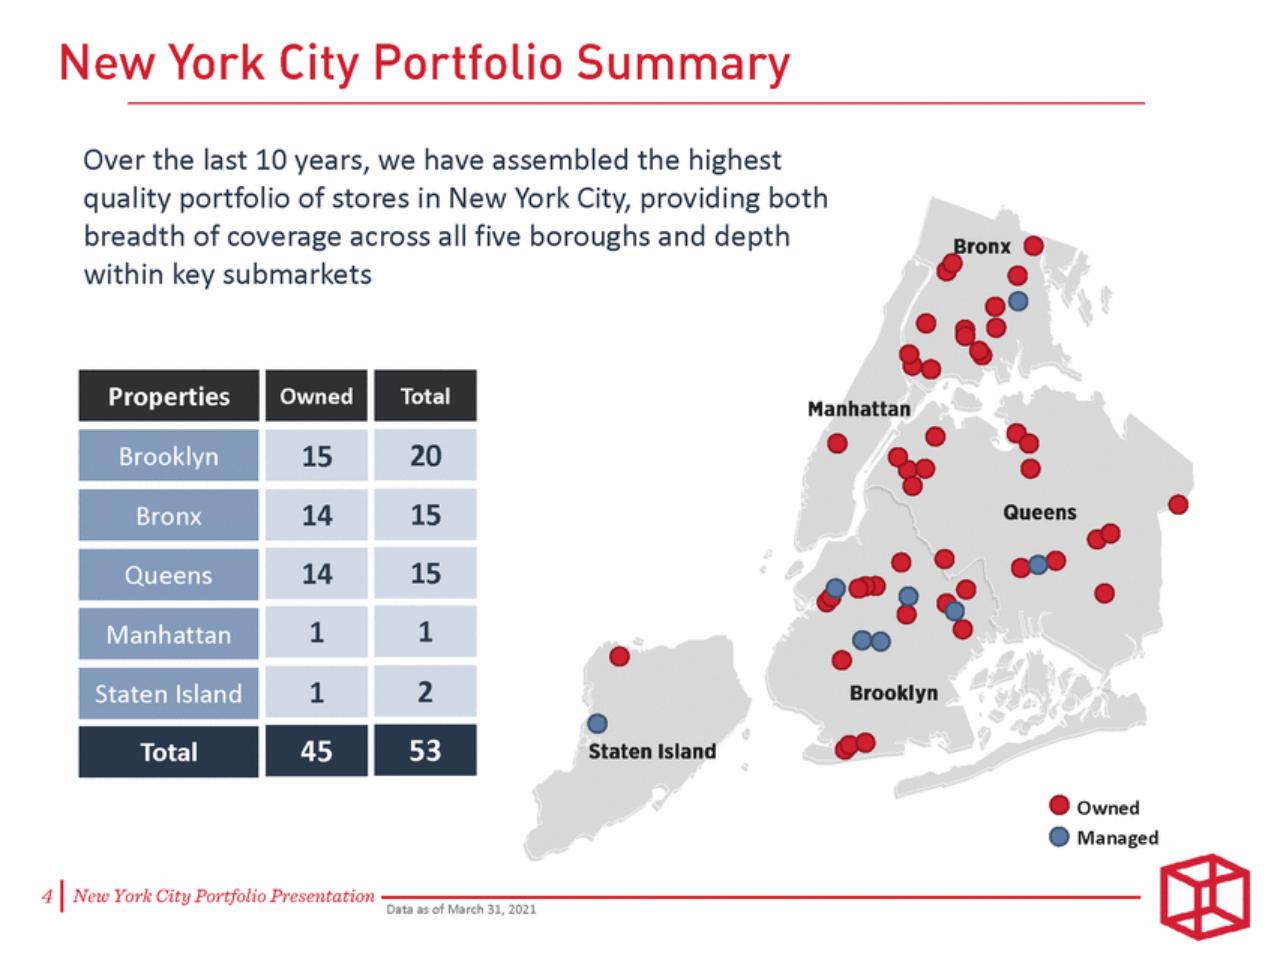
| Over the last 10 years, we have assembled the highest quality portfolio of stores in New York City, providing both breadth of coverage across all five boroughs and depth within key submarkets Owned Managed Data as of March 31, 2021 53 45 Total 2 1 Staten Island 1 1 Manhattan 15 14 Queens 15 14 Bronx 20 15 Brooklyn Properties Total Owned |
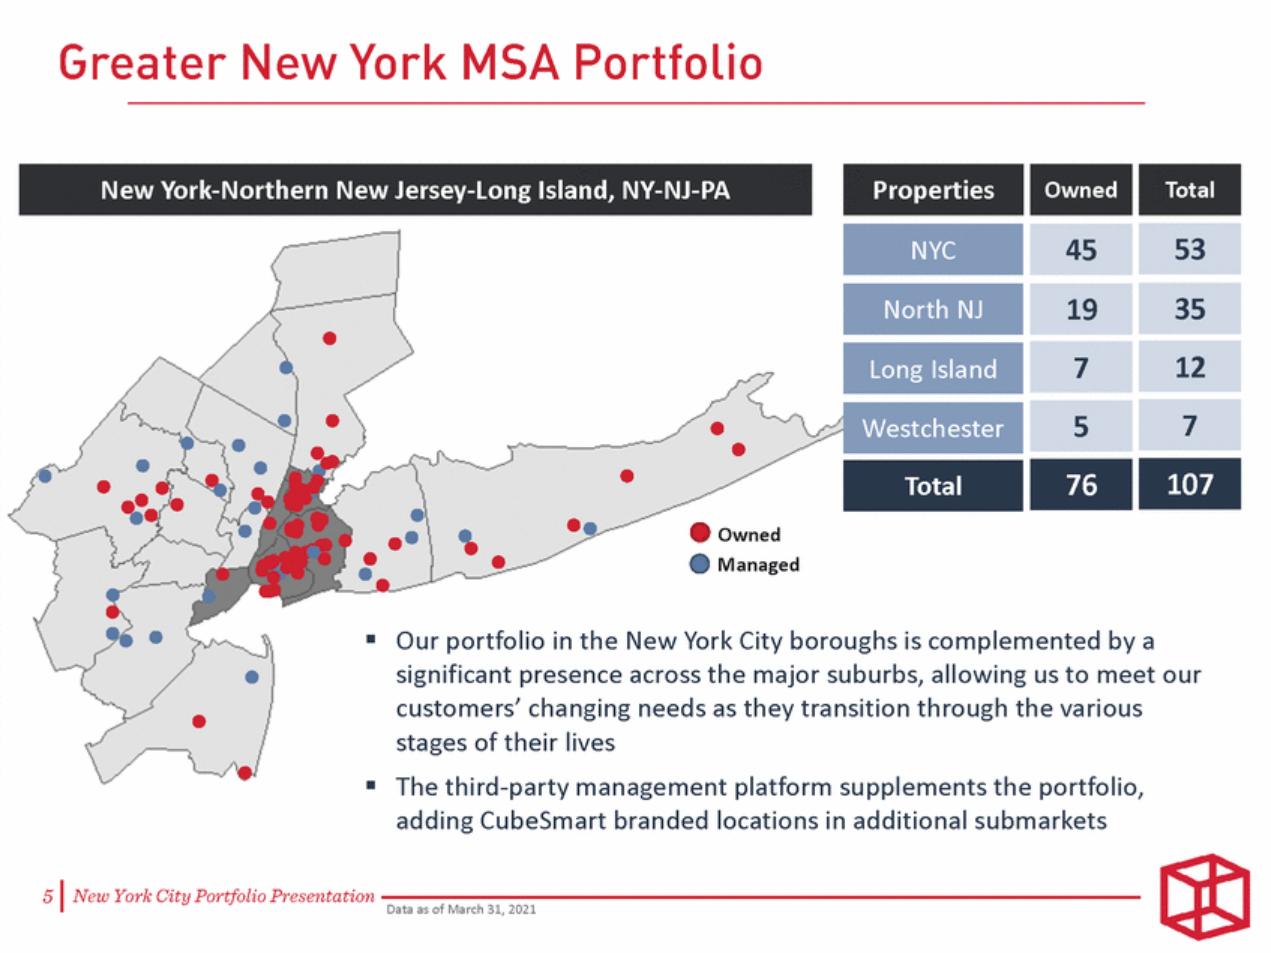
| Owned Managed ▪Our portfolio in the New York City boroughs is complemented by a significant presence across the major suburbs, allowing us to meet our customers’ changing needs as they transition through the various stages of their lives ▪The third-party management platform supplements the portfolio, adding CubeSmart branded locations in additional submarkets Data as of March 31, 2021 107 76 Total 7 5 Westchester 12 7 Long Island 35 19 North NJ 53 45 NYC New York-Northern New Jersey-Long Island, NY-NJ-PA Properties Total Owned |
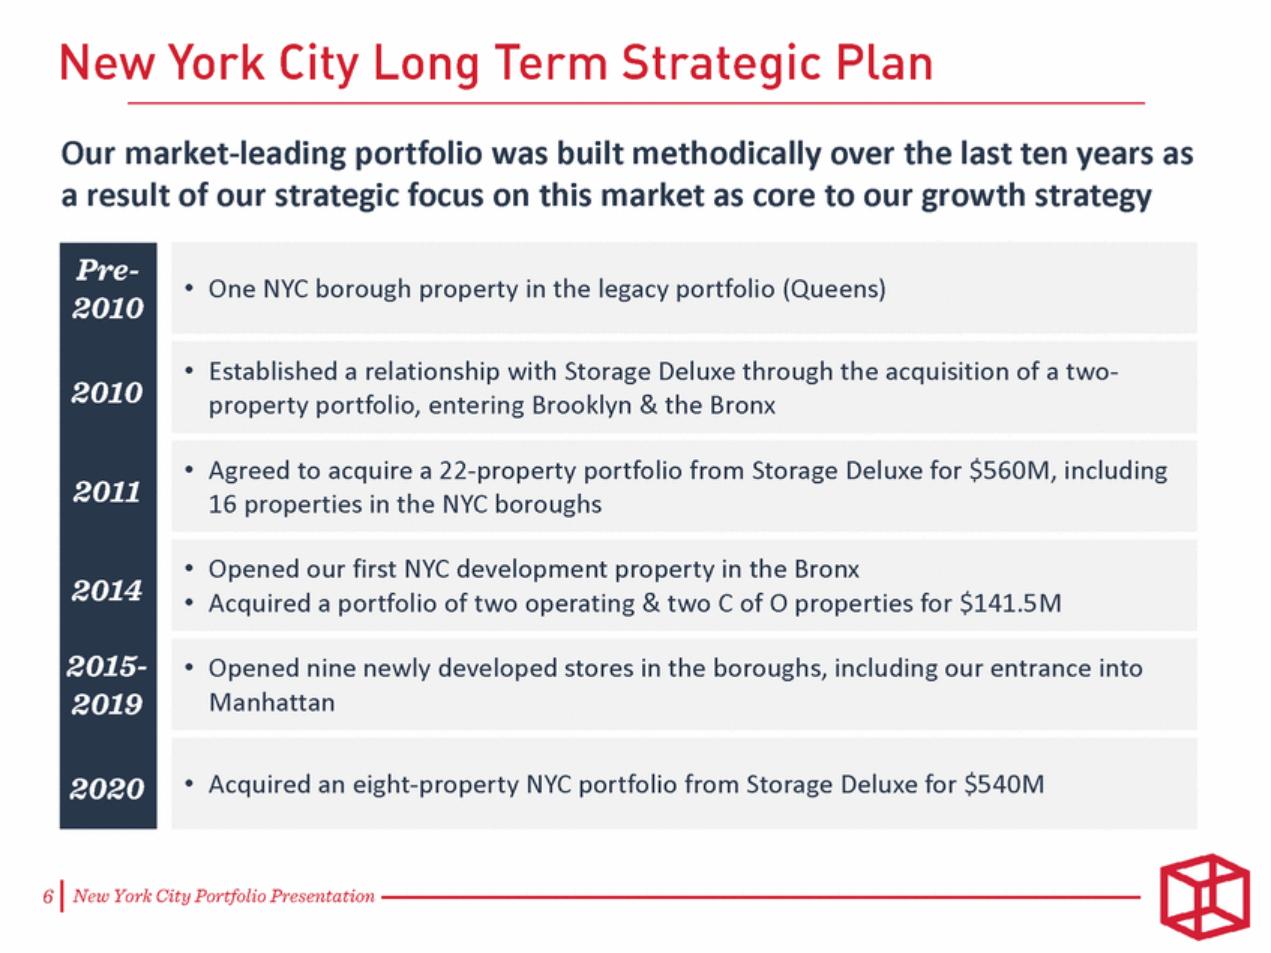
| Our market-leading portfolio was built methodically over the last ten years as a result of our strategic focus on this market as core to our growth strategy • Acquired an eight-property NYC portfolio from Storage Deluxe for $540M • Opened nine newly developed stores in the boroughs, including our entrance into Manhattan • Opened our first NYC development property in the Bronx • Acquired a portfolio of two operating & two C of O properties for $141.5M • Agreed to acquire a 22-property portfolio from Storage Deluxe for $560M, including 16 properties in the NYC boroughs • Established a relationship with Storage Deluxe through the acquisition of a two-property portfolio, entering Brooklyn & the Bronx • One NYC borough property in the legacy portfolio (Queens) |
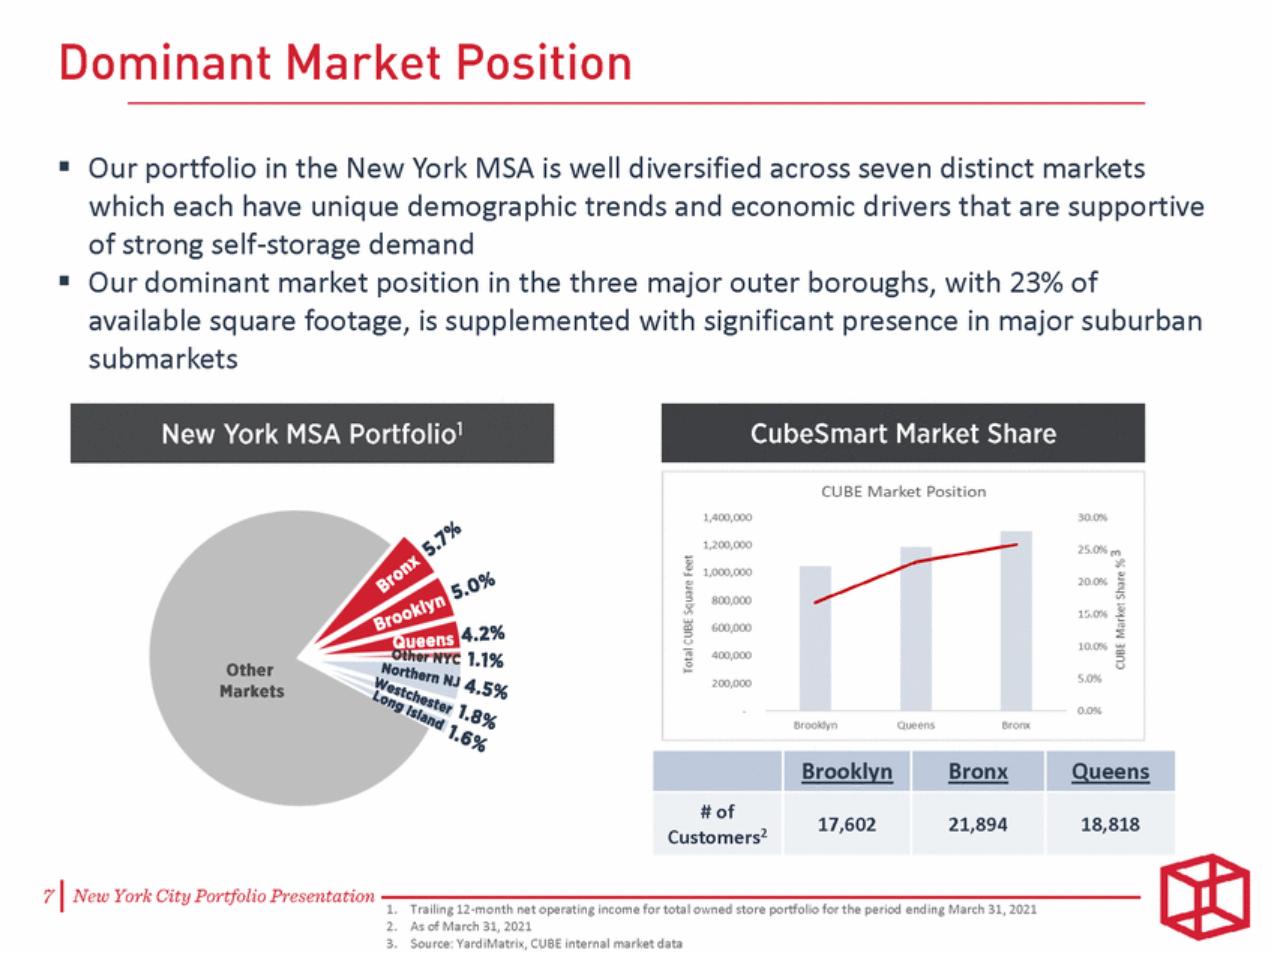
| ▪ Our portfolio in the New York MSA is well diversified across seven distinct markets which each have unique demographic trends and economic drivers that are supportive of strong self-storage demand Our dominant market position in the three major outer boroughs, with 23% of available square footage, is supplemented with significant presence in major suburban submarkets ▪ 1. 2. 3. Trailing 12-month net operating income for total owned store portfolio for the period ending March 31, 2021 As of March 31, 2021 Source: YardiMatrix, CUBE internal market data Brooklyn Bronx Queens # of Customers2 17,602 21,894 18,818 |
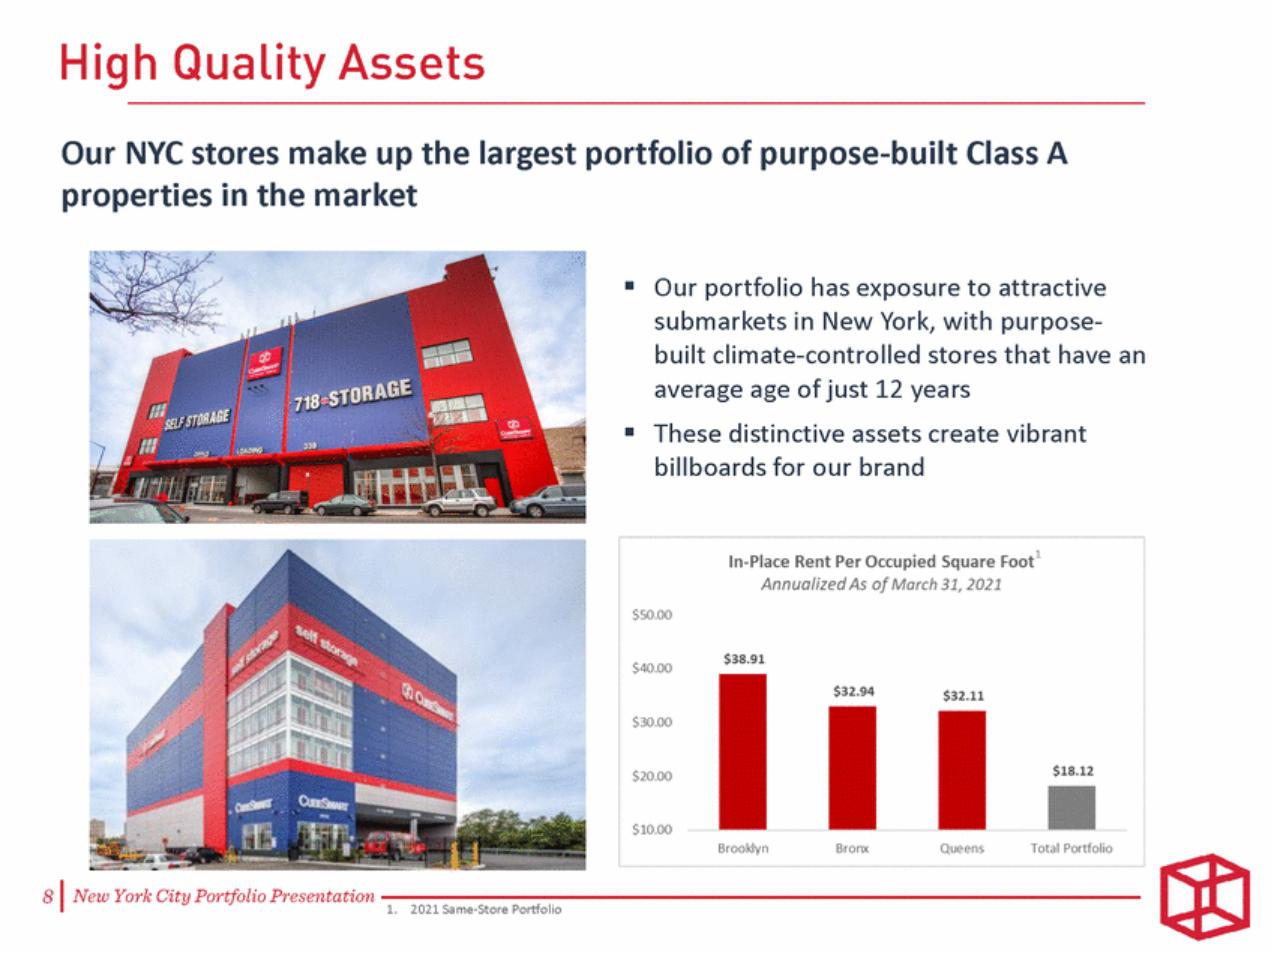
| Our NYC stores make up the largest portfolio of purpose-built Class A properties in the market ▪ Our portfolio has exposure to attractive submarkets in New York, with purpose-built climate-controlled stores that have an average age of just 12 years These distinctive assets create vibrant billboards for our brand ▪ 11 1. 2021 Same-Store Portfolio |
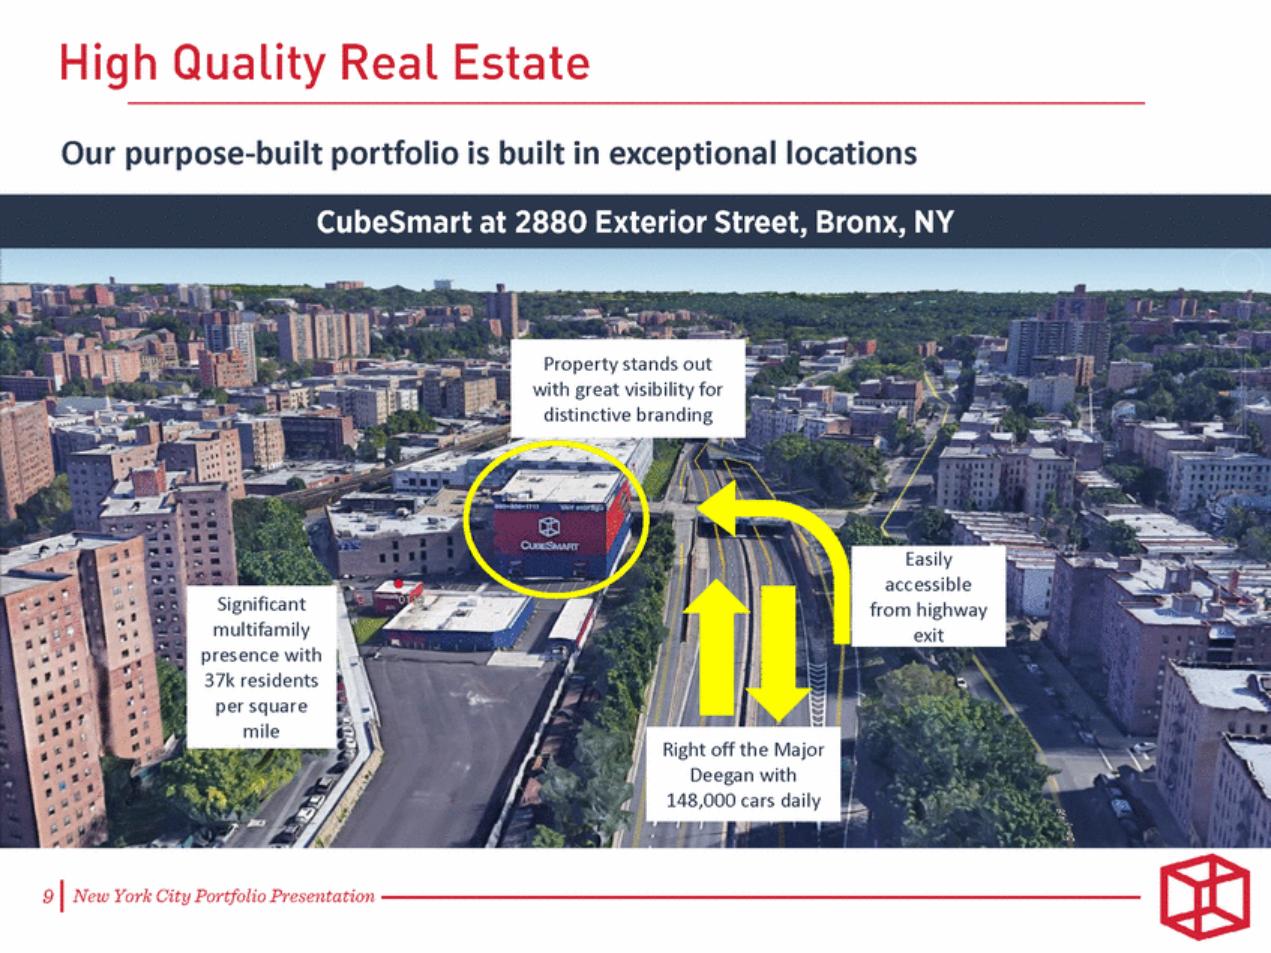
| Our purpose-built portfolio is built in exceptional locations Property stands out with great visibility for distinctive branding Easily accessible from highway exit Significant multifamily presence with 37k residents per square mile Right off the Major Deegan with 148,000 cars daily |
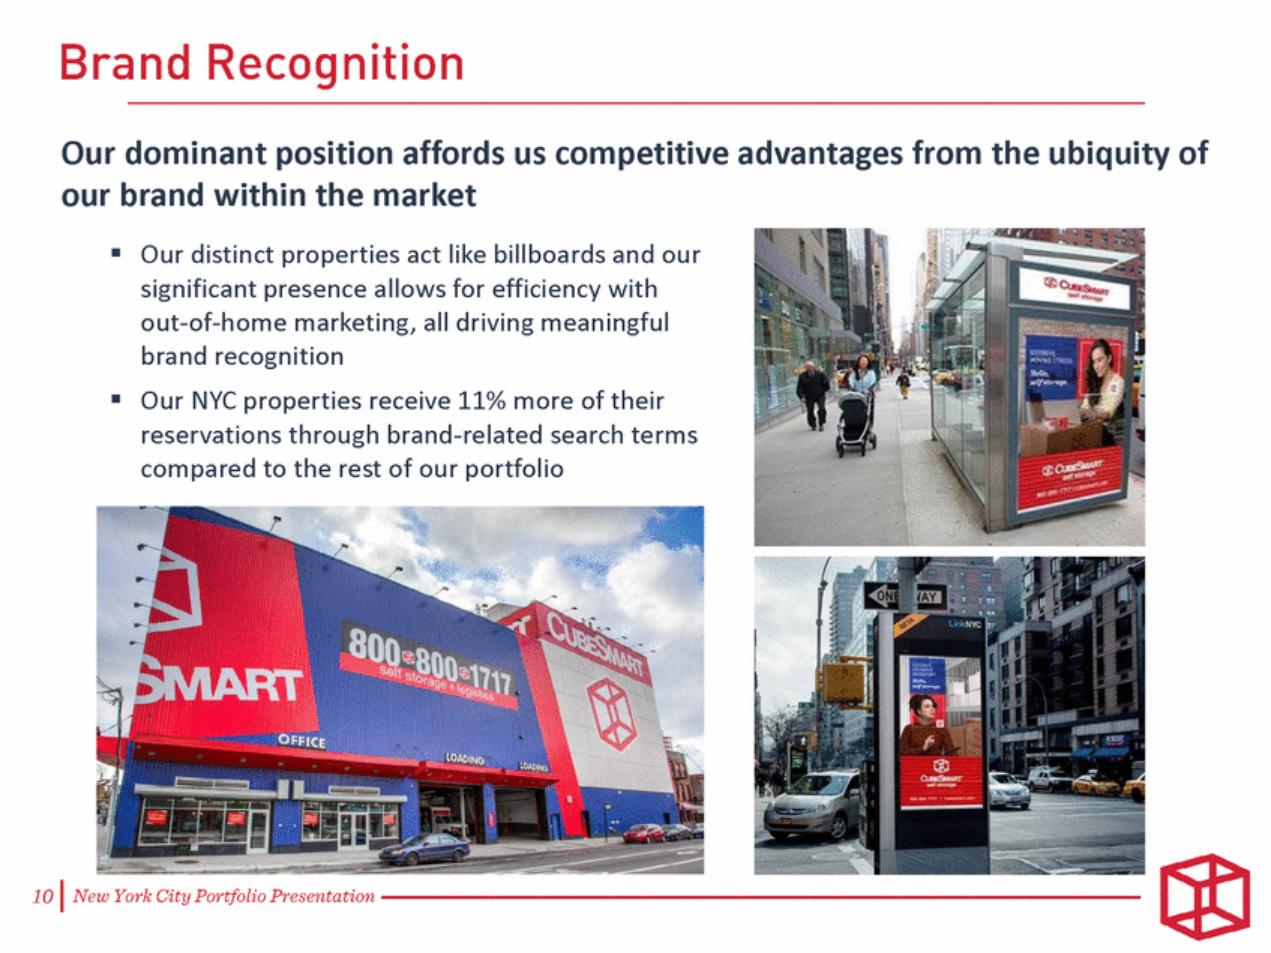
| Our dominant position affords us competitive advantages from the ubiquity of our brand within the market ▪Our distinct properties act like billboards and our significant presence allows for efficiency with out-of-home marketing, all driving meaningful brand recognition ▪Our NYC properties receive 11% more of their reservations through brand-related search terms compared to the rest of our portfolio |
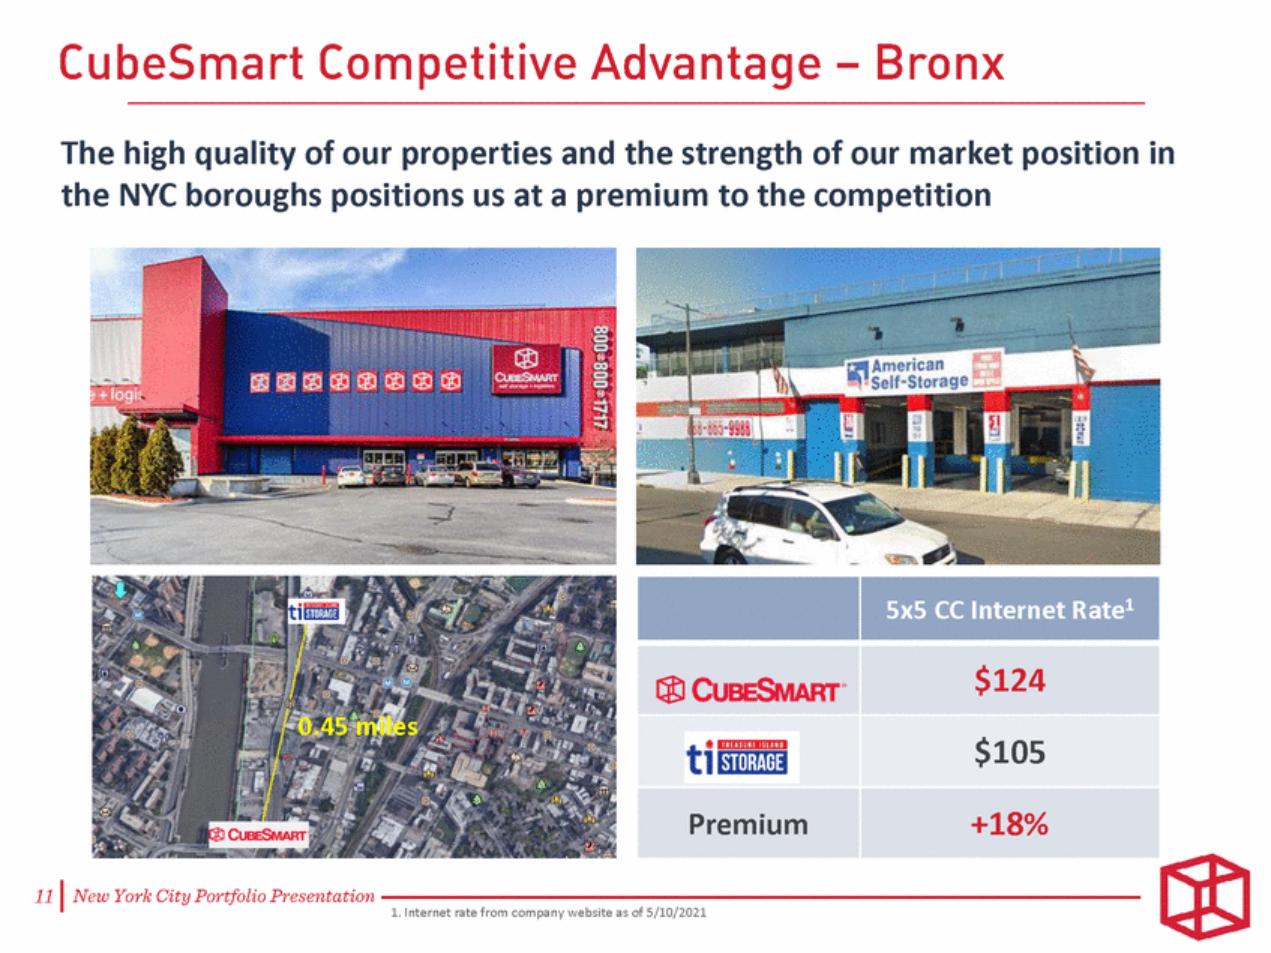
| The high quality of our properties and the strength of our market position in the NYC boroughs positions us at a premium to the competition 0.45 miles 1. Internet rate from company website as of 5/10/2021 5x5 CC Internet Rate1 $124 $105 Premium +18% |
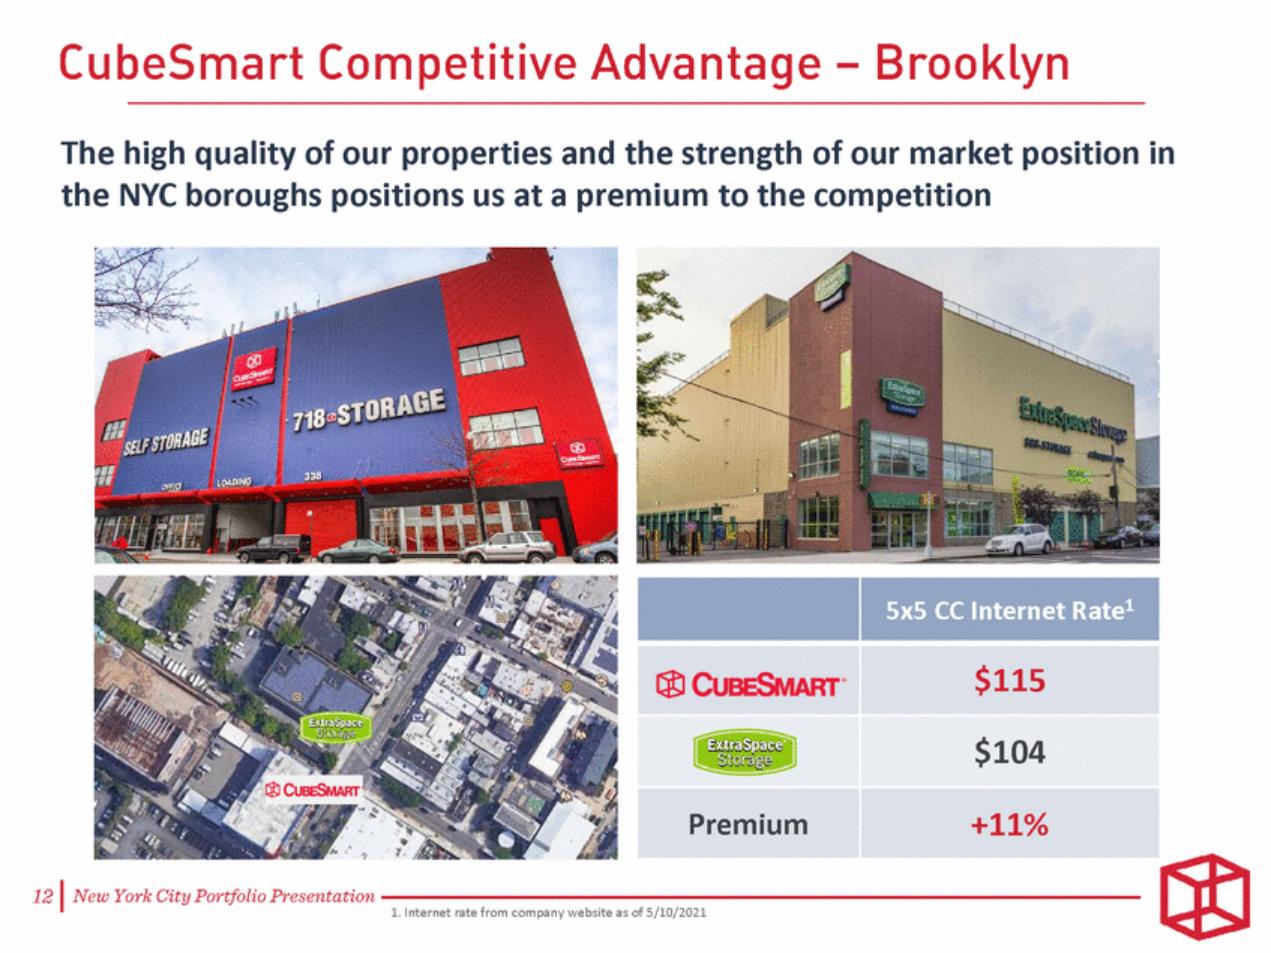
| The high quality of our properties and the strength of our market position in the NYC boroughs positions us at a premium to the competition 1. Internet rate from company website as of 5/10/2021 5x5 CC Internet Rate1 $115 $104 Premium +11% |
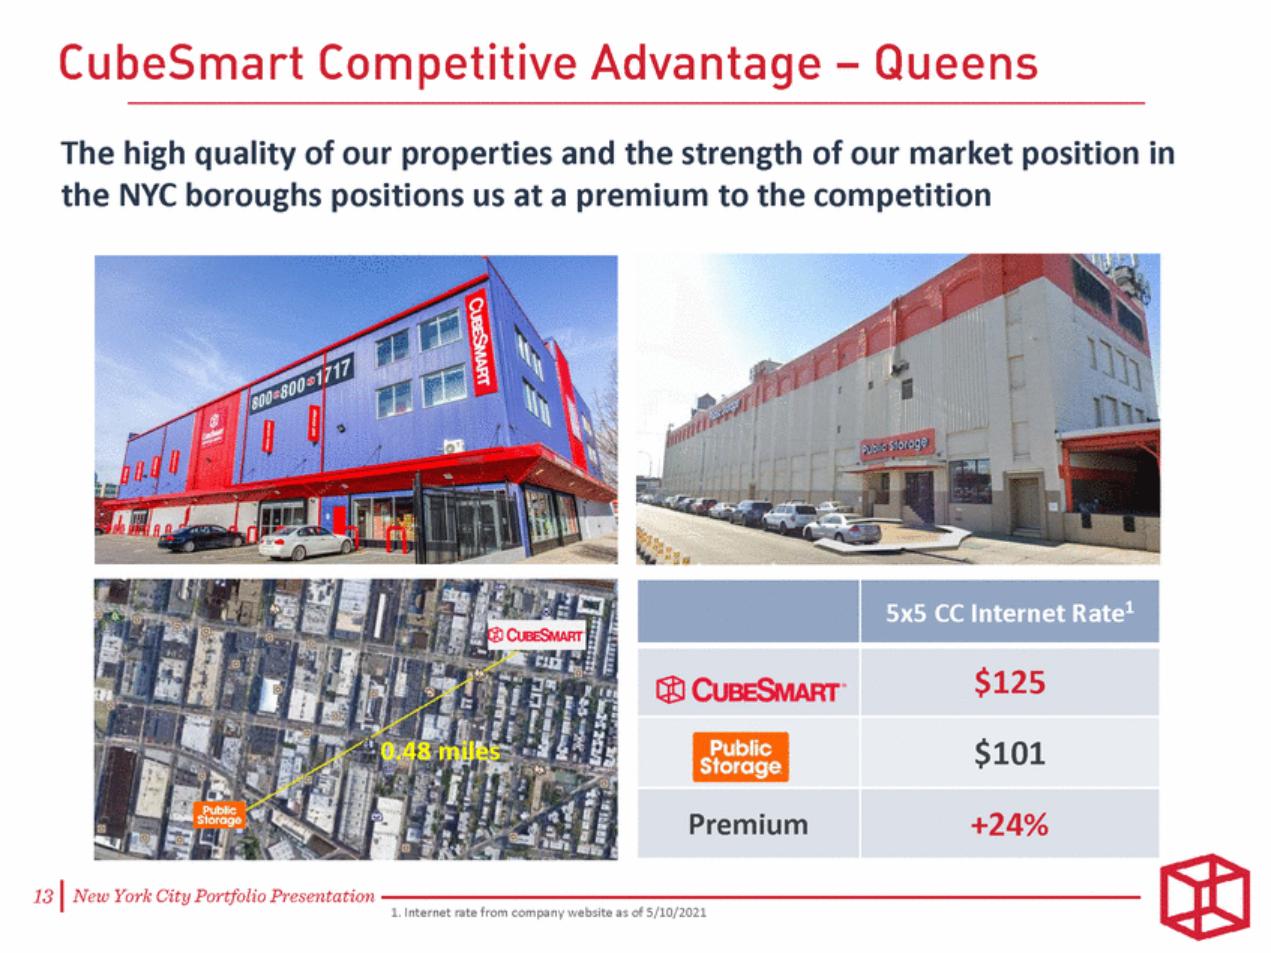
| The high quality of our properties and the strength of our market position in the NYC boroughs positions us at a premium to the competition 0.48 miles 1. Internet rate from company website as of 5/10/2021 5x5 CC Internet Rate1 $125 $101 Premium +24% |
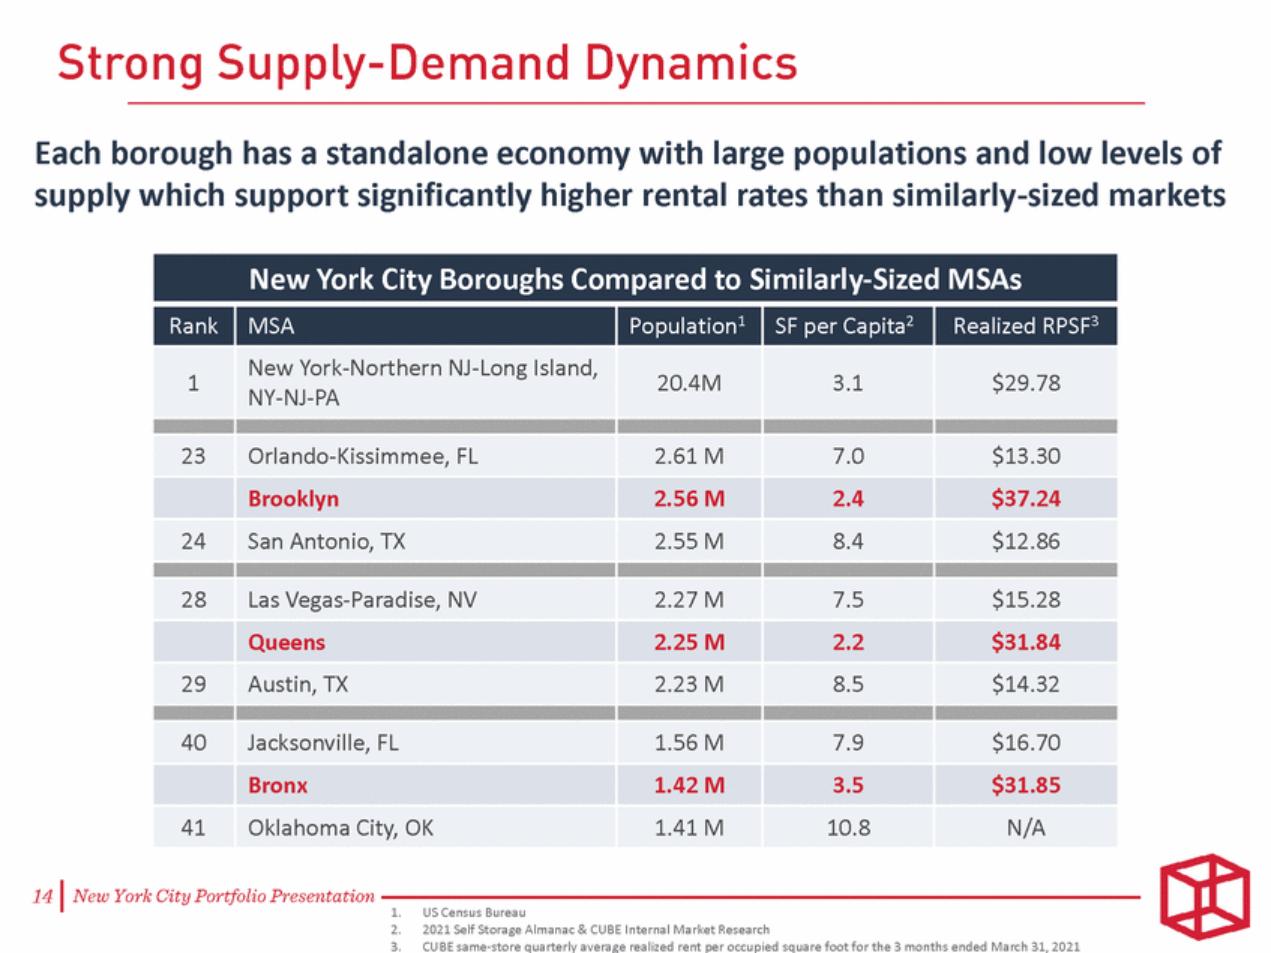
| Each borough has a standalone economy with large populations and low levels of supply which support significantly higher rental rates than similarly-sized markets 1. 2. 3. US Census Bureau 2021 Self Storage Almanac & CUBE Internal Market Research CUBE same-store quarterly average realized rent per occupied square foot for the 3 months ended March 31, 2021 New York City Boroughs Compared to Similarly-Sized MSAs Rank MSA Population1 SF per Capita2 Realized RPSF3 1 New York-Northern NJ-Long Island, NY-NJ-PA 20.4M 3.1 $29.78 23 Orlando-Kissimmee, FL 2.61 M 7.0 $13.30 Brooklyn 2.56 M 2.4 $37.24 24 San Antonio, TX 2.55 M 8.4 $12.86 28 Las Vegas-Paradise, NV 2.27 M 7.5 $15.28 Queens 2.25 M 2.2 $31.84 29 Austin, TX 2.23 M 8.5 $14.32 40 Jacksonville, FL 1.56 M 7.9 $16.70 Bronx 1.42 M 3.5 $31.85 41 Oklahoma City, OK 1.41 M 10.8 N/A |
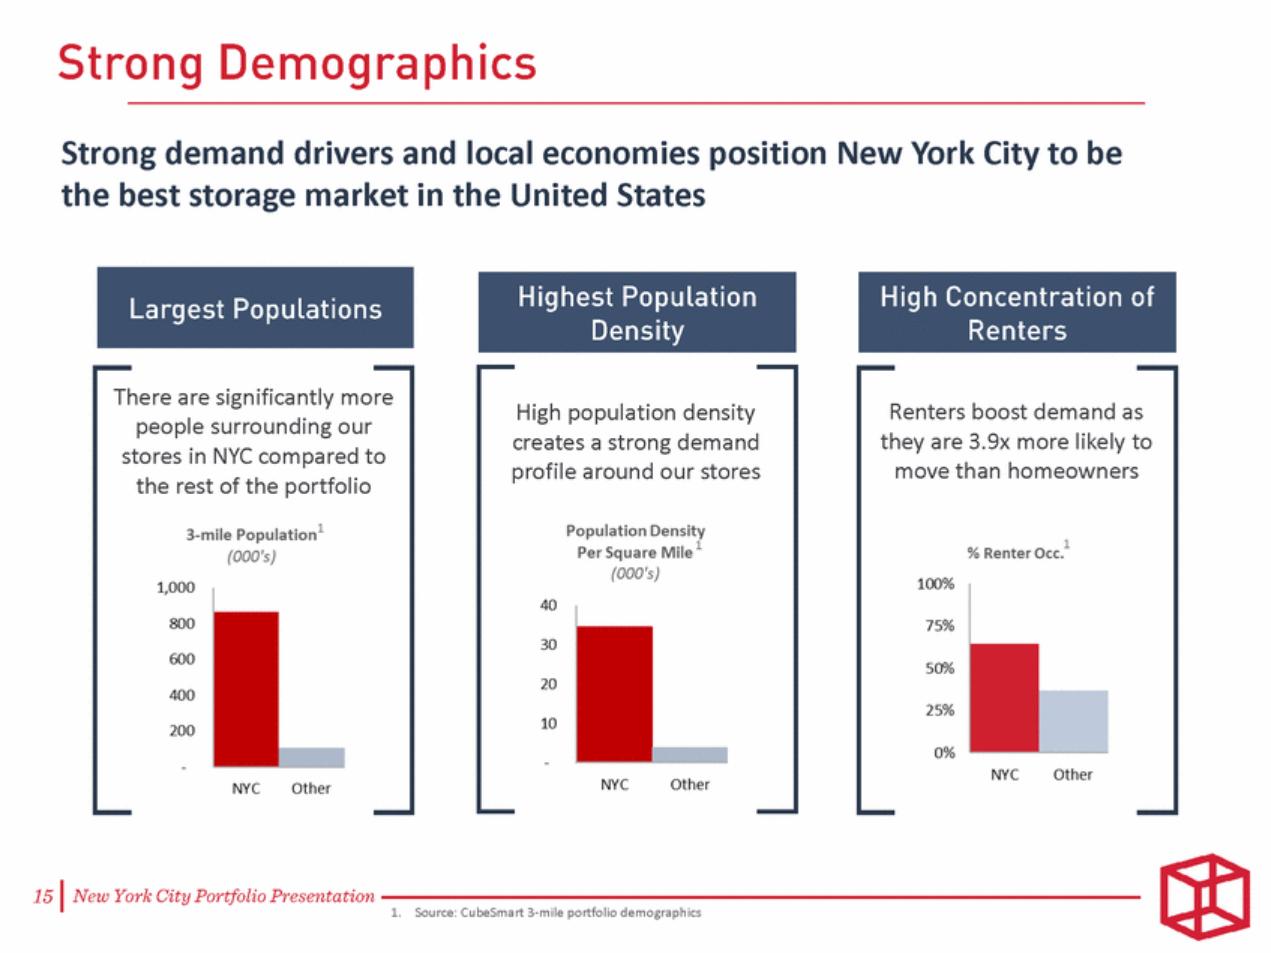
| Strong demand drivers and local economies position New York City to be the best storage market in the United States they are 3.9x more likely to 1. Source: CubeSmart 3-mile portfolio demographics Renters boost demand as move than homeowners 1 High population density creates a strong demand profile around our stores 1 There are significantly more people surrounding our stores in NYC compared to the rest of the portfolio 1 |
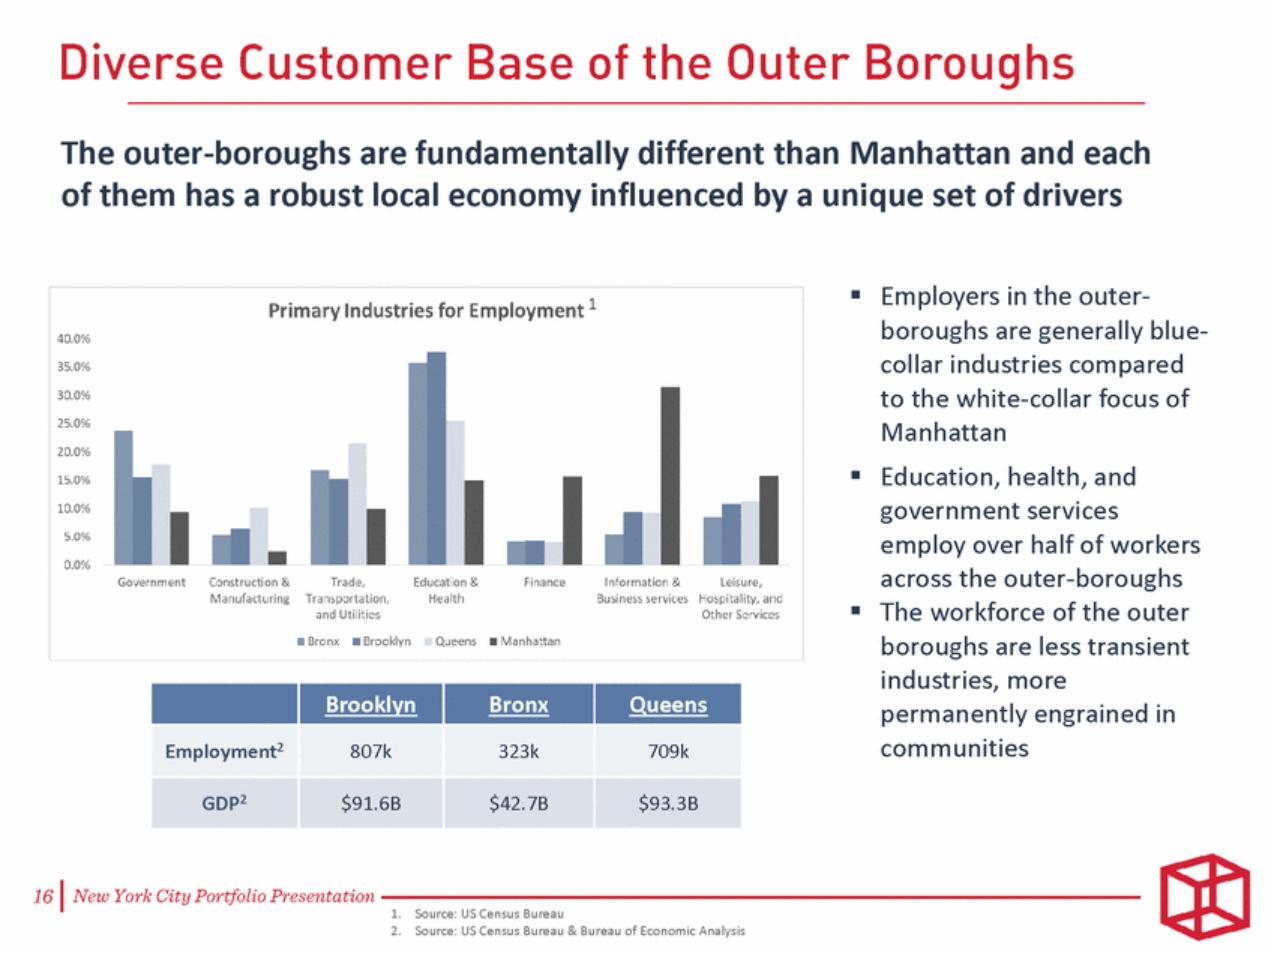
| The outer-boroughs are fundamentally different than Manhattan and each of them has a robust local economy influenced by a unique set of drivers ▪ Employers in the outer-boroughs are generally blue-collar industries compared to the white-collar focus of Manhattan Education, health, and government services employ over half of workers across the outer-boroughs The workforce of the outer boroughs are less transient industries, more permanently engrained in communities 1 ▪ ▪ 1. Source: US Census Bureau 2. Source: US Census Bureau & Bureau of Economic Analysis Brooklyn Bronx Queens Employment2 807k 323k 709k GDP2 $91.6B $42.7B $93.3B |
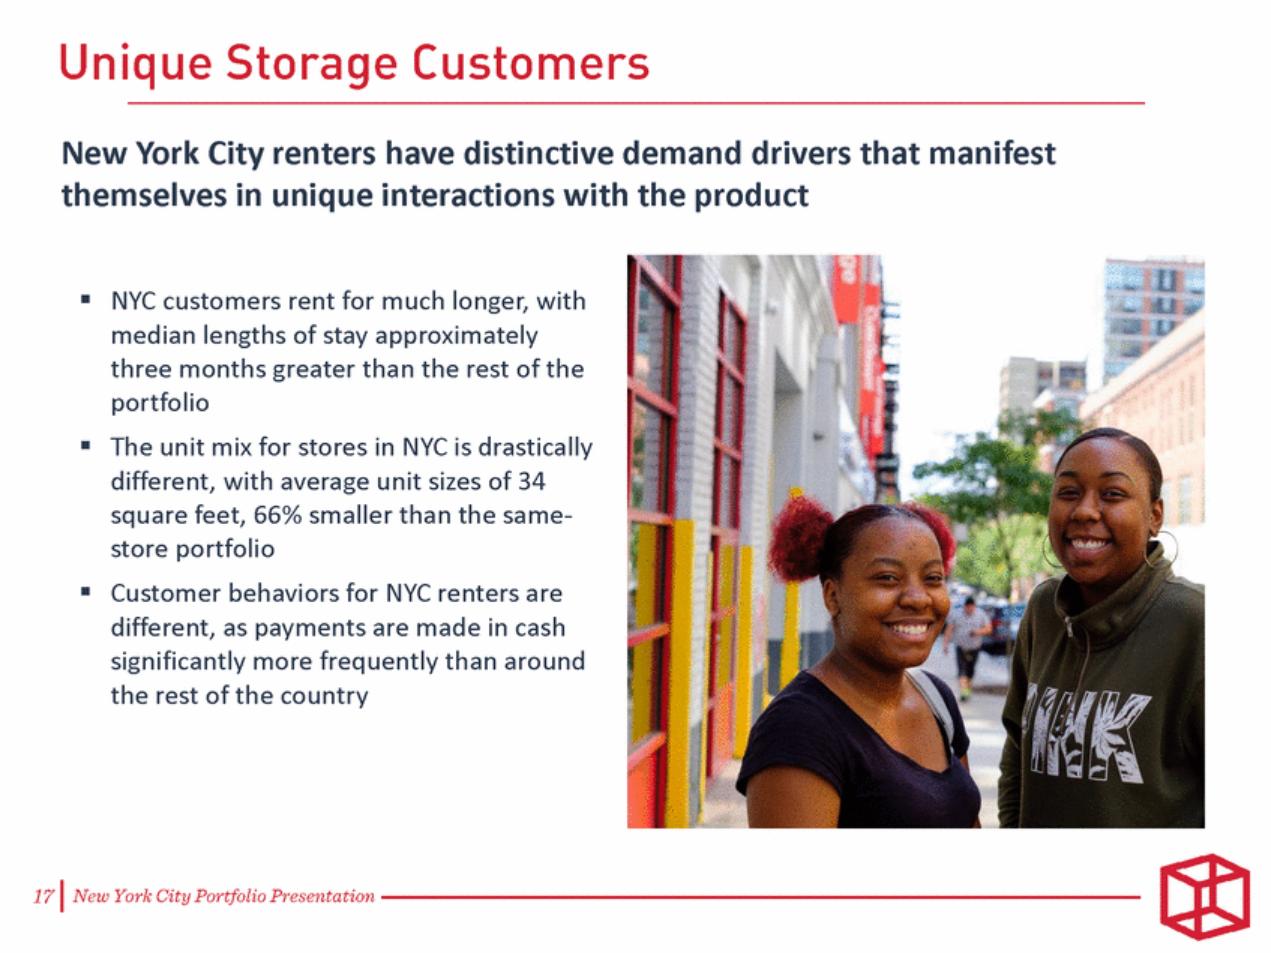
| New York City renters have distinctive demand drivers that manifest themselves in unique interactions with the product ▪ NYC customers rent for much longer, with median lengths of stay approximately three months greater than the rest of the portfolio The unit mix for stores in NYC is drastically different, with average unit sizes of 34 square feet, 66% smaller than the same-store portfolio Customer behaviors for NYC renters are different, as payments are made in cash significantly more frequently than around the rest of the country ▪ ▪ |
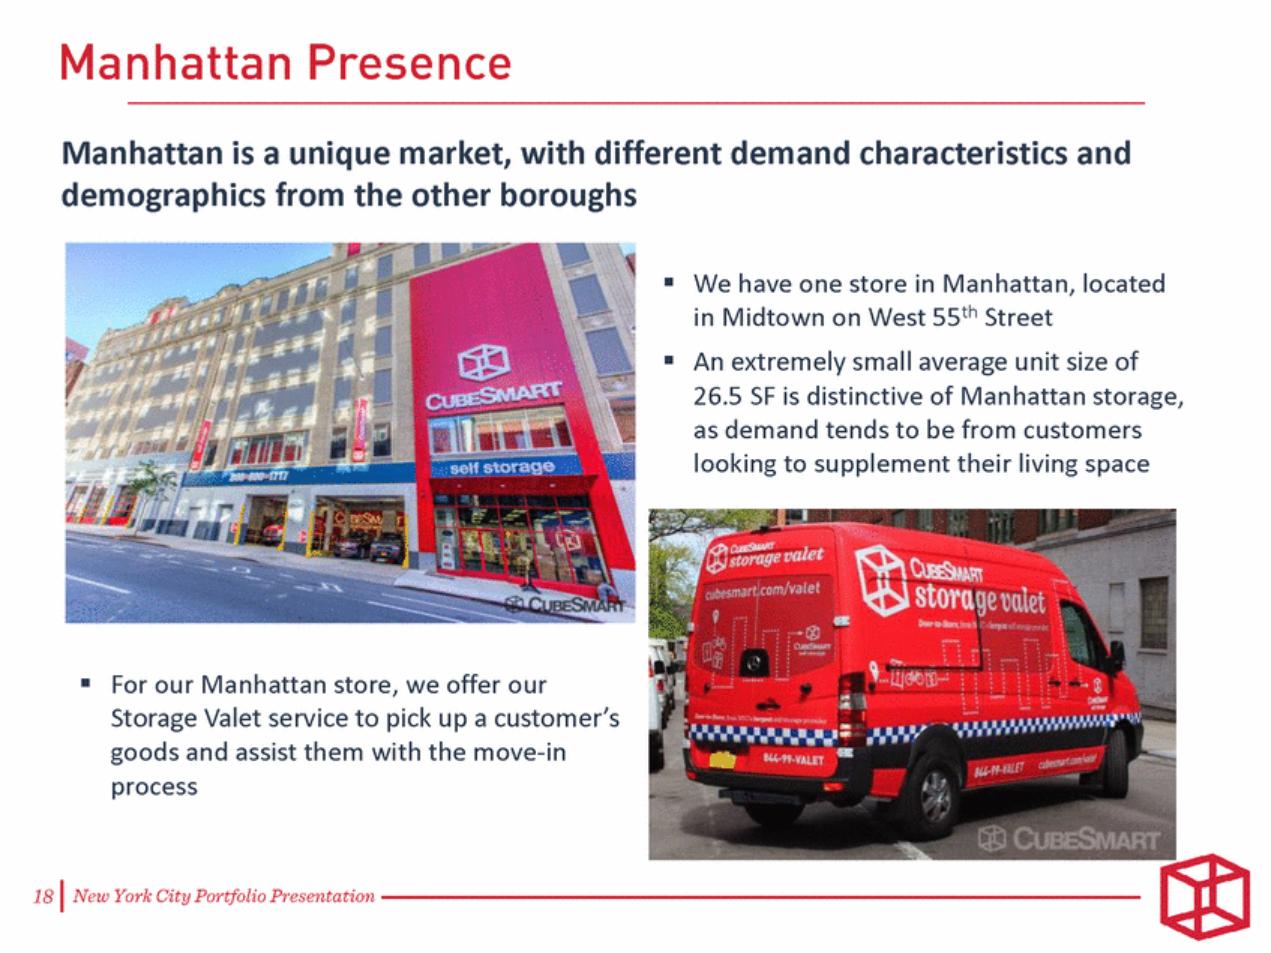
| Manhattan is a unique market, with different demand characteristics and demographics from the other boroughs ▪ We have one store in Manhattan, located in Midtown on West 55th Street An extremely small average unit size of 26.5 SF is distinctive of Manhattan storage, as demand tends to be from customers looking to supplement their living space ▪ ▪For our Manhattan store, we offer our Storage Valet service to pick up a customer’s goods and assist them with the move-in process |
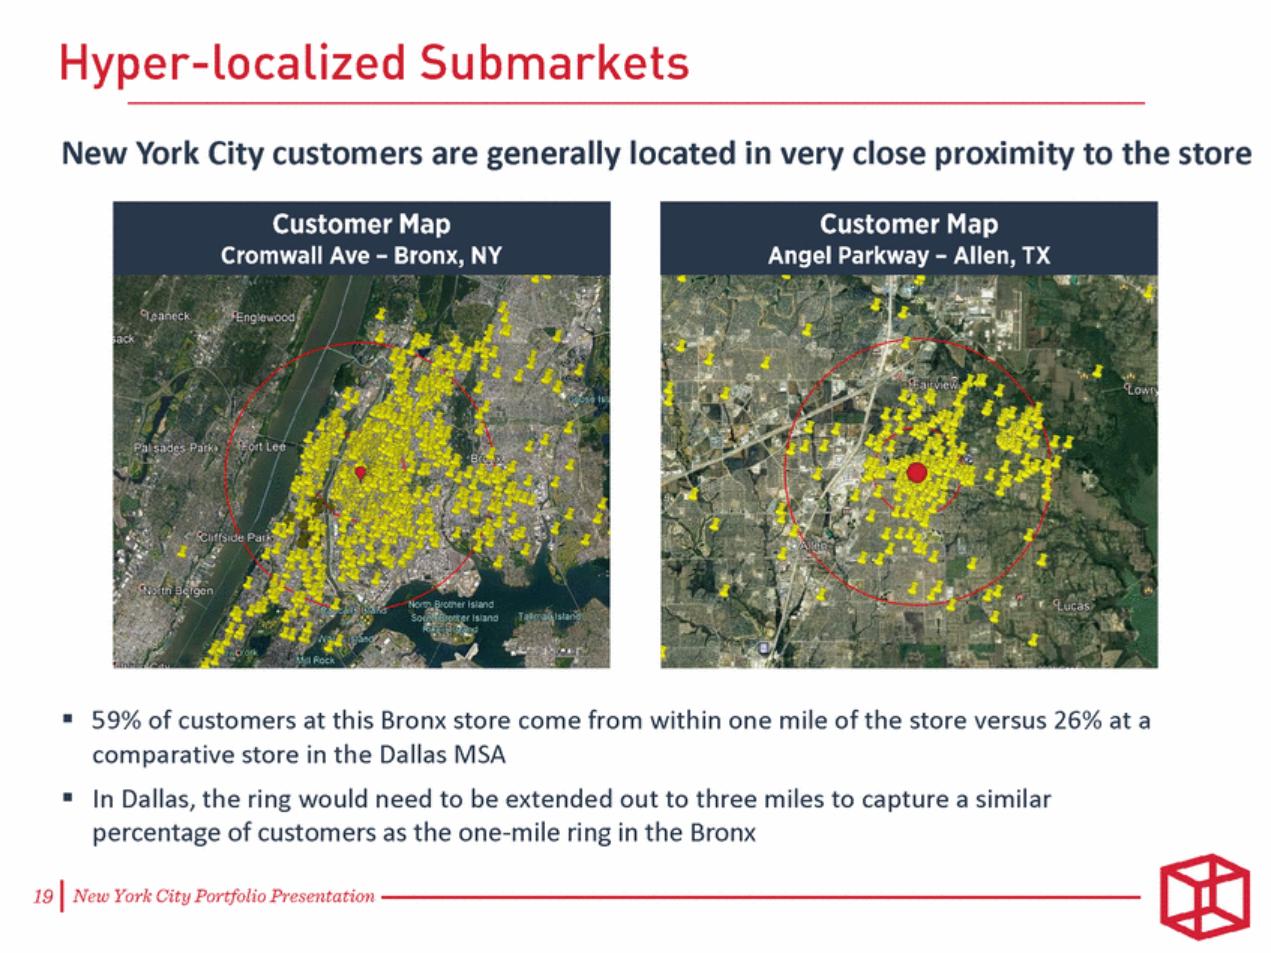
| New York City customers are generally located in very close proximity to the store ▪59% of customers at this Bronx store come from within one mile of the store versus 26% at a comparative store in the Dallas MSA ▪In Dallas, the ring would need to be extended out to three miles to capture a similar percentage of customers as the one-mile ring in the Bronx |
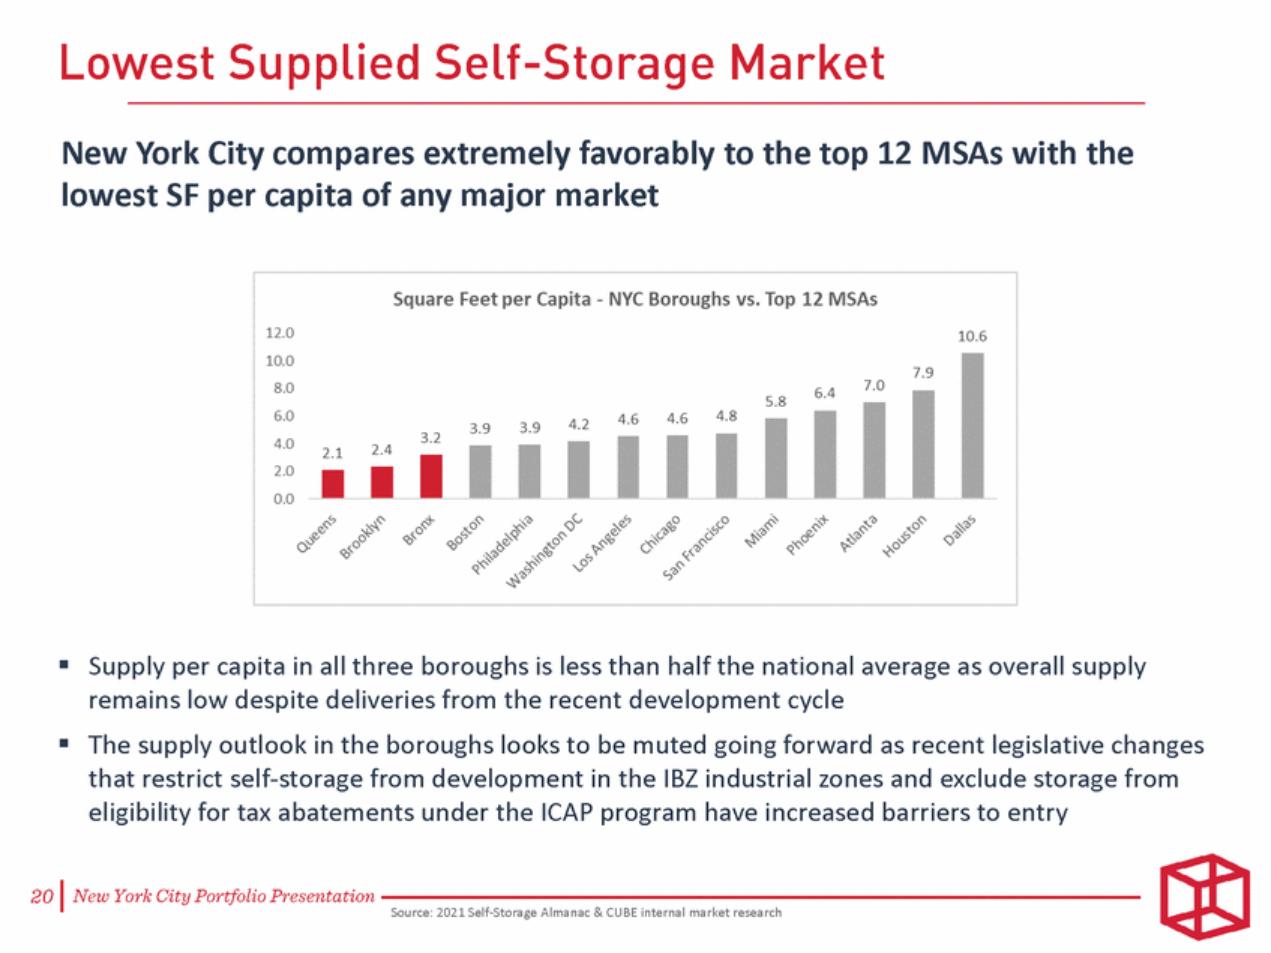
| New York City compares extremely favorably to the top 12 MSAs with the lowest SF per capita of any major market ▪Supply per capita in all three boroughs is less than half the national average as overall supply remains low despite deliveries from the recent development cycle ▪The supply outlook in the boroughs looks to be muted going forward as recent legislative changes that restrict self-storage from development in the IBZ industrial zones and exclude storage from eligibility for tax abatements under the ICAP program have increased barriers to entry Source: 2021 Self-Storage Almanac & CUBE internal market research |
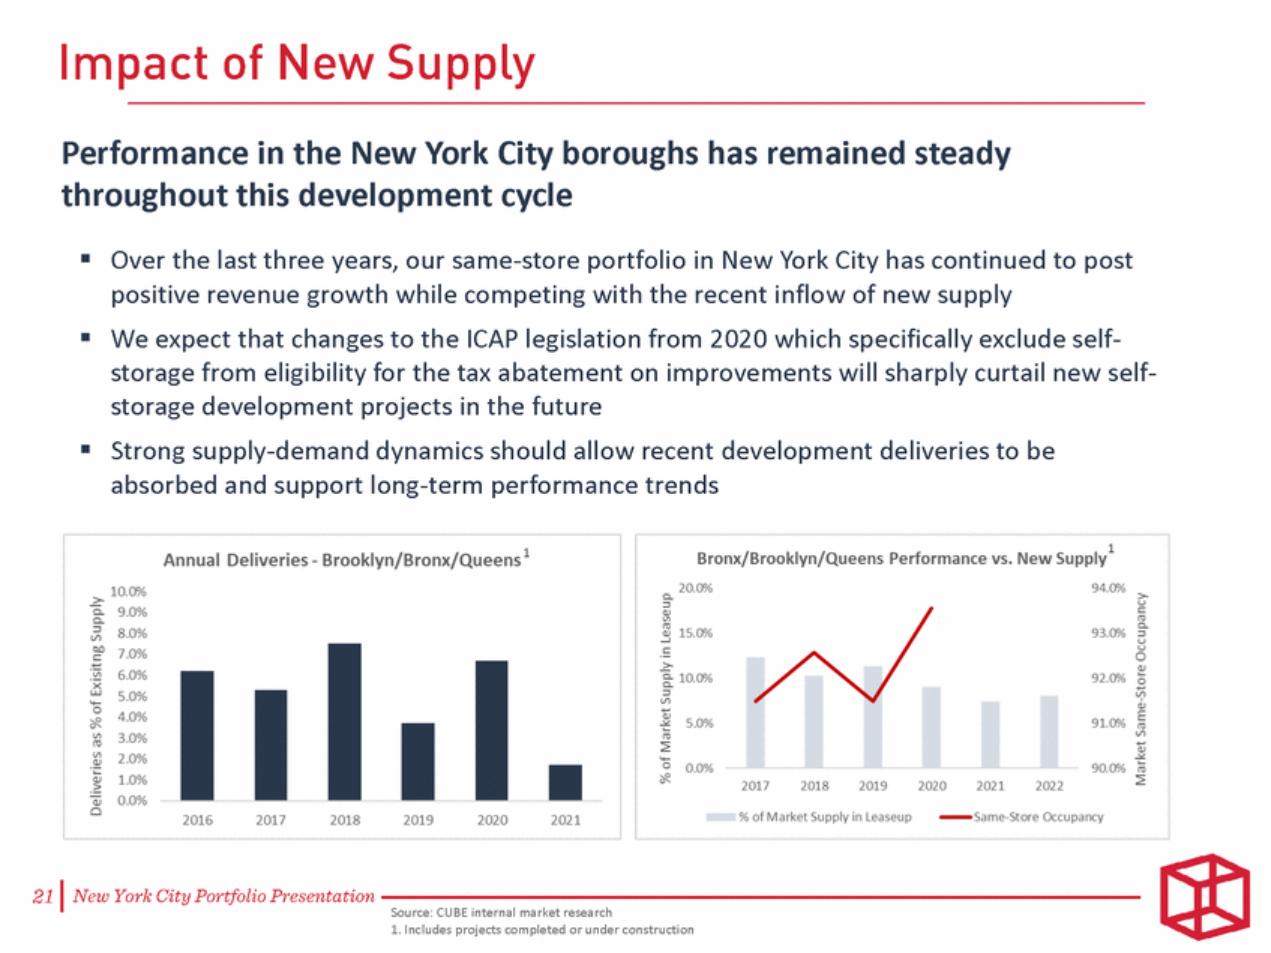
| Performance in the New York City boroughs has remained steady throughout this development cycle ▪ Over the last three years, our same-store portfolio in New York City has continued to post positive revenue growth while competing with the recent inflow of new supply We expect that changes to the ICAP legislation from 2020 which specifically exclude self-storage from eligibility for the tax abatement on improvements will sharply curtail new self-storage development projects in the future Strong supply-demand dynamics should allow recent development deliveries to be absorbed and support long-term performance trends ▪ ▪ 1 1 Source: CUBE internal market research 1. Includes projects completed or under construction |
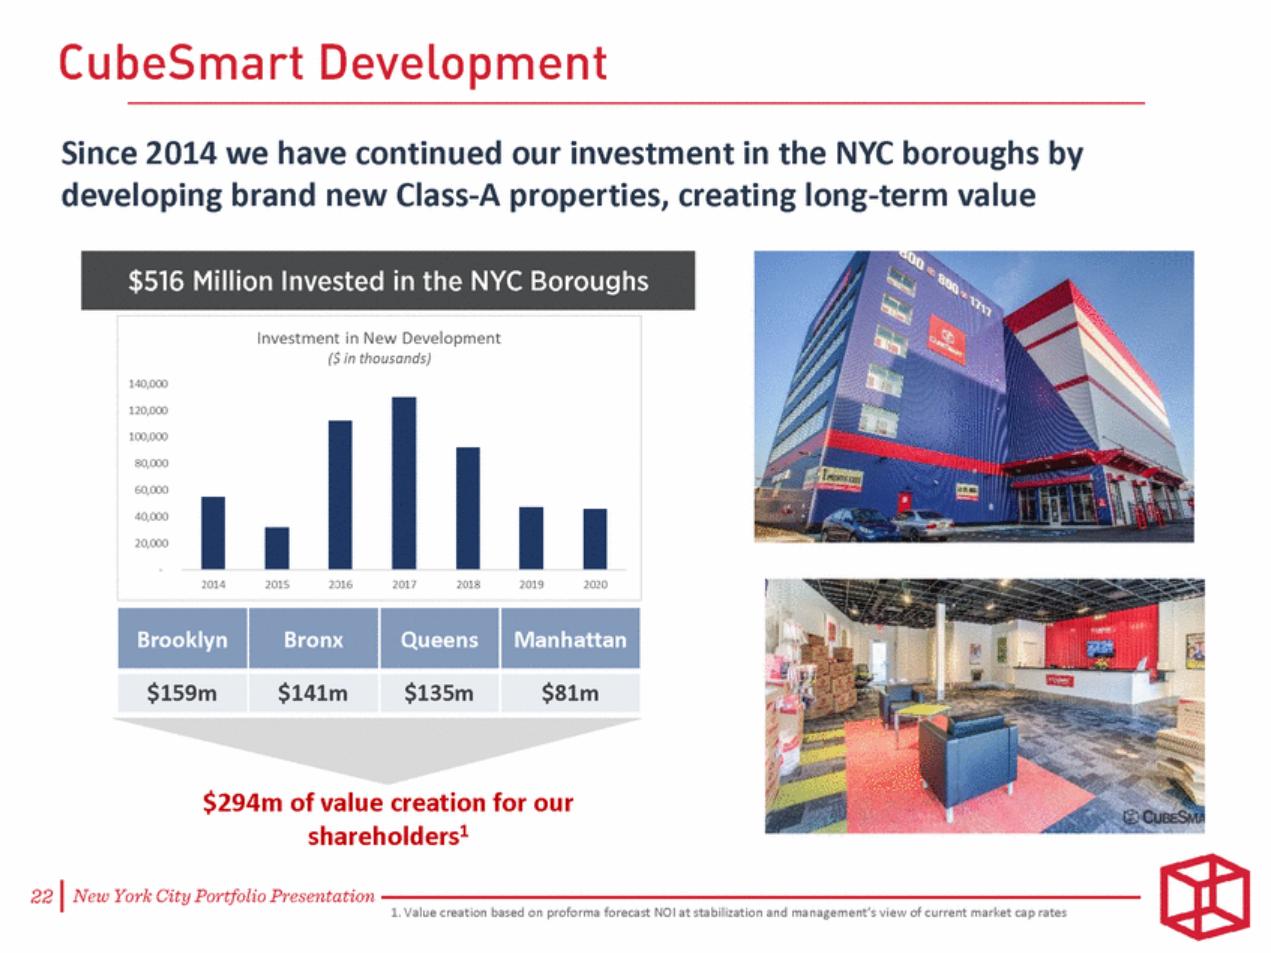
| Since 2014 we have continued our investment in the NYC boroughs by developing brand new Class-A properties, creating long-term value $294m of value creation for our shareholders1 1. Value creation based on proforma forecast NOI at stabilization and management’s view of current market cap rates Brooklyn Bronx Queens Manhattan $159m $141m $135m $81m |
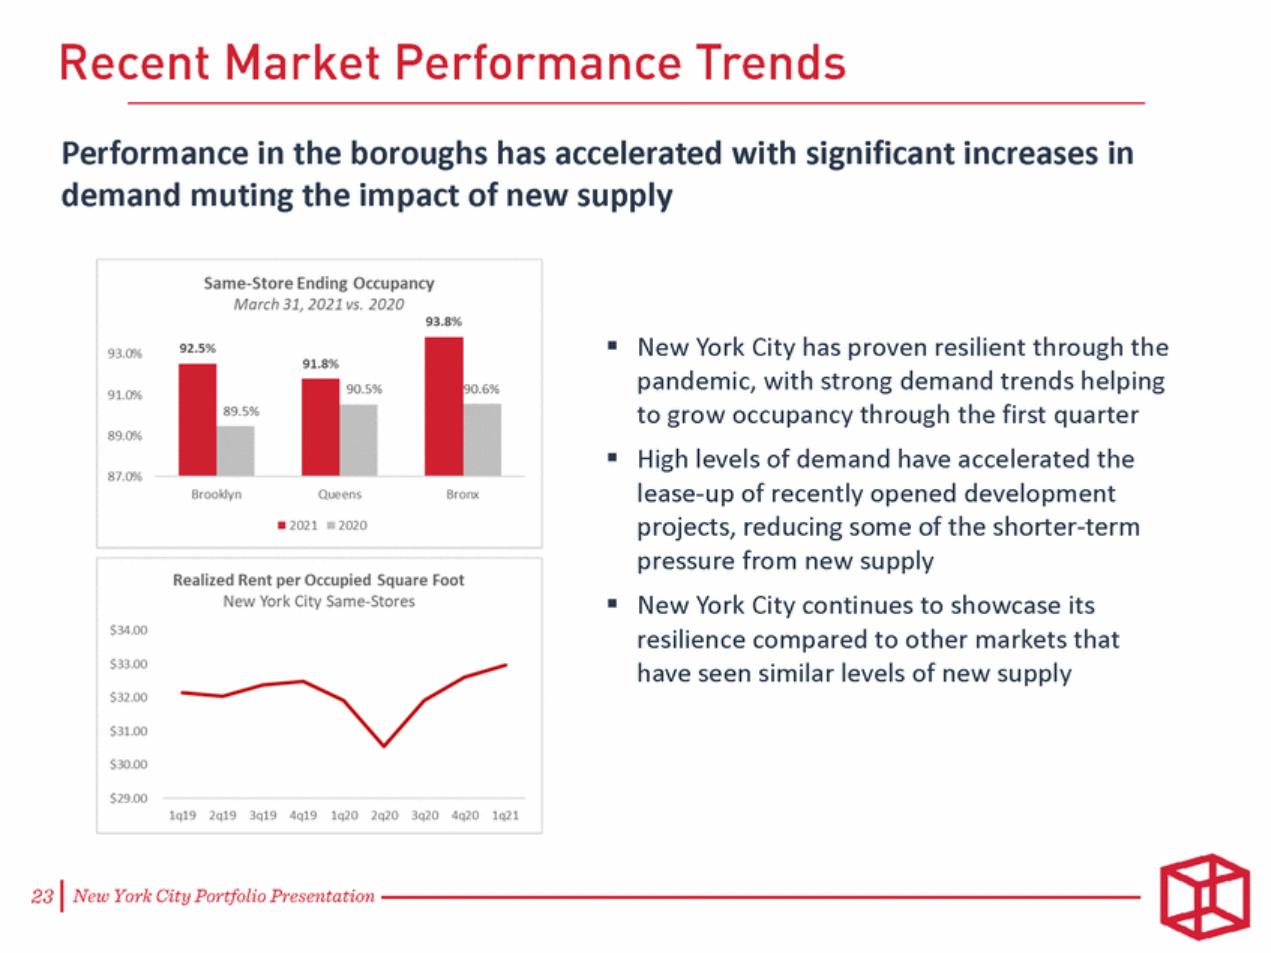
| Performance in the boroughs has accelerated with significant increases in demand muting the impact of new supply ▪ New York City has proven resilient through the pandemic, with strong demand trends helping to grow occupancy through the first quarter High levels of demand have accelerated the lease-up of recently opened development projects, reducing some of the shorter-term pressure from new supply New York City continues to showcase its resilience compared to other markets that have seen similar levels of new supply ▪ ▪ |
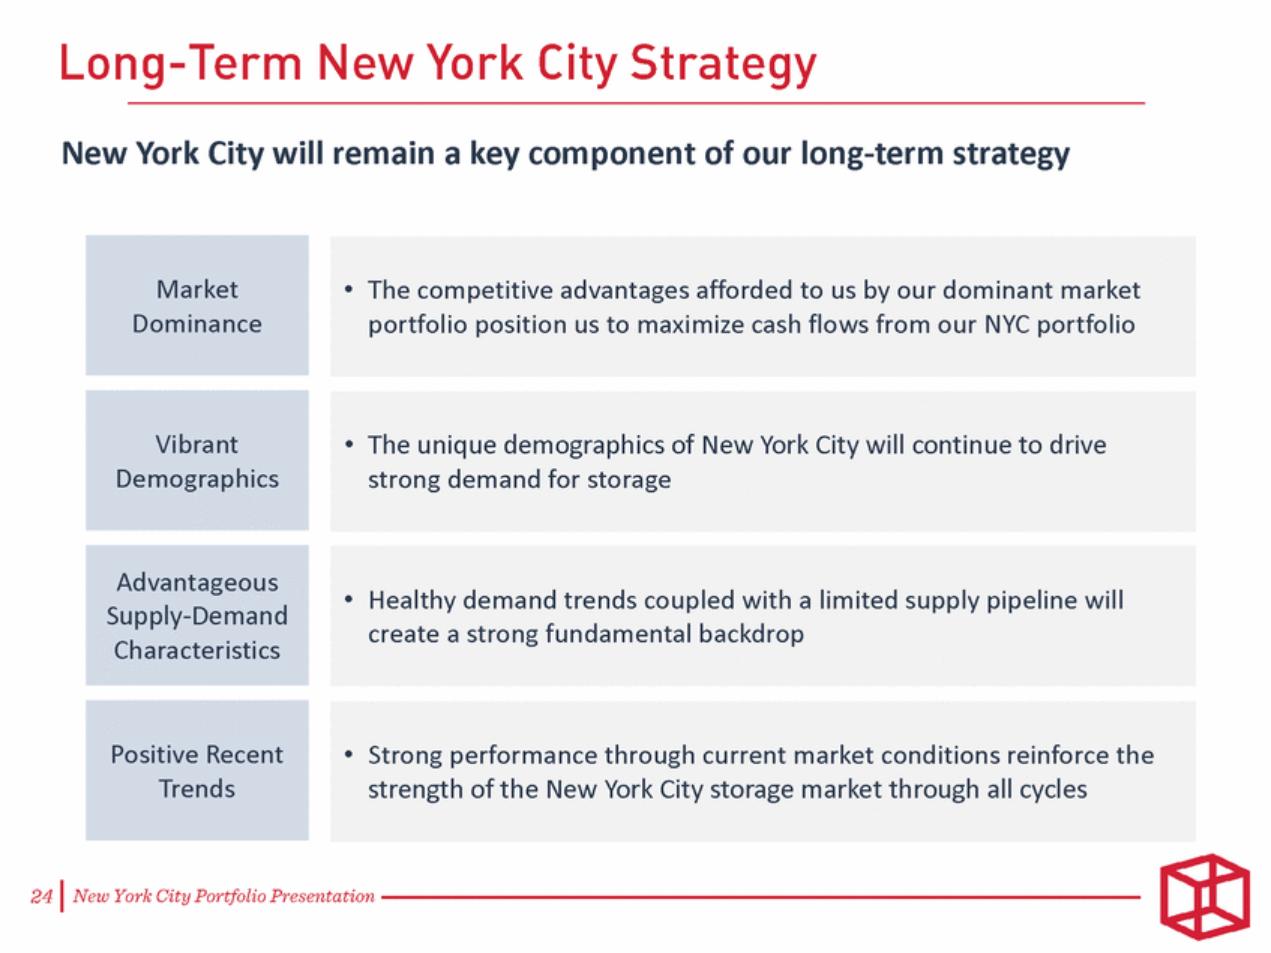
| New York City will remain a key component of our long-term strategy • Strong performance through current market conditions reinforce the strength of the New York City storage market through all cycles Positive Recent Trends • Healthy demand trends coupled with a limited supply pipeline will create a strong fundamental backdrop Advantageous Supply-Demand Characteristics • The unique demographics of New York City will continue to drive strong demand for storage Vibrant Demographics • The competitive advantages afforded to us by our dominant market portfolio position us to maximize cash flows from our NYC portfolio Market Dominance |