Attached files
| file | filename |
|---|---|
| 8-K - CONTEXTLOGIC INC. 8-K - ContextLogic Inc. | a52427776.htm |
| EX-99.1 - EXHIBIT 99.1 - ContextLogic Inc. | a52427776ex99_1.htm |
Exhibit 99.2

WISH Q1 2021SHAREHOLDER LETTER

Dear Shareholders,Wish started off 2021 strong, with Q1 results that exceeded our outlook for both
Revenue and Adjusted EBITDA1. Total revenue of $772 million increased 75 percent year over year, an acceleration from the prior quarter, driven by strong Marketplace and Logistics revenue growth. First quarter net loss was ($128) million, and
adjusted EBITDA1 loss was ($79) million, compared to net loss of ($66) million and adjusted EBITDA1 loss of ($51) million in Q1 2020. Adjusted EBITDA1 margin improved to (10.2) percent from (11.6) percent in Q1 2020 and (14.9) percent in Q4
2020.Core Marketplace revenue - which includes commission fees earned from the sale of products on our marketplace - grew 40 percent year over year, an acceleration from 24 percent year over year growth in Q4 2020. Revenue from ProductBoost
returned to year over year growth in Q1, as more merchants increased their advertising spend with us, following a pullback last year when the pandemic intensified. Revenue from our Logistics business hit an inflection point during the first
quarter, growing by more than 4x compared to the prior year.Demand on the Wish app is strong and our efforts to attract high lifetime value (LTV) users are gaining traction. Merchant adoption of Wish’s asset-light logistics program has been
growing and is contributing to a significantly improved customer experience, demonstrated by all-time low average delivery times and logistics-related refunds.In addition, we are launching innovative solutions for our users and merchants. We
are encouraged by the progress we are making on these new initiatives, including Wish Local expansion, as well as our efforts to diversify product selection, including growing categories such as high-frequency CPG items, electronics and
furniture. 1 Adjusted EBITDA is a non-GAAP financial measure that represents net income (loss) adjusted to exclude: interest and other income (expense), net (which includes foreign exchange gain or loss, foreign exchange forward contracts
gain or loss; and gain or loss on one time non-operating transactions); provision or benefit for income taxes; depreciation and amortization; stock-based compensation expense and related payroll taxes; remeasurement of redeemable convertible
preferred stock warrant liability; and other items. LOGISTICS$245M338% YoY Growth TOTAL REVENUE$772M75% YoY Growth CORE MARKETPLACE$477M40% YoY Growth PRODUCTBOOST$50M14% YoY Growth NET LOSS $ (128) MillionADJ. EBITDA
$ (79) Million, (10.2)% Margin Q1 2021 HIGHLIGHTS OTHER FINANCIAL HIGHLIGHTS WISH Q1 2021 SHAREHOLDER LETTER 2

FIRST QUARTER 2021 RESULTS Core MarketplaceCore Marketplace revenue increased 40
percent year over year to $477 million in Q1, an acceleration from 24 percent year over year growth in Q4 2020, primarily due to better monetization and lower refunds, as well as lapping the initial impact of COVID-19 during Q1 2020. Our
efforts to target high LTV users resulted in Q1 Core Marketplace Revenue per Active Buyer increasing 76 percent yearover year. Core Marketplace revenue from Europe and North America increased by 48 percent year over year in both respective
markets. This growth was partially offset by a year over year decline in Core Marketplace revenue from South America, including markets where we have temporarily pulled back on advertising. $340 $405 $527 $477 Q1 2020 Core
Marketplace Revenue & YoY Growth$555 Q2 2020 Q3 2020 Q4 2020 Q1 2021 17% 67% -8% 24% 40% $159 $224 $181 $269 $235 Q1 2020 +48% YoY Q2 2020 Q3 2020 Q4 2020 Q1 2021 Europe Core Marketplace Revenue by
Geography Q1 2020 +48% YoY Q2 2020 Q3 2020 Q4 2020 Q1 2021 North America $126 $264 $158 $187 $186 Rest of World Q1 2020 +19% YoY Q2 2020 Q3 2020 Q4 2020 Q1 2021 $32 $43 $43 $51 $38 South America Q1
2020 WISH Q1 2021 SHAREHOLDER LETTER 3 -22% YoY Q2 2020 Q3 2020 Q4 2020 Q1 2021 $23 $24 $23 $20 $18

We remain focused on improving the Wish customer experience to drive retention. For 2021, our
priorities include creating a more personalized shopping experience, expanding our merchant network, and diversifying product selection to include more high frequency products, such as CPG items, as well as branded goods and bigger ticket
items.During Q1, we increased the number of CPG items listed for sale by 110 percent year over year, including many globally recognized brands. As we expand our CPG inventory, we believe we can materially increase customer order frequency. We
are working with partners, such as Landys Chemist and Vitabox, to diversify our CPG supply mix into new categories including over-the-counter medicines, pet food and supplements.We are also diversifying our merchant network through geographic
expansion outside of China. During Q1, the number of merchant partnerships outside of China increased by 351 percent year over year. Notably, we made significant progress with merchant partnerships in Japan and Korea, where we grew our
combined merchant network by 484 percent year over year. Japan and Korea are considered strong supply and manufacturer hubs. We have seen interest from users for unique products from Korea, including branded K-beauty, fashion and gadgets, as
well as electronics brands, hobbies and toys from Japan.By expanding into these markets, we are further diversifying Wish’s product selection with high-quality, affordable options that may not be available on other ecommerce platforms.In the
U.S., we grew merchants in our network by 188 percent year over year. One of our largest partners is Spreetail, which sells high-quality products at low prices and is based in Nebraska. Through our partnership with Spreetail, we are able to
sell and ship heavier products like furniture, a fast-growing category on Wish, that would have been too expensive to ship cross-border from China. “Wish is unlike any other marketplace. We truly value the partnership we have together,
as well as the robust customer data Wish can provide.”– Kelsey Hearnen,Chief Ecommerce Channels OfficerWe are also experimenting with category-specific ecommerce offerings to attract users that we may not already be reaching. During Q1, we
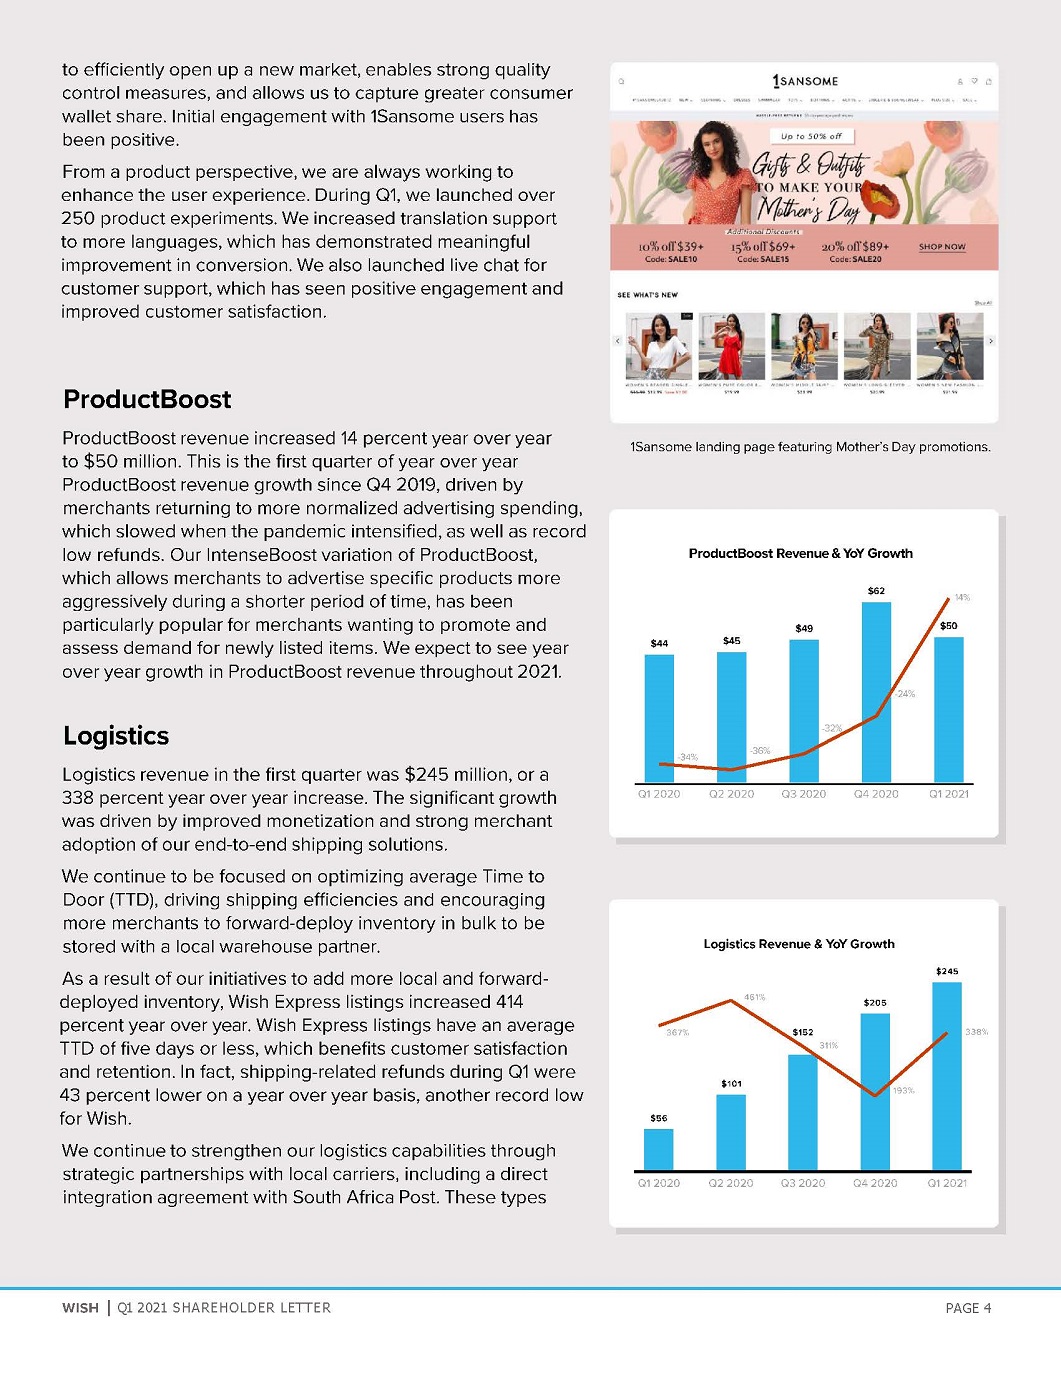
launched 1Sansome, which features fashion-forward women’s apparel. The shopping experience on 1Sansome is more search and filter driven, which differs from the discovery-based experience on the Wish app. The first-party inventory model allows
us Gadgets Accessories Hobbies Seller Since 2017FY 2020:98% Increase in GMV30% Increase in Orders 24% Increase in Unique Buyers 19% Increase in Impressions TOP CATEGORIES WISH Q1 2021 SHAREHOLDER LETTER 4
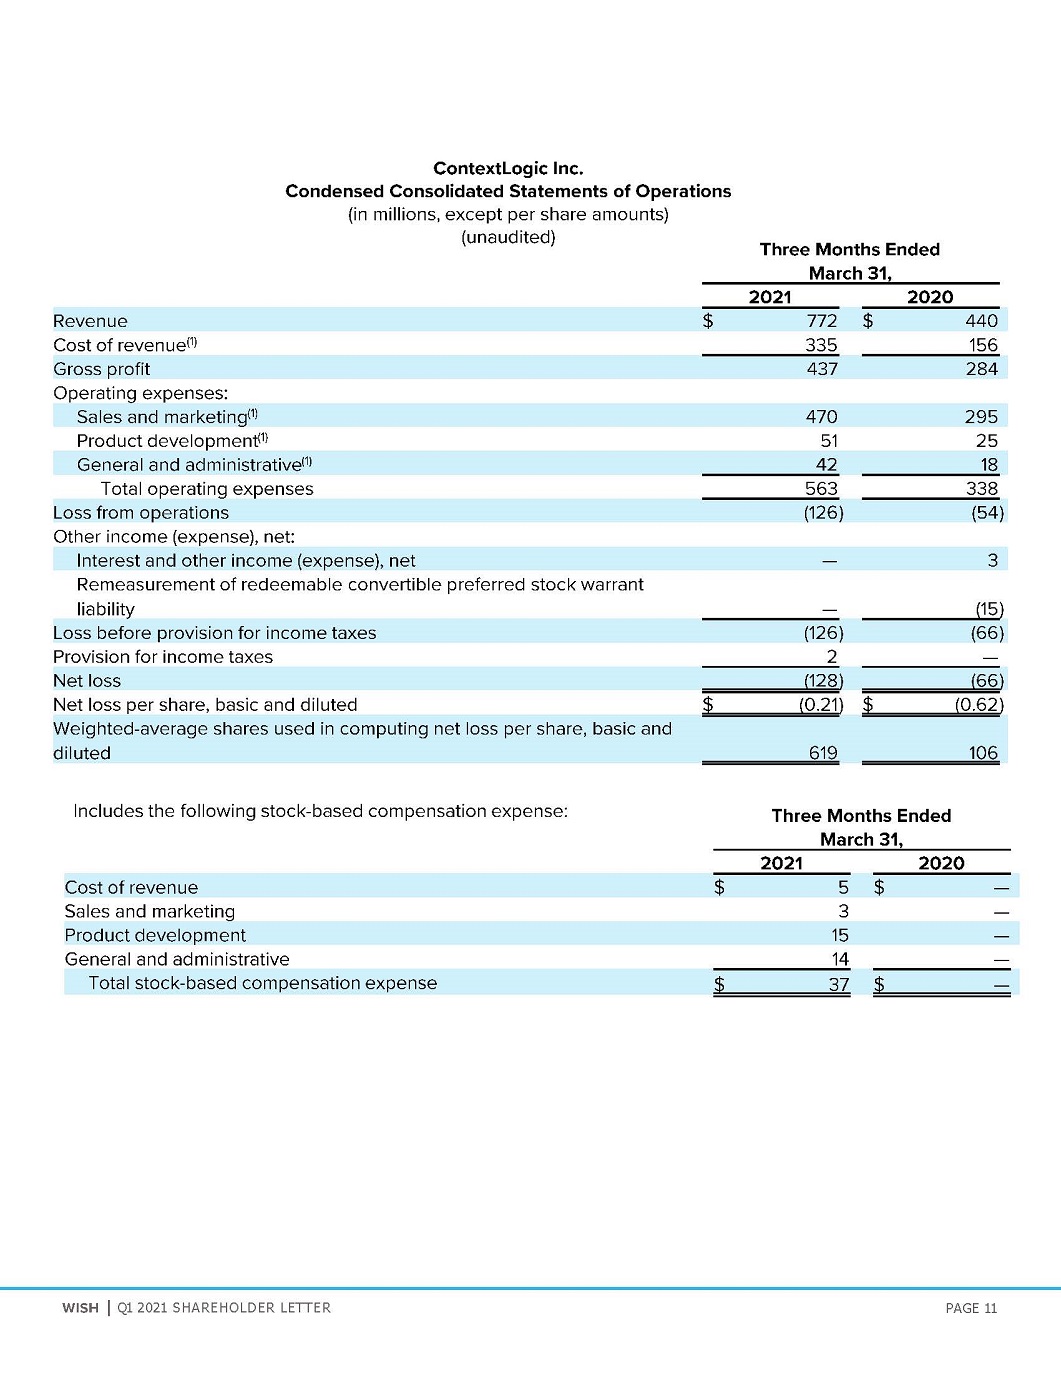
$56 $101 $205 $245 Q1 2020 Logistics Revenue & YoY Growth Q2 2020 Q3
2020 Q4 2020 Q1 2021 311% 461% 367% 193% 338% $152 $44 $45 $49 $62 $50 ProductBoost Revenue & YoY Growth Q1 2020 Q2 2020 Q3 2020 Q4 2020 Q1 2021 -32% WISH Q1 2021 SHAREHOLDER LETTER 5 -36% -34% -24% 14% to
efficiently open up a new market, enables strong quality control measures, and allows us to capture greater consumer wallet share. Initial engagement with 1Sansome users has been positive.From a product perspective, we are always working to
enhance the user experience. During Q1, we launched over 250 product experiments. We increased translation support to more languages, which has demonstrated meaningful improvement in conversion. We also launched live chat for customer
support, which has seen positive engagement and improved customer satisfaction. ProductBoostProductBoost revenue increased 14 percent year over year to $50 million. This is the first quarter of year over year ProductBoost revenue growth
since Q4 2019, driven bymerchants returning to more normalized advertising spending, which slowed when the pandemic intensified, as well as record low refunds. Our IntenseBoost variation of ProductBoost, which allows merchants to advertise
specific products more aggressively during a shorter period of time, has been particularly popular for merchants wanting to promote and assess demand for newly listed items. We expect to see year over year growth in ProductBoost revenue
throughout 2021. LogisticsLogistics revenue in the first quarter was $245 million, or a 338 percent year over year increase. The significant growth was driven by improved monetization and strong merchant adoption of our end-to-end
shipping solutions.We continue to be focused on optimizing average Time to Door (TTD), driving shipping efficiencies and encouraging more merchants to forward-deploy inventory in bulk to be stored with a local warehouse partner.As a result of
our initiatives to add more local and forward- deployed inventory, Wish Express listings increased 414 percent year over year. Wish Express listings have an average TTD of five days or less, which benefits customer satisfaction and retention.
In fact, shipping-related refunds during Q1 were 43 percent lower on a year over year basis, another record low for Wish.We continue to strengthen our logistics capabilities through strategic partnerships with local carriers, including a
direct integration agreement with South Africa Post. These types 1Sansome landing page featuring Mother’s Day promotions.

WISH EXPRESS SHIPPING of partnerships enable us to provide a more consistent and efficient
experience for users and, in turn, result in lower shipping-related refunds for merchants.Our logistics-as-a-service pilot is underway. We are working with a selection of independent e-tailers that do not currently sell products on Wish.
These merchants will leverage our logistics services, including shipping to Wish Local locations for in-store pickup, while benefiting from our efficient and data-driven shipping process and volume discounts. Wish LocalWish Local is becoming
a much more meaningful part of our business. In fact, orders shipped to Wish Local partners for in-person pickup accounted for 7.2 percent of total order volume in Q1 2021. In Mexico, Italy and Spain, Wish Local orders reached approximately
39 percent, 30 percent and 22 percent, respectively, of total order volume in thosemarkets, further demonstrating the importance of having a scaled network of partner locations to better serve value-conscious consumers. In March, we
experienced strong growth in orders shipped to Wish Local stores in regions that began to ease stay-at-home restrictions, including the UK, Germany and Netherlands.Our Wish Local network includes more than 53,000 brick-and-mortar stores
around the world. Initially, we were focused on rapidly scaling the network globally. With partners in approximately 50 countries, we are optimizing our acquisition strategy to focus our efforts on acquiring stores that support our strategic
initiatives. This includes stores that are located within close proximity to Wish users and those that sell CPG inventory.With a strong network of brick-and-mortar locations, Wish Local provides a strategic advantage for us in some markets.
For example, in Brazil,we added more than 1,000 Wish Local partners during Q1, allowing us to optimize shipping, provide affordable options for consumers, and ultimately generate favorable economics in that market. User MetricsWe continue to
strategically focus on acquiring and retaining high LTV users within the value-conscious consumer category.As a result, Q1 Core Marketplace Revenue per Active Buyer increased 76 percent year over year. In addition, the percentage of orders
with a transaction value above $20 increased by 54 percent year over year in Q1.In some emerging markets where we believe users have lower LTV, we temporarily decreased our advertising spend. Also, across all markets, we are de-emphasizing
low value items, which tend to have high conversion ratesbut unfavorable economics. As a result, total monthly active The orange truck indicates 3-5 day shipping Q1 2020 Q2 2020 Q3 2020 Q4 2020 Q1 2021 -22% 20% 38% 66% Core
Marketplace Revenue Per Active Buyer YoY Growth76% WISH Q1 2021 SHAREHOLDER LETTER 6

users, or MAUs2, declined 7 percent year over year to 101 million and LTM active buyers3 decreased
3 percent year over year to 61 million. We expect to re-engage users in some emerging markets once we have a more reliable logistics offering, which had been impacted by the effects of the pandemic, and a scaled Wish Local network. Retention
FlywheelWe have made great progress on our initiatives to improve user retention, including significantly enhancing the Wish customer experience and developing our own Logistics program. However, we strive to achieve even higher levels of
engagement and retention. During Q1, we implemented new initiatives to drive stronger user retention rates and increase order frequency. Ultimately, we believe that having a scaled Wish Local network and product category expansion will
support stronger user retention over time. With more consumable items that necessitate high purchasefrequency, including CPG items like paper towels, baby wipes, and hand soaps, we believe that we can become the everyday ecommerce platform
for the value-conscious consumer. With more Wish Local partners locatedin neighborhoods densely populated with value-conscious shoppers, we can provide an affordable option for users to purchase items on the Wish app that can be picked up in
a store nearby. Over time, we expect that Wish will win on convenience, location and price to drive repurchasing behavior with new and existing users.Cost & ExpensesAll of the measures that follow are non-GAAP for Q1 2021, as they exclude
stock-based compensation and related expenses. A reconciliation of GAAP to non-GAAP results is included below.Cost of revenue for the first quarter of 2021 was $329 million, an increase of 111 percent year over year. The majority of the
increase in cost of revenue was primarily due to costs related to higher volume of logistics services.Q1 gross profit was $443 million, up 56 percent from Q1 2020, higher than the 40 percent Core Marketplace revenue growth rate, which shows
our Logistics platform is becoming more efficient over time. Gross margin declined on a year over year basis to 57.4 percent of revenue due to a higher mix from logistics. As the logistics business begins toachieve economies of scale and
ProductBoost accelerates, we expect to drive steady gross margin expansion over time, with a long-term target of 70 to 75 percent of revenue.We continue to demonstrate significant operating leverage. First quarter sales and marketing expenses
of $466 million were 60 percent of revenue, down from 67 percent of revenue We define MAUs as the number of unique users that visited the Wish platform, either on the mobile app, mobile web, or on a desktop, during the month. As of the
last date of each reported period, the number of unique active buyers is determined by counting the total number of individual users who have placed at least one order on the Wish platform, either on the mobile app, mobile web, or on a
desktop, during the preceding 12 months. Enhanced User Experience Reliable Logistics Wish Local & Product Category Expansion Win on Price, Convenience, and Location Drive
Repurchasing Behavior Q1 2020 Q2 2020 Q3 2020 Q4 2020 Q1 2021 67% 63% 64% Sales & Marketing as a % of Revenue70% 60% WISH Q1 2021 SHAREHOLDER LETTER 7

In February, Wish partnered with influencers in the U.S. to participate in a Valentine’s Day cam-
paign, which helped drive traffic on the Wish app and brought consumer awareness of the Wish brand and our value proposition. TV and streaming ad: “It’s all on Wish”. WISH Q1 2021 SHAREHOLDER LETTER 8 TikTok stars Bryce Hall and Josh
Richards team up with Wish Local to promote their beverage,ANI Energy. in Q1 2020 and 70 percent of revenue in Q4 2020. Longer-term, we are targeting sales and marketing expenses to be 40 to 45 percent of revenue.During Q1, we began to
diversify our marketing strategy into a full-funnel approach to help grow awareness of our brand globally, while serving as a direct response marketing channel with low costs to drive new customer growth, improve conversion and retention with
existing users. This includes TV and streaming advertising, which delivered positive results in the U.S., Spain, Italy, France and Germany.We also are experimenting with influencer marketing. Social media has continued to disrupt traditional
advertising at an increasing rate. Videos shared online by influencers featuring products they ordered from Wish and promoting our brand provides a heightened level of authenticity and trust. We will continue to do more experimentation with
video and building relationships with influencers worldwide.First quarter Product Development expenses were $33 million, or 4 percent of revenue. Q1 2020 General & Administrative expenses were$26 million, or 3 percent of
revenue. EarningsFirst quarter net loss was ($128) million, and adjusted EBITDA1 loss was ($79) million, compared to net loss of ($66) million and adjusted EBITDA1 loss of ($51) million in Q1 2020. Our adjusted EBITDA1 loss for Q1 grew on a
year over year basis, primarily as a result of increased sales and marketing expenses, driven by higher digital advertising costs. However, adjusted EBITDA1 margin improved to (10.2) percent from (11.6) percent in Q1 2020 and (14.9) percent
in Q4 2020. Balance Sheet & Cash Flow SummaryWish ended Q1 with a solid cash position of $1.8 billion in cash, cash equivalents and marketable securities. Free cash flow4 was ($354) million, driven by timing of cash outflows due to
shorter merchant and vendor payable terms. During the pandemic, we negotiated a temporary extension of payment terms with key digital advertising partners. Those agreements expired at the start of 2021, resulting in shorter payment terms in
Q1. In addition, as merchant adoption grows for our logistics solutions, we have improved tracking and date delivery information,which results in faster payments to the merchant since we pay upon the customer receiving delivery. Lastly, Q1
sales are typically lower than Q4, putting more pressure on Free Cash Flow in the first quarter.As a reminder, our business is highly capital efficient. Our logistics platform was built with strategic third-party partnerships. Currently, we
do not plan to own warehouses or production facilities and we maintain a minimal amount of inventory. 4 Free Cash Flow is a non-GAAP financial measure that represents net cash provided by (used in) operating activities less purchases of
property and equipment.

We are confident that we are making the right strategic decisions to grow our business for the
long-term. Last year, the value-conscious consumer demographic was disproportionately affected by the pandemic. As the economy starts to recover, we believe macro trends will have a positive impact on our business. Unemployment is at its
lowest levels since the pandemic began and consumers are spending more as stimulus money, vaccinations and re-openings have spurred return to shopping, with the strongest growth coming from online.For the second quarter of 2021, we expect
revenues in the range of $715 to $730 million, or a 2 to 4 percent year over year increase, since we had such a strong Q2 2020. We expect the revenue mix between Marketplace and Logistics to be consistent with Q1 throughout 2021. In addition,
we expect Q2 adjusted EBITDA5 loss to be in the range of ($60) to ($55) million, or (8) to (7) percent of revenue. Longer term, we continue to target annual adjusted EBITDA5 margin in the range of 20 to 30 percent.We are cautiously optimistic
about the remainder of 2021. However, we continue to navigate uncertainty given the ongoing COVID-19 pandemic and other factors, including implementation of value added tax in Europe starting in July 2021, which could have an impact on our
results later this year.Going forward, we are focused on our five core priorities, including:Driving efficient customer acquisition, retention and monetization,Optimizing our logistics infrastructure,Scaling Wish Local,Adding new product
categories, andOpening up our platform to make our services available to non-Wish merchants.I am so proud of the work our employees are doing at Wish to reimagine the future of ecommerce. To better address the large opportunities, we are
aggressively adding to Wish’s headcount, including key leadership roles. In order to strengthen our board leadership structure, we are separating the roles of chair and chief executive officer and have appointed veteran technology and finance
executive and current Wish board director Jackie Reses as Executive Chair. In this newly created role, Jackie will support the team in their efforts to scale the platform and drive strategic direction for the business, while serving as an
advisor to Wish’s leadership and as a liaison to the Wish Board of Directors.We believe the opportunity for Wish is massive and we could not be more excited about our future than we are today. We are committed to our mission and are focused
on continuing to enhance the customer experience, growing revenue, driving profitable growth and delivering long-term shareholder value.Sincerely,Piotr Szulczewski, Founder & CEORajat Bahri, CFO 5 Wish has not provided a quantitative
reconciliation of forecasted Adjusted EBITDA to forecasted GAAP net income (loss) for total Adjusted EBITDA or to forecasted GAAP income (loss) before income taxes for segment Adjusted EBITDA within this earnings release because the company
is unable, without making unreasonable efforts, to calculate certain reconciling items with confidence. These items include, but are not limited to: income taxes which are directly impacted by unpredictable fluctuations in the market price of
the company’s stock. OUTLOOK WISH Q1 2021 SHAREHOLDER LETTER 9

Conference Call and Webcast InformationWish will host a live conference call and webcast to discuss
the results today, Wednesday, May 12 at 2 p.m. PT / 5 p.m. ET. A link to the live webcast and a recorded replay of the conference call, will be made available on the company’s investor relations website at https://ir.wish.com. The live call
may also be accessed via telephoneat (833) 664-1138 toll-free domestically and at (470) 414-9349 internationally. Please reference conference ID: 4862975.Use of Non-GAAP Financial MeasuresWish provides Adjusted EBITDA, a non-GAAP financial
measure that represents net income (loss) before interest and other income (expense), net (which includes foreign exchange gain or loss, and gain or loss on one time transactions recognized), income tax expense, and depreciation and
amortization, adjusted to eliminate stock-based compensation expense and remeasurement of redeemable convertible preferred stock warrant liability, and to add back certain recurring other items. Additionally, in these prepared remarks, we
provide Adjusted EBITDA Margin, a non-GAAP financial measure that represents Adjusted EBITDA divided by revenue. The reconciliation between historical GAAP and non-GAAP results of operations is provided in our earnings news release, which is
available on our investor relations website. Our management uses Adjusted EBITDA in conjunction with GAAP and other operating performance measures as part of its overall assessment of the company’s performance for planning purposes, including
the preparation of its annual operating budget, to evaluate the effectiveness of its business strategies and to communicate with its board of directors concerning its financial performance. Adjusted EBITDA should not be considered as an
alternative financial measure to net loss attributable to common stockholders, which is the most directly comparable financial measure calculated in accordance with GAAP, or any other measure of financial performance calculated in accordance
with GAAP.Wish also provides Free Cash Flow, a non-GAAP financial measure that represents net cash provided by (used in) operating activities less purchases of property and equipment. The reconciliation of Free Cash Flow to net cash provided
by (used in) operating activities, the most directly comparable financial measure calculated and presented in accordance with U.S. GAAP is provided below. Wish believes that Free Cash Flow provides investors with additional useful information
to measure operating liquidity because it reflects the amount of cash generated by the company’s operations after the purchasesof property and equipment. Free Cash Flow should not be considered as an alternative financial measure to net cash
provided by (used in) operating activities, which is the most directly comparable financial measure calculated in accordance with GAAP, or any other measure of financial performance calculated in accordance with GAAP.Forward-Looking
StatementsThis letter and related call contain forward-looking statements within the meaning of the Safe Harbor provisions of the Private Securities Litigation Reform Act of 1995. All statements other than statements of historical fact could
be deemed forward-looking, including, but not limited to, statements regarding Wish’s outlook, priorities, expectations of growth in ProductBoost revenue throughout 2021, expectations regarding the new Executive Chair role, improving customer
service, reducing delivery times and growth opportunities. In some cases, forward-looking statements can be identified by terms such as “anticipates,” “believes,” “could,” “estimates,” “expects,” “guidance,” “intends,” “may,” “outlook,”
“plans,” “potential,” “predicts,” “projects,” “seeks,” “should,” “will,” “would” or similar expressions and the negatives of those terms. These forward-looking statements are subject to risks, uncertainties, and assumptions. If the risks
materialize or assumptions prove incorrect, actual results could differ materially from the results implied by these forward-looking statements. Risks include, but are not limited to: our ability to attract, retain and monetize users; risks
associated with software updates to the platform; increasing requirements on collection of sales and value added taxes; compromises in security; changes by third-parties that restrict our access or ability to identify users; competition;
disruption, degradation or interference with the hosting services we use and infrastructure; our financial performance and fluctuations in operating results; pressure and fluctuation in our stock price, including as a result of the expiration
of the IPO lockup and short selling; challenges in our logistics programs; challenges in growing our Wish Local program and other new initiatives; the continued services of Piotr Szulczewskior other members of our senior management team; our
ability to offer and promote our app on the Apple App Store and the Google Play Store; our brand; legal matters; the COVID-19 pandemic; and economic tension between the United States and China. New risks emerge from time to time. It is not
possible for our management to predict all risks, nor can we assess the impact of all factors on our business or the extent to which any factor, or combination of factors, may cause actual results to differ materially from those contained in
any forward-looking statements we may make. Further information on these and additional risks that could affect Wish’s results is included in its filings with the Securities and Exchange Commission (“SEC”), including the Annual Report on Form
10-K filed with the SEC on March 25, 2021, and future reports that Wish may file with the SEC from time to time, which could cause actual results to vary from expectations. Any forward-looking statements made by Wish in this Shareholder
Letter are as of today, May 12. Wish assumes no obligation to, and does not currently intend to, update any such forward-looking statements.The unaudited financial results set forth in this Shareholder Letter are estimates based on
information currently available to Wish. While Wish believes these estimates are meaningful, they could differ from the actual amounts that the company ultimately reports in its Quarterly Report on Form 10-Q for the quarter ended March 31,
2021. Wish assumes no obligation and does not intend to update these estimates prior to filing its Quarterly Report on Form 10-Q for the quarter ended March 31, 2021.A Note About MetricsThe numbers for some of our metrics, including MAUs, are
calculated and tracked with internal tools, which are not independently verified by any third party. We use these metrics to assess the growth and health of our overall business. While these numbers are based on what we believe to be
reasonable estimates of our user or merchant base for the applicable period of measurement, there are inherent challenges in measurement as the methodologies used require significant judgment and may be susceptible to algorithm or other
technical errors. In addition, we regularly review and adjust our processes for calculating metrics to improve their accuracy, and our estimates may change due to improvements or changes in technology or our methodology. WISH Q1 2021
SHAREHOLDER LETTER 10

WISH Q1 2021 SHAREHOLDER LETTER 11 As of March 31, As of December 31,
2021 2020 Assets Current assets: Cash and cash equivalents $ 1,620 $ 1,965 Marketable securities 154 164 Funds receivable 65
83 Prepaid expenses and other current assets 88 102 Total current assets 1,927 2,314 Property and equipment, net 23 25 Right-of-use assets 39 43
Marketable securities — 4 Other assets 10 11 Total assets $ 1,999 $ 2,397 Liabilities and Stockholders’ Equity Current liabilities:
Accounts payable $ 291 $ 434 Merchants payable 381 454 Refunds liability 54 77 Accrued liabilities 309 367 Total current liabilities 1,035
1,332 Lease liabilities, non-current 34 38 Total liabilities 1,069 1,370 Stockholders’ equity 930 1,027 Total liabilities and stockholders’ equity $ 1,999
$ 2,397 ContextLogic Inc.Condensed Consolidated Balance Sheets(in millions)(unaudited)
WISH Q1 2021 SHAREHOLDER LETTER 12 Three Months Ended
March 31, 2021 2020 Revenue $ 772 $ 440 Cost of revenue(1) 335 156 Gross profit 437 284 Operating expenses: Sales and
marketing(1) 470 295 Product development(1) 51 25 General and administrative(1) 42 18 Total operating expenses 563 338 Loss from operations (126 )
(54 ) Other income (expense), net: Interest and other income (expense), net — 3 Remeasurement of redeemable convertible preferred stock warrant liability — (15 ) Loss
before provision for income taxes (126 ) (66 ) Provision for income taxes 2 — Net loss (128 ) (66 ) Net loss per share, basic and diluted $ (0.21 ) $ (0.62 ) Weighted-average
shares used in computing net loss per share, basic and diluted 619 106 Three Months Ended March 31, 2021 2020 Cost of revenue $ 5 $ — Sales and
marketing 3 — Product development 15 — General and administrative 14 — Total stock-based compensation expense $ 37 $ — ContextLogic Inc.Condensed Consolidated
Statements of Operations(in millions, except per share amounts)(unaudited) Includes the following stock-based compensation expense:

WISH Q1 2021 SHAREHOLDER LETTER 13 Three Months Ended
March 31, 2021 2020 Cash flows from operating activities: Net loss $ (128 ) $ (66 ) Adjustments to reconcile net loss to net cash used in operating activities:
Depreciation and amortization 2 2 Noncash lease expense 4 2 Stock-based compensation expense 37 — Remeasurement of redeemable convertible preferred stock warrant
liability — 15 Other (3 ) — Changes in operating assets and liabilities: Funds receivable 18 8 Prepaid expenses, other current and noncurrent assets
16 6 Accounts payable (143 ) 31 Merchants payable (73 ) (122 ) Accrued and refund liabilities (69 ) 3 Lease liabilities (4 ) (2 ) Other current and
noncurrent liabilities (11 ) (7 ) Net cash used in operating activities (354 ) (129 ) Cash flows from investing activities: Purchases of marketable securities (53 )
(73 ) Maturities of marketable securities 67 132 Net cash provided by investing activities 14 59 Cash flows from financing activities: Payment of taxes related to RSU
settlement and other financing activities, net (5 ) 1 Net cash provided by (used in) financing activities (5 ) 1 Net decrease in cash, cash equivalents and restricted cash (345 )
(69 ) Cash, cash equivalents and restricted cash at beginning of period 1,965 754 Cash, cash equivalents and restricted cash at end of period $ 1,620 $ 685 Reconciliation of cash, cash equivalents,
and restricted cash to the condensed consolidated balance sheets: Cash and cash equivalents $ 1,620 $ 675 Restricted cash included in other assets in the consolidated balance sheets —
10 Total cash, cash equivalents and restricted cash $ 1,620 $ 685 ContextLogic Inc.Condensed Consolidated Statements of Cash Flows(in millions)(unaudited)

WISH Q1 2021 SHAREHOLDER LETTER 14 Three Months Ended
March 31, 2021 2020 Revenue $ 772 $ 440 Net loss (128 ) (66 ) Net loss as a percentage of revenue (17 )% (15 )% Excluding:
Interest and other expense (income), net — (3 ) Provision for income taxes 2 — Depreciation and amortization 2 2 Stock-based compensation expense 37 —
Employer payroll taxes related to stock-based compensation expense 7 — Remeasurement of redeemable convertible preferred stock warrant liability — 15 Other items 1 1 Adjusted
EBITDA $ (79 ) $ (51 ) Adjusted EBITDA margin (10 )% (12 )% ContextLogic Inc.Reconciliation of GAAP Net Loss to Non-GAAP Adjusted EBITDA(in millions)(unaudited) Three Months Ended
March 31, 2021 2020 Cash used in operating activities $ (354 ) $ (129 ) Less: Purchases of property and equipment — — Free Cash Flow
$ (354 ) $ (129 ) ContextLogic Inc.Reconciliation of GAAP Net Cash Used In Operating Activities to Non-GAAP Free Cash Flow(in millions)(unaudited)

WISH Q1 2021 SHAREHOLDER LETTER 15 GAAP Non-GAAP
Adjustments Non-GAAP Q1'21 (1) (2) Q1'21 Revenue $ 772 $ — $ — $ 772 Cost of revenue 335 (5 ) (1 ) 329 Gross
profit 437 5 1 443 Operating expenses: Sales and marketing 470 (3 ) (1 ) 466 Product development 51
(15 ) (3 ) 33 General and administrative 42 (14 ) (2 ) 26 Total operating expenses 563 (32 ) (6 ) 525 Loss from operations (126 )
37 7 (82 ) Loss before provision for income taxes (126 ) 37 7 (82 ) Provision for income taxes 2 — — 2 Net loss $ (128 ) $ 37
$ 7 $ (84 ) ContextLogic Inc.Reconciliation of GAAP Statement of Operations to Non-GAAP Statement of Operations(in millions)(unaudited) Stock-based compensationPayroll taxes related to stock-based compensation Non-GAAP
Statement of Operations Our presentation of non-GAAP Statement of Operations excludes the impact of stock-based compensation expense and related payroll taxes. This measure is not a key metric used by our management and board of directors to
measure operating performance or otherwise manage the business. However, we provide non-GAAP Statement of Operations as supplemental information to investors, as we believe the exclusion of stock-based compensation expense and related payroll
taxes facilitates investors’ operating performance comparisons on a period-to-period basis. You should not consider non-GAAP Statement of Operations in isolation or as a substitute for analysis of our results as reported under GAAP.