Attached files
| file | filename |
|---|---|
| 8-K - 8-K - Applovin Corp | d532849d8k.htm |
| EX-99.1 - EX-99.1 - Applovin Corp | d532849dex991.htm |
Exhibit 99.2

APPLOVIN
1Q 2021
Shareholder Lette
To Our
Shareholders:
Thank you for being an investor with us in AppLovin. As new partners, we are excited to share with you our plan of attack to create long-term shareholder value. To grow our revenue
and compound our cash flow, we are focused on expanding our powerful software platform and driving strong growth across our integrated tech and content businesses. We did just that during our first decade through exceptional execution, generating
outsized returns for the investors who believed in us. Our team is highly confident in our next decade of success given our tech DNA, our advantaged business model, and our proven ability to execute. We realize our business isn’t simple and our
integrated model is relatively new, so we will use this letter to describe some of the pieces in more detail and highlight how it all comes together.
We’re
also pleased to provide the results from our record 1Q21 and our guidance for fiscal year 2021. As you evaluate our results, we believe you will see the strength of our platform and why we’re excited about our path of growth for years to come.
For a quick snapshot of 1Q21, and comparison to 1Q20:
• Revenue grew to
$604 million, an increase of +132%, with an organic revenue growth rate of +89%1
• Net loss was $10.6 million in 1Q21 compared to net income of
$4.7 million in 1Q20
• Adjusted EBITDA grew to $131 million, an increase of +110%2
1 Organic growth represents revenue growth from existing Apps owned at the end of the prior period and newly developed Apps from existing Owned and Partner Studios owned at the end
of the prior period.
2 Adjusted EBITDA is a non-GAAP measure. Please see
“Non-GAAP Financial Measures” and the reconciliation from GAAP to non-GAAP measures in the Appendix.
AppLovin, Inc. / 1Q 2021 Letter to Shareholders
1
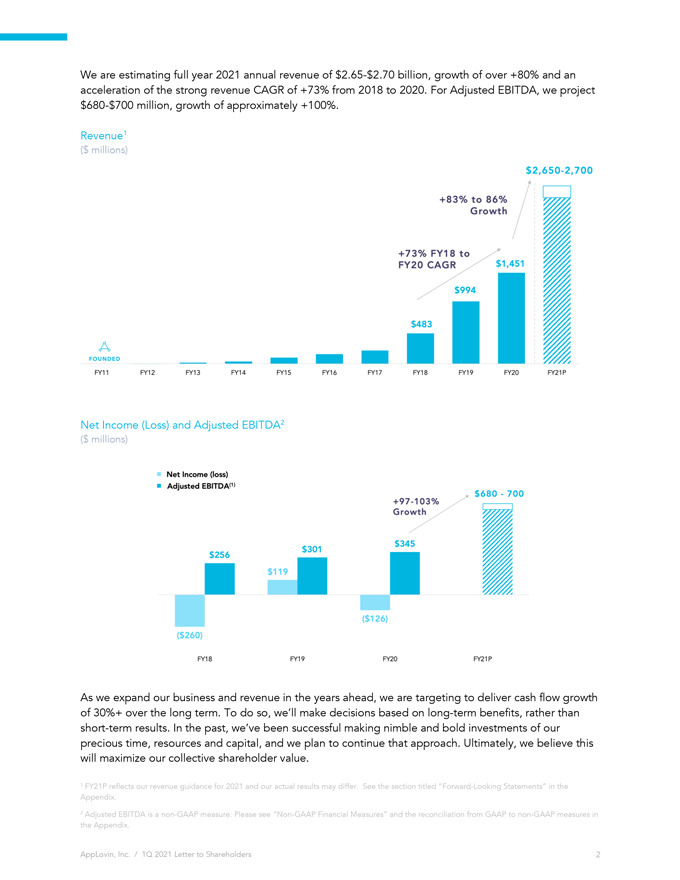
We are estimating full year 2021 annual revenue of $2.65-$2.70 billion, growth of over +80%
and an acceleration of the strong revenue CAGR of +73% from 2018 to 2020. For Adjusted EBITDA, we project $680-$700 million, growth of approximately +100%.
Revenue1
($ millions)
Net Income (Loss) and Adjusted EBITDA2
($ millions)
As we expand our business and revenue in the years ahead, we are targeting to deliver cash flow growth of 30%+ over the long term. To do so, we’ll make decisions based on
long-term benefits, rather than short-term results. In the past, we’ve been successful making nimble and bold investments of our precious time, resources and capital, and we plan to continue that approach. Ultimately, we believe this will
maximize our collective shareholder value.
1 FY21P reflects our revenue guidance for 2021 and our actual results may differ. See the section titled
“Forward-Looking Statements” in the Appendix.
2 Adjusted EBITDA is a non-GAAP measure. Please see “Non-GAAP Financial Measures” and the reconciliation from GAAP to non-GAAP measures in the Appendix.
AppLovin, Inc. / 1Q 2021 Letter to Shareholders
2
Integrated Business Model
At our core, we’re
a marketing software company that helps mobile app developers attract new users and grow their businesses. In the last year, the AppLovin software platform helped app developers find over three billion new customers. Central to what makes our
software powerful is our machine-learning engine, AXON, which processes over 6.5 trillion events per day and over 3 trillion machine-learning predictions per day,1 and continuously improves with more data. In early 2018 we started our own content
business that now generates substantial first-party data. Paired with AXON, the combination is a meaningfully differentiated engine for our software. We’ve always made money charging marketing software fees when clients pay us to advertise.
Today, we also make money when our content grows and consumers pay us or advertisers buy ad space in our games. On top of that, our financial scale and vertically integrated cost structure allows us to more effectively acquire new users.
Our integrated model is working well. As our content grows, so does our data advantage. In turn, our software improves, and we can drive more users to our content. All revenue
streams grow. (As you may recall, this is our strategic flywheel as discussed during our IPO.) Integrating our software, content, and data gives us strong competitive advantages in our enormous $180+ billion TAM, and gives us plenty of room to grow.
Objectives and Key Advantages for Growth
We have several management
objectives and key advantages to grow:
1. Grow software using our leading machine-learning software and large-scale data platform
2. Grow apps through a large portfolio of content studios using our differentiated marketing advantages, generating more first-party data; and
3. Drive strong revenue and cash flow growth given our attractive cost structure and operating leverage.
We’ll explain each of these in detail below.
#1: Grow Software
Software is in our DNA and is the core driver of our long-term differentiation. We have developed a top-tier set of user acquisition,
monetization, and attribution technologies. We run our global software platforms with lean but experienced teams and highly scalable infrastructure.
Our software
revenue grew at record rates in 1Q21 as our machine learning engine continues to improve as it accesses more first-party data. We had +90% year-over-year software revenue growth from third-party customers in 1Q21.
1 Figures reflect averages for January 2021.
AppLovin, Inc. / 1Q 2021 Letter to
Shareholders 3
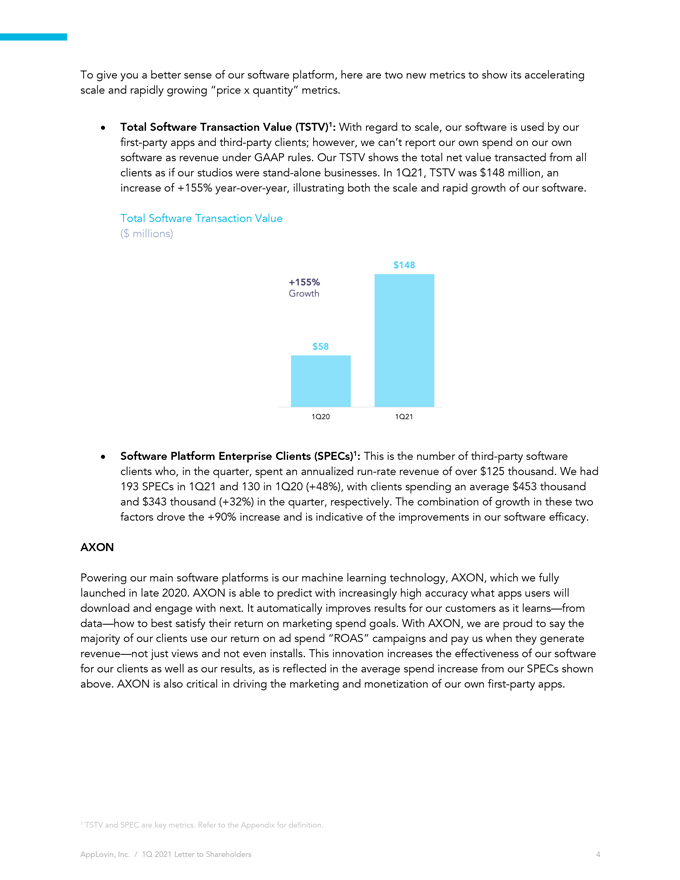
To give you a better sense of our software platform, here are two new metrics to show its accelerating scale and rapidly growing
“price x quantity” metrics.
Total Software Transaction Value (TSTV)1: With regard to scale, our software is used by our first-party apps and third-party
clients; however, we can’t report our own spend on our own software as revenue under GAAP rules. Our TSTV shows the total net value transacted from all clients as if our studios were stand-alone businesses. In 1Q21, TSTV was $148 million,
an increase of +155% year-over-year, illustrating both the scale and rapid growth of our software.
Total Software Transaction Value ($ millions)
Software Platform Enterprise Clients (SPECs)1: This is the number of third-party software clients who, in the quarter, spent an annualized
run-rate revenue of over $125 thousand. We had 193 SPECs in 1Q21 and 130 in 1Q20 (+48%), with clients spending an average $453 thousand and $343 thousand (+32%) in the quarter, respectively. The
combination of growth in these two factors drove the +90% increase and is indicative of the improvements in our software efficacy.
AXON
Powering our main software platforms is our machine learning technology, AXON, which we fully launched in late 2020. AXON is able to predict with increasingly high accuracy what
apps users will download and engage with next. It automatically improves results for our customers as it learns—from data—how to best satisfy their return on marketing spend goals. With AXON, we are proud to say the majority of our clients
use our return on ad spend “ROAS” campaigns and pay us when they generate revenue—not just views and not even installs. This innovation increases the effectiveness of our software for our clients as well as our results, as is
reflected in the average spend increase from our SPECs shown above. AXON is also critical in driving the marketing and monetization of our own first-party apps.
1
TSTV and SPEC are key metrics. Refer to the Appendix for definition.
AppLovin, Inc. / 1Q 2021 Letter to
Shareholders 4
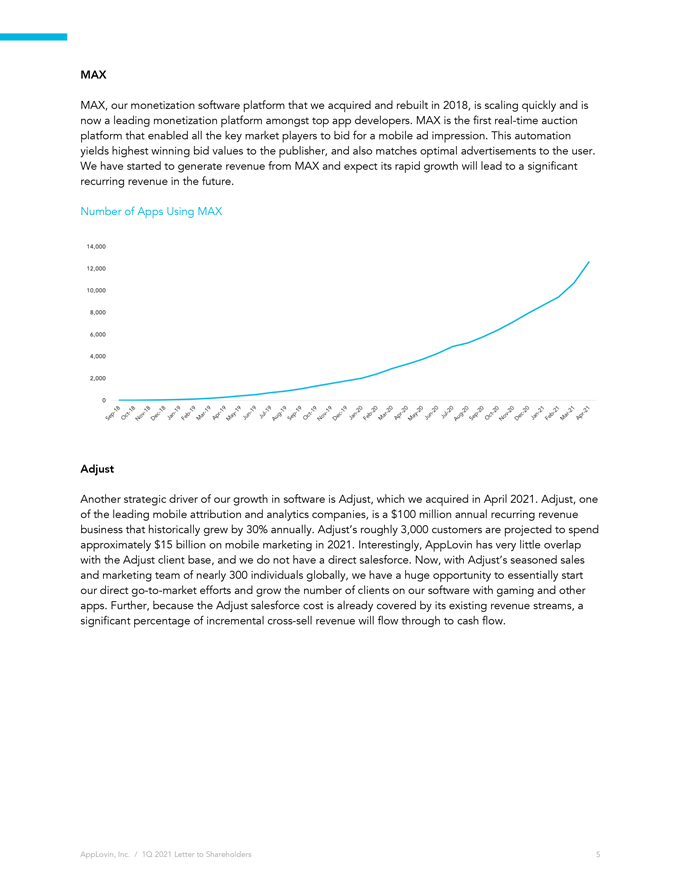
MAX
MAX, our monetization software platform that
we acquired and rebuilt in 2018, is scaling quickly and is now a leading monetization platform amongst top app developers. MAX is the first real-time auction platform that enabled all the key market players to bid for a mobile ad impression. This
automation yields highest winning bid values to the publisher, and also matches optimal advertisements to the user. We have started to generate revenue from MAX and expect its rapid growth will lead to a significant recurring revenue in the future.
Number of Apps Using MAX
Adjust
Another strategic driver of our growth in software is Adjust, which we acquired in April 2021. Adjust, one of the leading mobile attribution and analytics companies, is a
$100 million annual recurring revenue business that historically grew by 30% annually. Adjust’s roughly 3,000 customers are projected to spend approximately $15 billion on mobile marketing in 2021. Interestingly, AppLovin has very
little overlap with the Adjust client base, and we do not have a direct salesforce. Now, with Adjust’s seasoned sales and marketing team of nearly 300 individuals globally, we have a huge opportunity to essentially start our direct go-to-market efforts and grow the number of clients on our software with gaming and other apps. Further, because the Adjust salesforce cost is already covered by its existing
revenue streams, a significant percentage of incremental cross-sell revenue will flow through to cash flow.
AppLovin, Inc. / 1Q 2021 Letter to Shareholders
5
#2: Grow Apps
Since 2018, we’ve built a
high-growth, diversified portfolio of apps. Our combined Business Apps and our Consumer Apps include over 200 games and nearly 40 million DAU.1 We work with 14 studios around the globe that have a workforce of approximately 2,000. Today, our
apps are some of the world’s most popular mobile games including Project Makeover, Wordscapes, Matchington Mansion, Clockmaker, Bingo Story, and Final Fantasy XV: A New Empire. Based on our growth across both software and apps, we believe that
no other independent marketing software company better understands how to use first-party data to power a machine-learning driven approach to marketing software. By continuing to expand our diversified portfolio of apps, both through organic growth
with our partner studios and through highly accretive M&A, we will work to continue to scale the first-party data advantage. We have a strong and growing content business that generates valuable first-party data. With our marketing expertise,
scale, and other advantages described below, we’re able to grow our app portfolio revenue at high rates relative to the market.
Global Portfolio of Apps and
Studios Expansion
Building a successful global content-based business requires a large and diverse portfolio of titles and world-class studios—fortunately, we
have both. We invest significant R&D in a broad set of games that can grow and gain transactional data from a wide range of consumers. We use this stream of exclusive user behavioral data that can be used to improve our AXON-based software and
our ability to acquire new users.
We have a solid track record of growing the games we acquire, on average, achieving over 100% growth in the first year of
ownership.2 Through our pre-existing client relationships, we can identify and partner with companies where we can grow their content much faster than any of these studios could on their own.
We’re excited to announce that in April 2021, we closed on the purchase of two more top games: West Game and Cash Tornado Slots. Their combined annual revenue run-rate is nearly $200 million, and we invested $300 million upfront plus contingent payments based on a similar multiple on incremental revenue growth. West Game gives us a leading strategy game that
skews primarily towards male users. Cash Tornado Slots is the first slots game in our portfolio and allows us to target a middle-aged female audience. Based on our track record of success in growing apps, we are confident that we will do the same
for these titles in the coming quarters. We’re also pleased to be working with these studios to help grow more of their games in the future.
1 DAU: For the
three months ended March 31, 2021. We calculate this figure as the average number of unique device identities that open one of our apps on each day in a period. We use third-party attribution partners to measure this figure. An individual who
opens more than one app on a particular day will be counted as more than one user for this purpose.
2 Based on a comparison of unaudited revenue for acquired apps
in 2018 and 2019 for the three months prior to the acquisition against our revenue from such apps in the same period in the subsequent year.
AppLovin, Inc. / 1Q
2021 Letter to Shareholders
6
Marketing Scale and Integrated Model Advantages to Drive Growth
Growth of a mobile game typically depends on the level of marketing muscle put behind an app. Therefore, we want to invest as much as possible in new user acquisition and in the
most efficient manner. Here is where AppLovin has demonstrable competitive advantages.
Because of our integrated solution and additional cash flow from our
software business, we are able to invest a majority of our gaming revenue back into user acquisition, and in turn, should be able to grow our app revenue faster than others. Since we don’t pay to use our own marketing solutions, our significant
user acquisition spend is at a lower effective cost. In 2020, our Sales & Marketing costs were approximately $117 million lower as a result of this benefit.1 Also, we are mobile app marketing experts with our own marketing software
tools; therefore, we ensure we can get high returns on our ad spend.
In 2020, we estimate that we effectively spent nearly two times more on total sales and
marketing as a percent of revenue versus the industry average.1 This substantial difference in relative marketing spend should enable us to grow our first-party apps much faster than industry average.
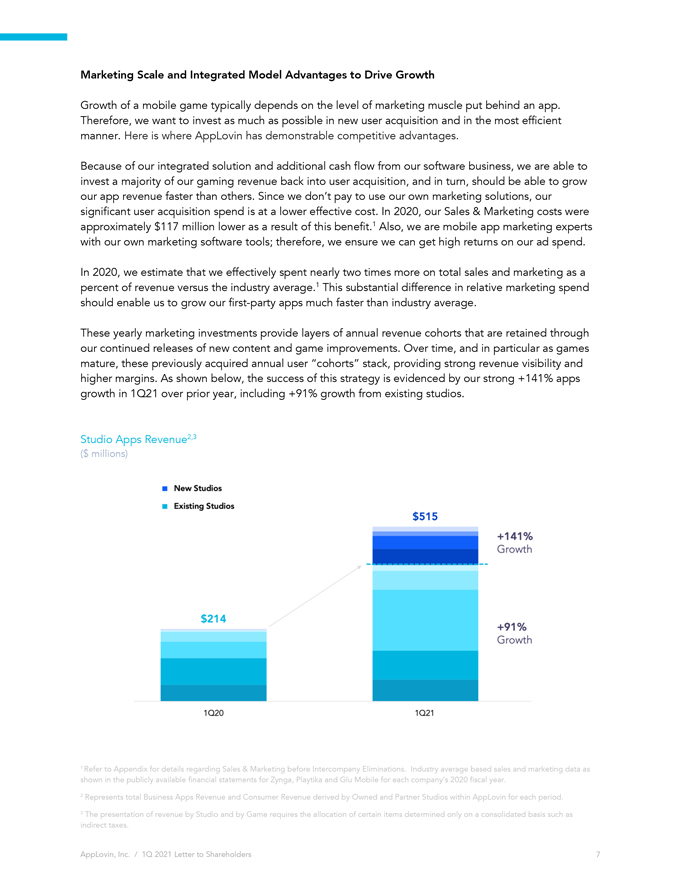
These yearly marketing investments provide layers of annual revenue cohorts that are retained through our continued releases of new content and game improvements. Over time, and in
particular as games mature, these previously acquired annual user “cohorts” stack, providing strong revenue visibility and higher margins. As shown below, the success of this strategy is evidenced by our strong +141% apps growth in 1Q21
over prior year, including +91% growth from existing studios.
Studio Apps Revenue2,3
($ millions)
1 Refer to Appendix for details regarding Sales & Marketing before
Intercompany Eliminations. Industry average based sales and marketing data as shown in the publicly available financial statements for Zynga, Playtika and Glu Mobile for each company’s 2020 fiscal year.
2 Represents total Business Apps Revenue and Consumer Revenue derived by Owned and Partner Studios within AppLovin for each period.
3 The presentation of revenue by Studio and by Game requires the allocation of certain items determined only on a consolidated basis such as indirect taxes.
AppLovin, Inc. / 1Q 2021 Letter to Shareholders
7
Data Privacy
We use first-party data to improve
the relevancy of our advertising solution, while being very conscious of our users’ privacy needs and operating in accordance with our privacy policy. Data privacy is complicated. In particular, given the iOS 14.5 changes, we wanted to share
our views on data privacy, as well as address the potential impact of iOS 14.5 on our business.
For our users, we have two goals: 1) provide great games that are
free to play; and 2) provide relevant advertising so consumers can discover more relevant apps. In our first-party apps, if users consent to share Personal Identifiable Information (PII) data (such as email, phone, location), we collect that and
other data, as described in our privacy policy, in order to improve in-app and social experiences. Behavioral data (number of levels, number and amount of IAPs, ad revenue, basic device stats) is anonymized
before it is shared with our software to improve the user acquisition algorithms. As stated in our privacy policy, we do not “sell” users’ data, whether PII or anonymized behavioral data, to third parties nor do we buy data from data
brokers. From the outset, we have designed and implemented measures intended to provide consumers with great games and relevant advertising in a privacy-aware way.
iOS 14.5 was released in late April, and we estimate as of today it has been adopted by 10% of iOS consumers. Because of our approach to privacy, we have not seen
a material impact on our business since the release of iOS 14.5 and based on our views today, expect to achieve our guidance provided in this letter.
#3: Strong
revenue and cash flow growth
We are focused on driving top-line growth, while leveraging our technology, infrastructure,
and a nimble team, to generate increasing cash flows over the long term. With our strong software growth, as well as app expansion, we expect to generate strong margins and growth, even after investing heavily in user acquisition.
AppLovin, Inc. / 1Q 2021 Letter to Shareholders
8
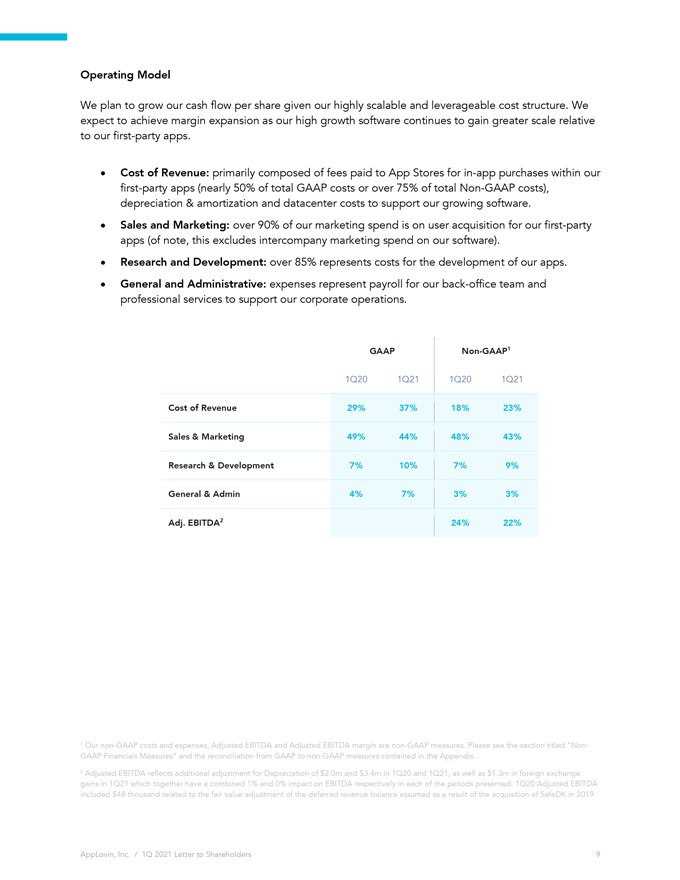
Operating Model
We plan to grow our cash flow per
share given our highly scalable and leverageable cost structure. We expect to achieve margin expansion as our high growth software continues to gain greater scale relative to our first-party apps.
Cost of Revenue: primarily composed of fees paid to App Stores for in-app purchases within our first-party apps (nearly 50% of total GAAP
costs or over 75% of total Non-GAAP costs), depreciation & amortization and datacenter costs to support our growing software.
Sales and Marketing: over 90% of our marketing spend is on user acquisition for our first-party apps (of note, this excludes intercompany marketing spend on our software).
Research and Development: over 85% represents costs for the development of our apps.
General and Administrative: expenses represent payroll for our back-office team and professional services to support our corporate operations.
1
GAAP Non-GAAP1
1Q20 1Q21 1Q20 1Q21
Cost of Revenue 29% 37% 18%
23%
Sales & Marketing 49% 44% 48% 43%
Research & Development 7% 10% 7% 9%
General & Admin 4% 7% 3% 3%
Adj.
EBITDA2 24% 22%
1 Our non-GAAP costs and expenses, Adjusted EBITDA and Adjusted EBITDA margin are non-GAAP measures. Please see the section titled “Non-GAAP Financials Measures” and the reconciliation from GAAP to non-GAAP
measures contained in the Appendix.
2 Adjusted EBITDA reflects additional adjustment for Depreciation of $2.0m and $3.4m in 1Q20 and 1Q21, as well as $1.3m in
foreign exchange gains in 1Q21 which together have a combined 1% and 0% impact on EBITDA respectively in each of the periods presented. 1Q20 Adjusted EBITDA included $48 thousand related to the fair value adjustment of the deferred revenue
balance assumed as a result of the acquisition of SafeDK in 2019
AppLovin, Inc. / 1Q 2021 Letter to Shareholders
9
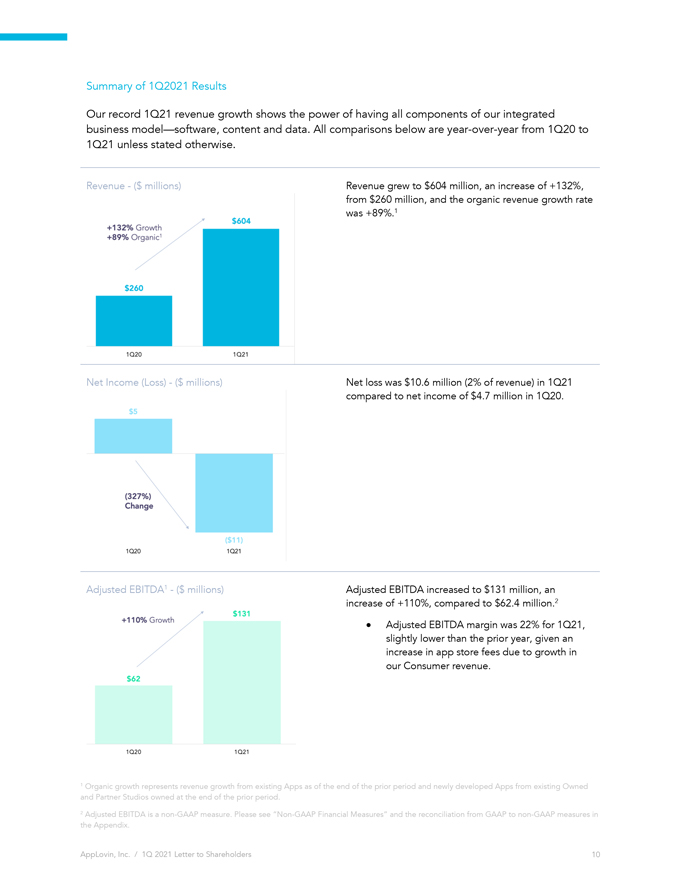
Summary of 1Q2021 Results
Our record 1Q21 revenue
growth shows the power of having all components of our integrated business model—software, content and data. All comparisons below are year-over-year from 1Q20 to 1Q21 unless stated otherwise.
Revenue—($ millions)
Revenue grew to $604 million, an increase of +132%, from
$260 million, and the organic revenue growth rate was +89%.1
Net Income (Loss)—($ millions)
Net loss was $10.6 million (2% of revenue) in 1Q21
compared to net income of
$4.7 million in 1Q20.
Adjusted EBITDA1—($ millions)
Adjusted EBITDA
increased to $131 million, an increase of +110%, compared to $62.4 million.2
• Adjusted EBITDA margin was 22% for 1Q21, slightly lower than the
prior year, given an increase in app store fees due to growth in our Consumer revenue.
1 Organic growth represents revenue growth from existing Apps as of the end
of the prior period and newly developed Apps from existing Owned and Partner Studios owned at the end of the prior period.
2 Adjusted EBITDA is a non-GAAP measure. Please see “Non-GAAP Financial Measures” and the reconciliation from GAAP to non-GAAP measures in the
Appendix.
AppLovin, Inc. / 1Q 2021 Letter to Shareholders
10
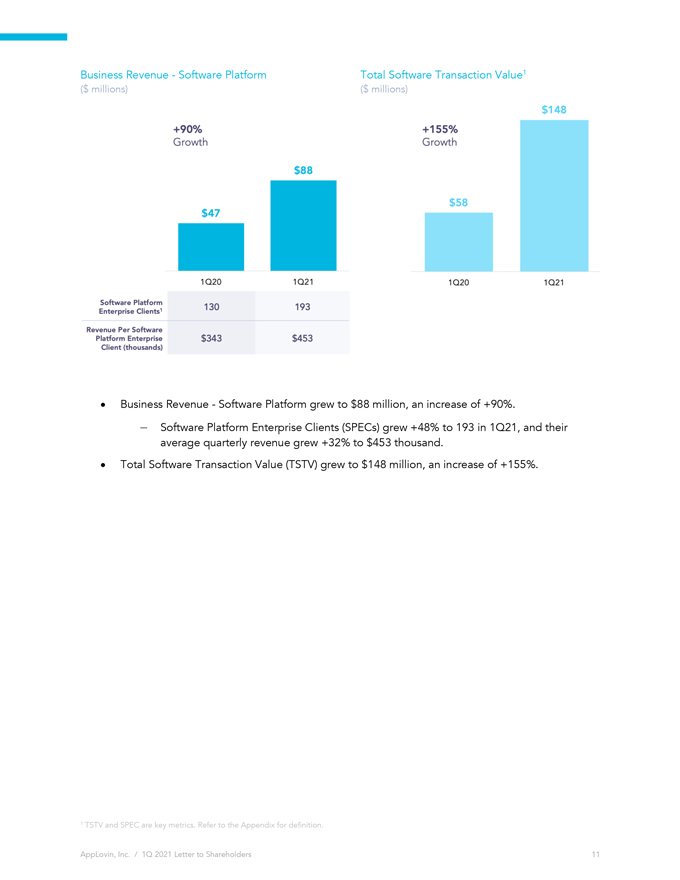
Business Revenue—Software Platform
($
millions)
Total Software Transaction Value1
($
millions)
Business Revenue—Software Platform grew to $88 million, an increase of +90%.
Software Platform Enterprise Clients (SPECs) grew +48% to 193 in 1Q21, and their average quarterly revenue grew +32% to $453 thousand.
Total Software Transaction Value (TSTV) grew to $148 million, an increase of +155%.
1
TSTV and SPEC are key metrics. Refer to the Appendix for definition.
AppLovin, Inc. / 1Q 2021 Letter to
Shareholders 11
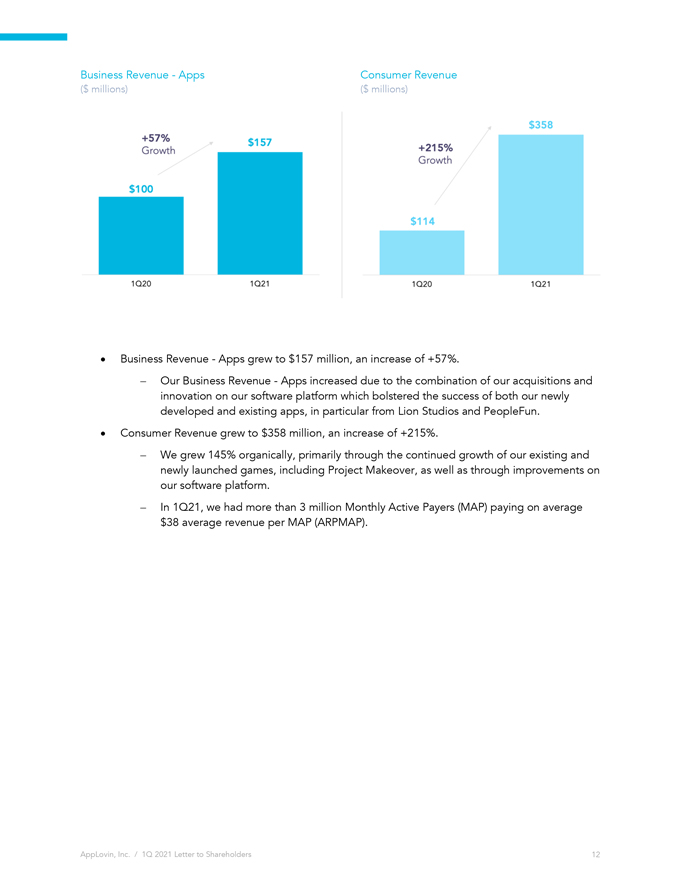
Business Revenue—Apps Consumer Revenue
($ millions) ($ millions)
Business Revenue—Apps grew to
$157 million, an increase of +57%.
Our Business Revenue—Apps increased due to the combination of our acquisitions and innovation on our software platform
which bolstered the success of both our newly developed and existing apps, in particular from Lion Studios and PeopleFun.
Consumer Revenue grew to
$358 million, an increase of +215%.
We grew 145% organically, primarily through the continued growth of our existing and newly launched games, including
Project Makeover, as well as through improvements on our software platform.
In 1Q21, we had more than 3 million Monthly Active Payers (MAP) paying on average
$38 average revenue per MAP (ARPMAP).
AppLovin, Inc. / 1Q 2021 Letter to Shareholders
12
Fiscal 2021 Outlook
Total Revenue of approximately
$2.65 to $2.7 billion, representing approximately +83% to +86% year-over-year growth.
Adjusted EBITDA of $680 to $700 million, representing approximately
+97% to +103% year- over-year growth.1
Our outlook for continued robust growth stems from the success of our scaling platform technologies and access to data.
Based on what we see today, we do not anticipate a material impact on our business from changes in the status of the COVID-19 pandemic or from the recently rolled out Apple IDFA changes.
Conclusion
We’re proud of our first 10 years as a business and our first quarter as a
public company. Successfully executing against our strategy has led to over 70% annual compounded revenue growth since 2018, and our best quarter ever in 1Q21. Over the long term, we plan to increase our scale and have a target to deliver cash flow
growth of over 30%.
We look forward to continuing our success in mobile gaming apps and beyond, based on our data advantage for our software, and a marketing scale
and cost advantage for our content. The AppLovin team is confident in their abilities and fired up to attack this
once-in-a-career platform opportunity ahead.
Thank you for spending time reviewing this letter. We look forward to our partnership with you and are grateful for your support and encouragement.
Adam Foroughi, CEO
Herald Chen, President & CFO
1 We have not provided the forward-looking GAAP equivalent for our Adjusted EBITDA guidance due to the uncertainty regarding, and the potential variability of, certain reconciling
items such as stock-based compensation expense. Accordingly, a reconciliation of our Adjusted EBITDA guidance to the corresponding GAAP measure is not available without unreasonable effort. However, it is important to note that material changes to
reconciling items could have a significant effect on future GAAP results. We have provided a reconciliation of other GAAP to non-GAAP metrics in tables at the end of this letter.
AppLovin, Inc. / 1Q 2021 Letter to Shareholders
13
Appendix
This letter to shareholders contains
forward-looking statements within the meaning of Section 27A of the Securities Act of 1933 and Section 21E of the Securities Exchange Act of 1934. Forward-looking statements generally relate to future events or our future financial or
operating performance. In some cases, you can identify forward-looking statements because they contain words such as “may,” “will,” “should,” “expect,” “plan,” “anticipate,” “going
to,” “could,” “intend,” “target,” “project,” “contemplate,” “believe,” “estimate,” “predict,” “potential,” or “continue,” or the negative of
these words or other similar terms or expressions that concern our expectations, strategy, priorities, plans, or intentions. Forward-looking statements in this letter to shareholders include, but are not limited to, statements regarding our future
financial performance, including our expected financial results, guidance and long-term margin goals; our expectations regarding our revenue, enterprise clients, Adjusted EBITDA, and Adjusted EBITDA margin; our ability to achieve or maintain future
profitability; our expected synergies regarding our Software Platform and first-party apps; our ability to attract and retain SPECs and consumers of our Apps; our ability to successfully integrate Adjust and the expected benefits of the Adjust
acquisition; our expectations regarding the impact of iOS 14.5; our ability to manage risks associated with our business; and our expectations regarding our market opportunity. Our expectations and beliefs regarding these matters may not
materialize, and actual results in future periods are subject to risks and uncertainties, including changes in our plans or assumptions, that could cause actual results to differ materially from those projected. These risks include our inability to
forecast our business due to our limited operating history, fluctuations in our results of operations, the competitive mobile app ecosystem, our inability to adapt to emerging technologies and business models. The forward-looking statements
contained in this letter to shareholders are also subject to other risks and uncertainties, including those more fully described in our prospectus filed pursuant to Rule 424(b) under the Securities Act of 1933, as amended, on April 15, 2021.
Additional information will also be set forth in our Quarterly Report on Form 10-Q for the fiscal quarter ended March 31, 2021. The forward-looking statements in this letter to shareholders are based on
information available to us as of the date hereof, and we disclaim any obligation to update any forward-looking statements, except as required by law.
AppLovin,
Inc. / 1Q 2021 Letter to Shareholders
14
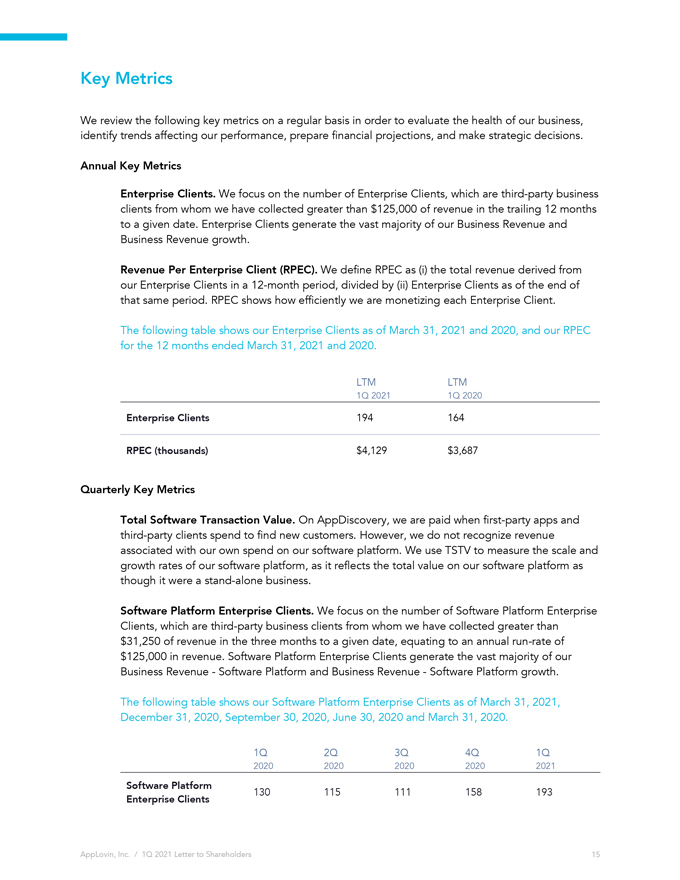
Key Metrics
We review the following key metrics on
a regular basis in order to evaluate the health of our business, identify trends affecting our performance, prepare financial projections, and make strategic decisions.
Annual Key Metrics
Enterprise Clients. We focus on the number of Enterprise Clients, which are
third-party business clients from whom we have collected greater than $125,000 of revenue in the trailing 12 months to a given date. Enterprise Clients generate the vast majority of our Business Revenue and Business Revenue growth.
Revenue Per Enterprise Client (RPEC). We define RPEC as (i) the total revenue derived from our Enterprise Clients in a 12-month period,
divided by (ii) Enterprise Clients as of the end of that same period. RPEC shows how efficiently we are monetizing each Enterprise Client.
The following table
shows our Enterprise Clients as of March 31, 2021 and 2020, and our RPEC for the 12 months ended March 31, 2021 and 2020.
LTM LTM
1Q 2021 1Q 2020
Enterprise
Clients 194 164
RPEC (thousands) $4,129 $3,687
Quarterly Key Metrics
Total Software Transaction Value. On AppDiscovery, we are paid when
first-party apps and third-party clients spend to find new customers. However, we do not recognize revenue associated with our own spend on our software platform. We use TSTV to measure the scale and growth rates of our software platform, as it
reflects the total value on our software platform as though it were a stand-alone business.
Software Platform Enterprise Clients. We focus on the number of
Software Platform Enterprise Clients, which are third-party business clients from whom we have collected greater than $31,250 of revenue in the three months to a given date, equating to an annual run-rate of
$125,000 in revenue. Software Platform Enterprise Clients generate the vast majority of our Business Revenue—Software Platform and Business Revenue—Software Platform growth.
The following table shows our Software Platform Enterprise Clients as of March 31, 2021, December 31, 2020, September 30, 2020, June 30, 2020 and March 31,
2020.
1Q 2Q 3Q 4Q 1Q
2020 2020 2020 2020 2021
Software Platform
130 115 111 158 193
Enterprise Clients
AppLovin, Inc. / 1Q 2021 Letter to Shareholders
15
Monthly Active Payers (MAPs). We define a MAP as a unique mobile device active on one of our apps in a month that completed at least one
IAP during that time period. A consumer who makes IAPs within two separate apps on the same mobile device in a monthly period will be counted as two MAPs. MAPs for a particular time period longer than one month are the average MAPs for each month
during that period. We estimate the number of MAPs by aggregating certain data from third-party attribution partners. Some of our apps do not utilize such third-party attribution partners, and therefore, our MAPs figure for any period does not
capture every user that completed an IAP on our apps. We estimate that our counted MAPs generated approximately 96% of our Consumer Revenue during the three months ending March 31, 2020, and as such, management believes that MAPs are still a
useful metric to measure the engagement and monetization potential of our games. We expect to increase our MAPs over time as we increase the number of our apps and enhance the engagement and monetization of our apps.
Average Revenue Per Monthly Active Payer (ARPMAP). We define ARPMAP as (i) the total
Consumer Revenue derived from our apps in a monthly period, divided by (ii) MAPs in that same period. ARPMAP for a particular time period longer than one
month is the average ARPMAP for each month during that period. ARPMAP shows how efficiently we are monetizing each MAP. We expect to increase ARPMAP over time as we enhance the monetization of our apps.
Our key metrics are not based on any standardized industry methodology and are not necessarily calculated in the same manner or comparable to similarly titled measures presented by
other companies. Similarly, our key metrics may differ from estimates published by third parties or from similarly titled metrics of our competitors due to differences in methodology. The numbers that we use to calculate TSTV, MAP, and ARPMAP are
based on internal data. While these numbers are based on what we believe to be reasonable judgements and estimates for the applicable period of measurement, there are inherent challenges in measuring usage and engagement. We regularly review and may
adjust our processes for calculating our internal metrics to improve their accuracy.
AppLovin, Inc. / 1Q 2021 Letter to Shareholders
16
Non-GAAP Financial Metrics
To supplement our financial information presented in accordance with generally accepted accounting principles in the United States (“GAAP”), this letter includes certain
financial measures that are not prepared in accordance with GAAP, including Adjusted EBITDA, Adjusted EBITDA margin, and non-GAAP costs and expense. A reconciliation of each such
non-GAAP financial measure to the most directly comparable GAAP measure can be found below.
We define Adjusted EBITDA for a
particular period as net income (loss) before interest expense and loss on settlement of debt, other (income) expense, net, provision for (benefit from) income taxes, amortization, depreciation and write-offs and as further adjusted for stock-based
compensation expense, acquisition-related expense, loss (gain) on extinguishments of acquisition-related contingent consideration, non-operating foreign exchange (gains) losses, lease modification and
abandonment of leasehold improvements, and change in the fair value of contingent consideration. We define Adjusted EBITDA margin as Adjusted EBITDA divided by revenue for the same period. We define non-GAAP
costs and expenses as total costs and expenses adjusted to exclude stock-based compensation expense, amortization expense related to acquired intangibles and acquisition-related expense.
We believe that the presentation of these non-GAAP financial measures provides useful information to investors regarding our results of
operations and operating performance, as they are similar to measures reported by its public competitors and are regularly used by securities analysts, institutional investors, and other interested parties in analyzing operating performance and
prospects.
Adjusted EBITDA, Adjusted EBITDA margin, and non-GAAP costs and expenses are key measures we use to assess our
financial performance and are also used for internal planning and forecasting purposes. We believe Adjusted EBITDA, Adjusted EBITDA margin, and non-GAAP costs and expenses are helpful to investors, analysts,
and other interested parties because they can assist in providing a more consistent and comparable overview of our operations across our historical financial periods. In addition, these measures are frequently used by analysts, investors, and other
interested parties to evaluate and assess performance. We use Adjusted EBITDA, Adjusted EBITDA margin, and non-GAAP costs and expenses in conjunction with GAAP measures as part of our overall assessment of our
performance, including the preparation of our annual operating budget and quarterly forecasts, to evaluate the effectiveness of our business strategies, and to communicate with our board of directors concerning our financial performance. These non-GAAP financial measures are presented for supplemental informational purposes only and should not be considered as alternatives or substitutes to financial information presented in accordance with GAAP. These
measures have certain limitations in that they do not include the impact of certain expenses that are reflected in our consolidated statement of operations that are necessary to run our business. Our definitions may differ from the definitions used
by other companies and therefore comparability may be limited. In addition, other companies may not publish these or similar metrics. Furthermore, these metrics have certain limitations in that they do not include the impact of certain expenses that
are reflected in our consolidated statement of operations that are necessary to run our business. Thus, our non-GAAP financial measures should be considered in addition to, not as substitutes for, or in
isolation from, measures prepared in accordance with GAAP.
AppLovin, Inc. / 1Q 2021 Letter to Shareholders
17
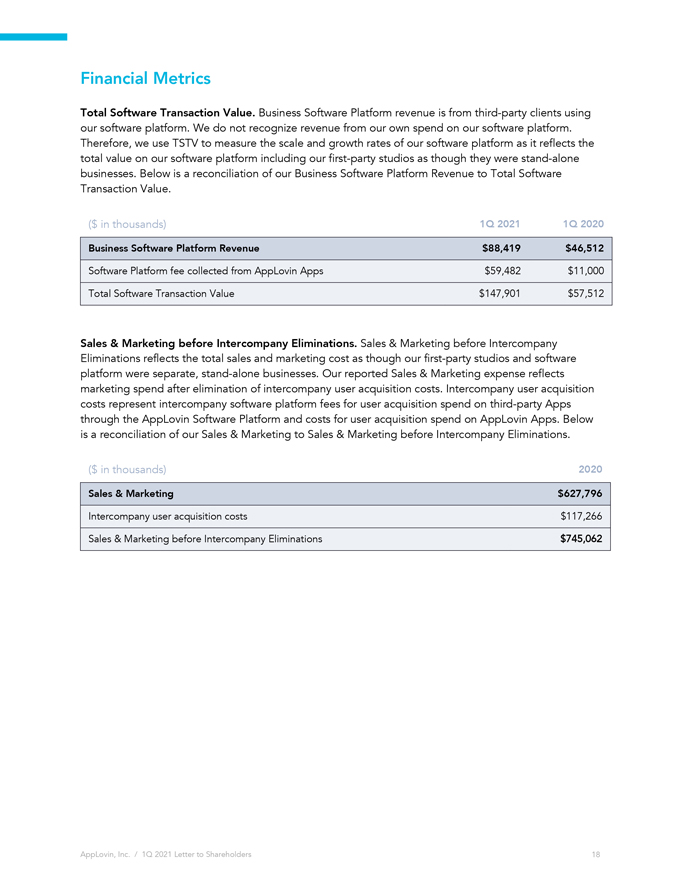
Financial Metrics
Total Software Transaction
Value. Business Software Platform revenue is from third-party clients using our software platform. We do not recognize revenue from our own spend on our software platform. Therefore, we use TSTV to measure the scale and growth rates of our software
platform as it reflects the total value on our software platform including our first-party studios as though they were stand-alone businesses. Below is a reconciliation of our Business Software Platform Revenue to Total Software Transaction Value.
($ in thousands) 1Q 2021 1Q 2020 Business Software Platform Revenue $88,419 $46,512
Software Platform fee collected from AppLovin Apps $59,482 $11,000 Total Software Transaction Value $147,901 $57,512
Sales & Marketing before Intercompany Eliminations. Sales & Marketing before Intercompany
Eliminations reflects the total sales and marketing cost as though our first-party studios and software platform were separate, stand-alone businesses. Our reported
Sales & Marketing expense reflects marketing spend after elimination of intercompany user acquisition costs. Intercompany user acquisition costs represent intercompany software platform fees for user acquisition spend on third-party Apps
through the AppLovin Software Platform and costs for user acquisition spend on AppLovin Apps. Below is a reconciliation of our Sales & Marketing to Sales & Marketing before Intercompany Eliminations.
($ in thousands) 2020 Sales & Marketing $627,796
Intercompany user acquisition costs
$117,266 Sales & Marketing before Intercompany Eliminations $745,062
AppLovin, Inc. / 1Q 2021 Letter to Shareholders
18
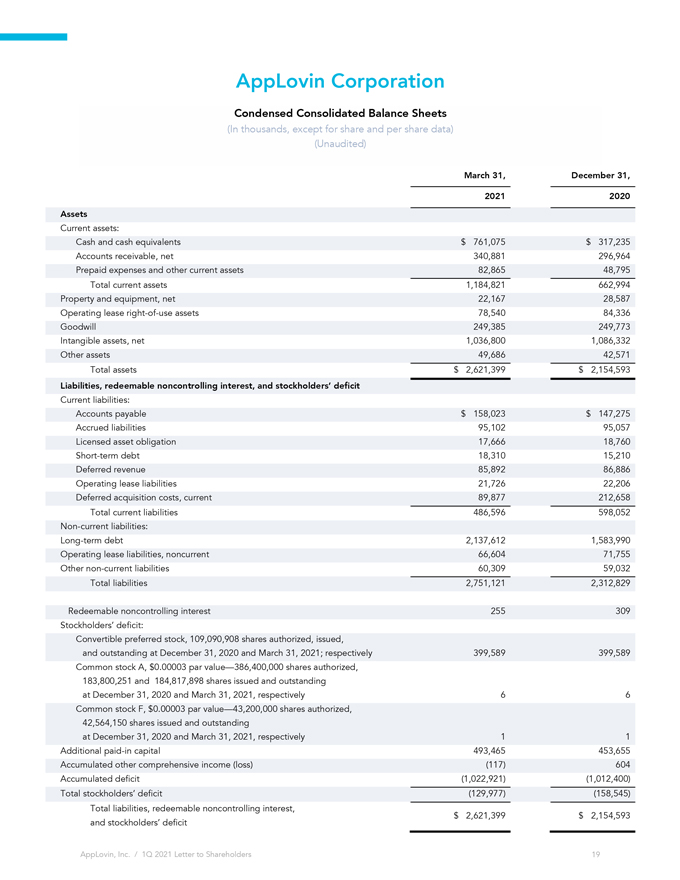
AppLovin Corporation
Condensed Consolidated
Balance Sheets
(In thousands, except for share and per share data) (Unaudited)
March 31, December 31,
2021 2020 Assets
Current
assets:
Cash and cash equivalents $ 761,075 $ 317,235 Accounts
receivable, net 340,881 296,964 Prepaid expenses and other
current assets 82,865 48,795 Total current
assets 1,184,821 662,994 Property and equipment,
net 22,167 28,587 Operating lease right-of-use
assets 78,540 84,336
Goodwill 249,385 249,773 Intangible assets,
net 1,036,800 1,086,332 Other
assets 49,686 42,571 Total assets
$ 2,621,399 $ 2,154,593
Liabilities, redeemable noncontrolling interest, and
stockholders’ deficit
Current liabilities:
Accounts payable $ 158,023 $ 147,275 Accrued
liabilities 95,102 95,057 Licensed asset obligation
17,666 18,760 Short-term
debt 18,310 15,210 Deferred
revenue 85,892 86,886 Operating lease
liabilities 21,726 22,206 Deferred acquisition costs,
current 89,877 212,658 Total current
liabilities 486,596 598,052
Non-current liabilities: Long-term debt 2,137,612 1,583,990 Operating lease liabilities,
noncurrent 66,604 71,755 Other non-current
liabilities 60,309 59,032 Total
liabilities 2,751,121 2,312,829
Redeemable noncontrolling
interest 255 309 Stockholders’
deficit: Convertible preferred stock, 109,090,908 shares authorized, issued, and outstanding at December 31, 2020 and March 31, 2021;
respectively 399,589 399,589 Common stock A, $0.00003 par
value—386,400,000 shares authorized, 183,800,251 and 184,817,898 shares issued and outstanding at December 31, 2020 and March 31, 2021,
respectively 6 6 Common stock F, $0.00003 par
value—43,200,000 shares authorized, 42,564,150 shares issued and outstanding at December 31, 2020 and March 31, 2021,
respectively 1 1 Additional
paid-in
capital 493,465 453,655 Accumulated other comprehensive
income (loss) (117) 604 Accumulated
deficit (1,022,921) (1,012,400) Total stockholders’
deficit (129,977) (158,545) Total liabilities, redeemable
noncontrolling interest, $ 2,621,399 $ 2,154,593 and stockholders’ deficit
AppLovin, Inc. / 1Q 2021 Letter to Shareholders
19
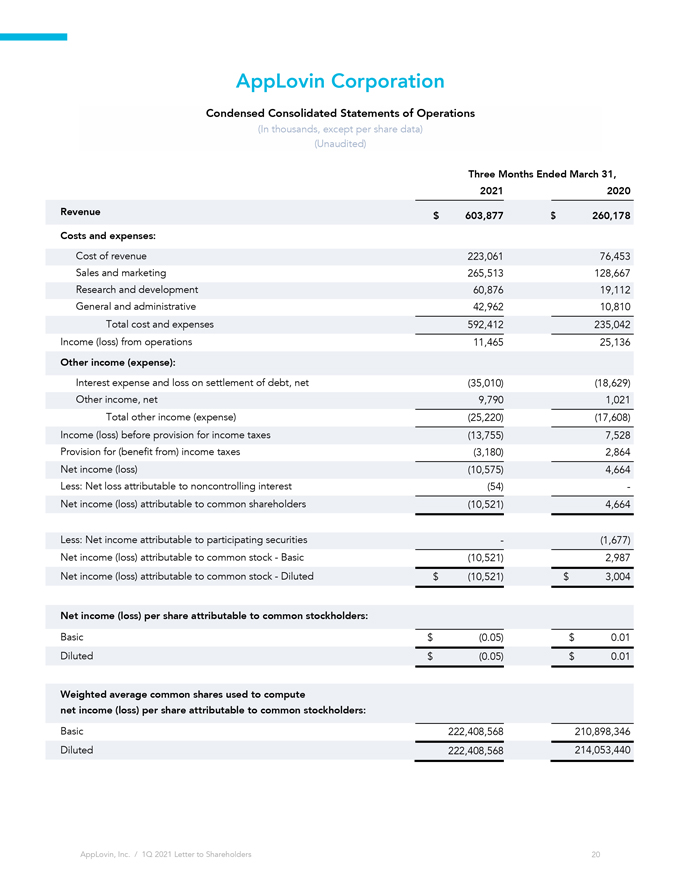
AppLovin Corporation
Condensed Consolidated
Statements of Operations
(In thousands, except per share data) (Unaudited)
Three Months Ended March 31, 2021 2020 Revenue $ 603,877 $ 260,178 Costs and expenses:
Cost of
revenue 223,061 76,453 Sales and
marketing 265,513 128,667 Research and
development 60,876 19,112 General and
administrative 42,962 10,810 Total cost and
expenses 592,412 235,042 Income (loss) from
operations 11,465 25,136
Other income (expense):
Interest expense and loss on settlement of debt,
net (35,010) (18,629) Other income,
net 9,790 1,021 Total other income
(expense) (25,220) (17,608) Income (loss) before provision
for income taxes (13,755) 7,528 Provision for (benefit
from) income taxes (3,180) 2,864 Net income
(loss) (10,575) 4,664 Less: Net loss attributable to
noncontrolling interest (54) -Net income (loss) attributable to common
shareholders (10,521) 4,664
Less: Net income attributable to participating securities — (1,677) Net income
(loss) attributable to common
stock—Basic (10,521) 2,987 Net income (loss)
attributable to common stock—Diluted $ (10,521)
$ 3,004
Net income (loss) per share attributable to common
stockholders:
Basic $ (0.05)
$ 0.01 Diluted $ (0.05)
$ 0.01
Weighted average common shares used to compute net income
(loss) per share attributable to common stockholders:
Basic 222,408,568 210,898,346
Diluted 222,408,568 214,053,440
AppLovin, Inc. / 1Q 2021 Letter to
Shareholders
20
AppLovin Corporation
Condensed Consolidated
Statements of Comprehensive Loss
(In thousands) (Unaudited)
Three Months
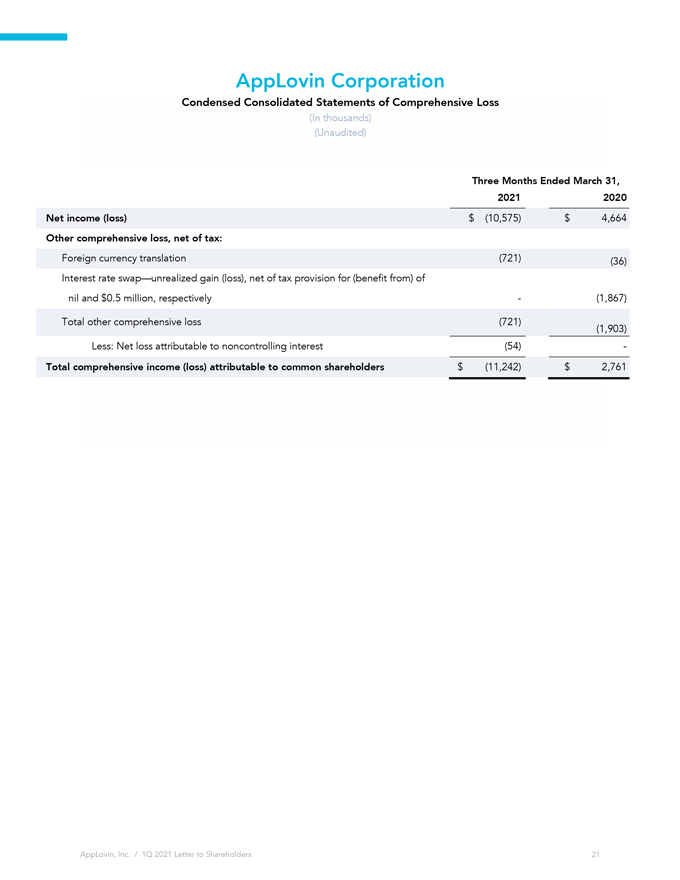
Ended March 31, 2021 2020 Net income (loss) $ (10,575) $ 4,664
Other comprehensive loss, net of tax:
Foreign currency
translation (721) (36) Interest rate swap—unrealized
gain (loss), net of tax provision for (benefit from) of nil and $0.5 million, respectively — (1,867)
Total other comprehensive loss (721)
(1,903) Less: Net loss attributable to noncontrollin
g
interest (54) -
Total comprehensive income
(loss) attributable to common shareholders $ (11,242)
$ 2,761
AppLovin, Inc. / 1Q 2021 Letter to Shareholders
21
AppLovin Corporation
Condensed Consolidated
Statements of Cash Flows
(In thousands, except per share data) (Unaudited)
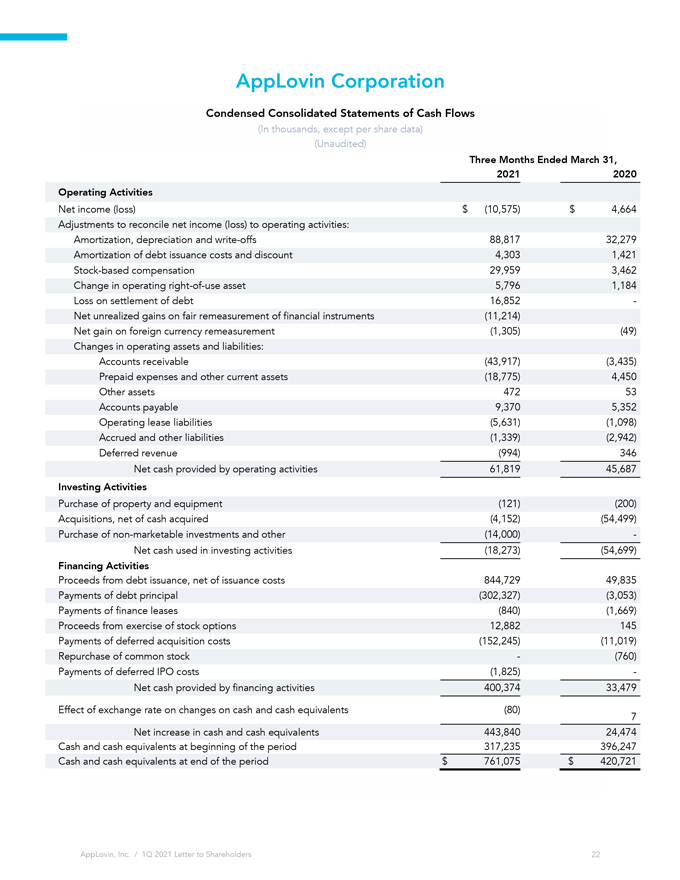
Three Months Ended March 31, 2021 2020 Operating Activities
Net income
(loss) $ (10,575) $ 4,664 Adjustments to reconcile net
income (loss) to operating activities: Amortization, depreciation and
write-offs 88,817 32,279 Amortization of debt issuance
costs and discount 4,303 1,421 Stock-based
compensation 29,959 3,462 Change in operating right-of-use
asset 5,796 1,184 Loss on settlement of
debt 16,852 -Net
unrealized gains on fair remeasurement of financial instruments (11,214) Net gain on foreign currency
remeasurement (1,305) (49) Changes in operating assets and
liabilities: Accounts receivable (43,917) (3,435) Prepaid expenses and other current assets
(18,775) 4,450 Other
assets 472 53 Accounts
payable 9,370 5,352 Operating lease
liabilities (5,631) (1,098) Accrued and other
liabilities (1,339) (2,942) Deferred
revenue (994) 346 Net cash provided by operating
activities 61,819 45,687
Investing Activities
Purchase of property and
equipment (121) (200) Acquisitions, net of cash
acquired (4,152) (54,499) Purchase of non-marketable investments and
other (14,000) -Net cash used in investing
activities (18,273) (54,699)
Financing Activities
Proceeds from debt issuance, net of issuance
costs 844,729 49,835 Payments of debt principal
(302,327) (3,053) Payments of finance
leases (840) (1,669) Proceeds from exercise of stock
options 12,882 145 Payments of deferred acquisition costs
(152,245) (11,019) Repurchase of common
stock — (760) Payments of deferred IPO
costs (1,825) -Net
cash provided by financing activities 400,374 33,479 Effect
of exchange rate on changes on cash and cash equivalents (80)
7 Net
increas
e in cash and cash
equivalents 443,840 24,474 Cash and cash equivalents
at beginning of the
period 317,235 396,247 Cash and cash equivalents at
end of the period $ 761,075
$ 420,721
AppLovin, Inc. / 1Q 2021 Letter to Shareholders
22
AppLovin Corporation
Condensed Consolidated
Statements of Cash Flows (continued)
(In thousands) (Unaudited)
Three Months
Ended March 31, 2021 2020
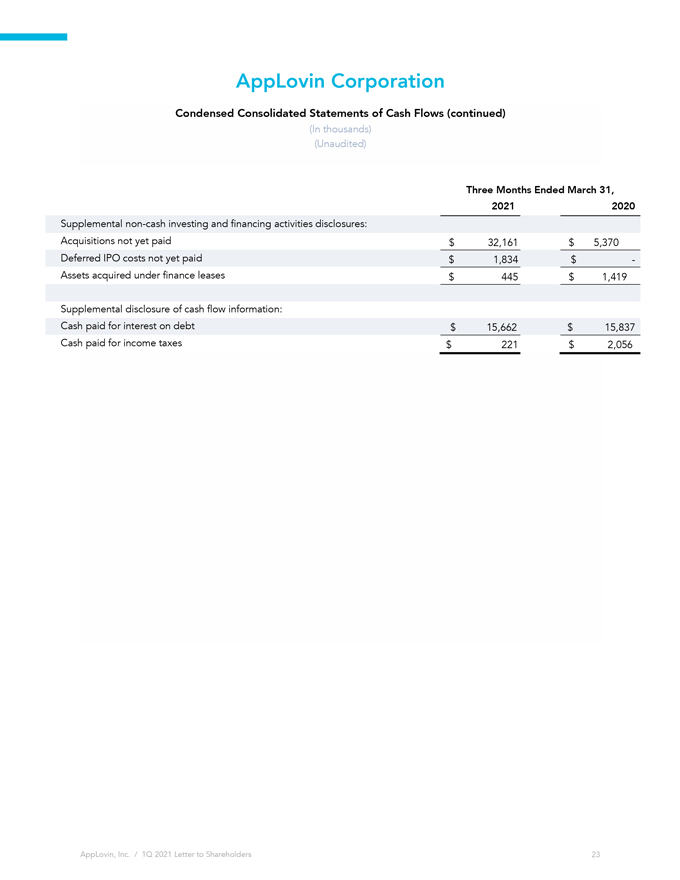
Supplemental non-cash investing and financing activities disclosures:
Acquisitions not yet
paid $ 32,161 $
5,370
Deferred IPO costs not yet
paid $ 1,834 $ -Assets acquired
under finance leases $
445 $ 1,419
Supplemental disclosure of cash
flow information:
Cash paid for interest on
debt $ 15,662 $ 15,837 Cash paid for
income
taxes $ 221 $
2,056
AppLovin, Inc. / 1Q 2021 Letter to Shareholders
23
AppLovin Corporation
Reconciliation of Net Income
(Loss) to Adjusted EBITDA
(Unaudited and in thousands)
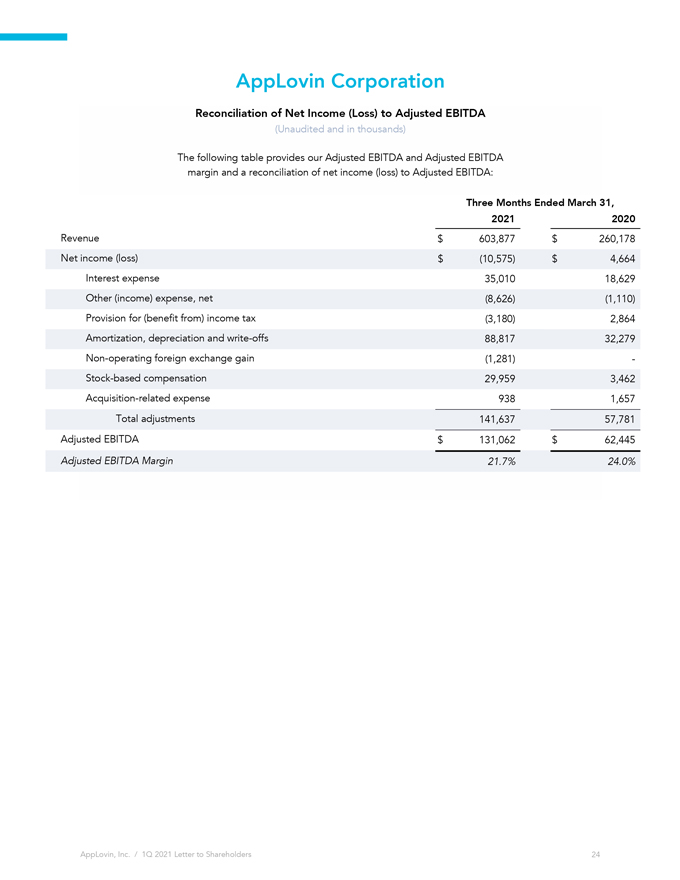
The following table
provides our Adjusted EBITDA and Adjusted EBITDA margin and a reconciliation of net income (loss) to Adjusted EBITDA:
Three Months Ended March 31, 2021 2020
Revenue $ 603,877
$ 260,178 Net income (loss) $ (10,575)
$ 4,664 Interest expense 35,010 18,629 Other (income) expense, net (8,626) (1,110) Provision for (benefit from) income tax (3,180) 2,864 Amortization,
depreciation and write-offs 88,817 32,279 Non-operating foreign exchange gain (1,281) -Stock-based compensation
29,959 3,462 Acquisition-related expense 938 1,657 Total adjustments 141,637 57,781 Adjusted EBITDA $ 131,062
$ 62,445
Adjusted EBITDA Margin 21.7% 24.0%
AppLovin, Inc. / 1Q 2021 Letter to Shareholders
24
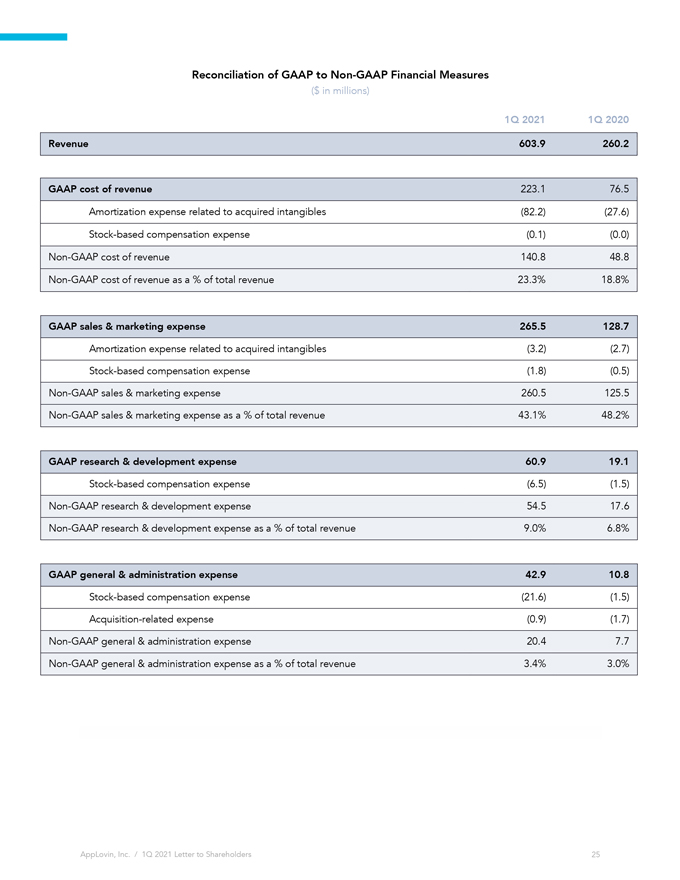
Reconciliation of GAAP to Non-GAAP Financial Measures
($ in millions)
1Q 2021 1Q 2020 Revenue 603.9 260.2
GAAP cost of revenue 223.1 76.5 Amortization expense related to acquired intangibles (82.2) (27.6) Stock-based compensation expense (0.1) (0.0)
Non-GAAP cost of revenue 140.8 48.8 Non-GAAP cost of revenue as a % of total revenue 23.3% 18.8%
GAAP sales & marketing expense 265.5 128.7
Amortization expense related to acquired
intangibles (3.2) (2.7) Stock-based compensation expense (1.8) (0.5) Non-GAAP sales & marketing expense 260.5 125.5 Non-GAAP sales & marketing expense
as a % of total revenue 43.1% 48.2%
GAAP research & development expense 60.9 19.1
Stock-based compensation expense (6.5) (1.5) Non-GAAP research & development expense 54.5 17.6
Non-GAAP research & development expense as a % of total revenue 9.0% 6.8%
GAAP general & administration
expense 42.9 10.8
Stock-based compensation expense (21.6) (1.5) Acquisition-related expense (0.9) (1.7) Non-GAAP
general & administration expense 20.4 7.7 Non-GAAP general & administration expense as a % of total revenue 3.4% 3.0%
AppLovin, Inc. / 1Q 2021 Letter to Shareholders
25