Attached files
| file | filename |
|---|---|
| EX-99.1 - EX-99.1 - SelectQuote, Inc. | selectquoteincmarch312021p.htm |
| 8-K - 8-K - SelectQuote, Inc. | selectquoteincmarch3120218.htm |

3rd Quarter and Fiscal Year to Date 2021 Earnings Conference Call Presentation May 12, 2021 Exhibit 99.2

Forward-Looking Statements This presentation contains forward-looking statements. These forward-looking statements reflect our current views with respect to, among other things, future events and our financial performance. These statements are often, but not always, made through the use of words or phrases such as “may,” “should,” “could,” “predict,” “potential,” “believe,” “will likely result,” “expect,” “continue,” “will,” “anticipate,” “seek,” “estimate,” “intend,” “plan,” “projection,” “would” and “outlook,” or the negative version of those words or other comparable words or phrases of a future or forward-looking nature. These forward-looking statements are not historical facts, and are based on current expectations, estimates and projections about our industry, management’s beliefs and certain assumptions made by management, many of which, by their nature, are inherently uncertain and beyond our control. Accordingly, we caution you that any such forward-looking statements are not guarantees of future performance and are subject to risks, assumptions and uncertainties that are difficult to predict. Although we believe that the expectations reflected in these forward-looking statements are reasonable as of the date made, actual results may prove to be materially different from the results expressed or implied by the forward-looking statements. There are or will be important factors that could cause our actual results to differ materially from those indicated in these forward-looking statements, including, but not limited to, the following: the ultimate duration and impact of the ongoing COVID-19 pandemic, our reliance on a limited number of insurance carrier partners and any potential termination of those relationships or failure to develop new relationships; existing and future laws and regulations affecting the health insurance market; changes in health insurance products offered by our insurance carrier partners and the health insurance market generally; insurance carriers offering products and services directly to consumers; changes to commissions paid by insurance carriers and underwriting practices; competition with brokers, exclusively online brokers and carriers who opt to sell policies directly to consumers; competition from government-run health insurance exchanges; developments in the U.S. health insurance system; our dependence on revenue from carriers in our senior segment and downturns in the senior health as well as life, automotive and home insurance industries; our ability to develop new offerings and penetrate new vertical markets; risks from third-party products; failure to enroll individuals during the Medicare annual enrollment period; our ability to attract, integrate and retain qualified personnel; our dependence on lead providers and ability to compete for leads; failure to obtain and/or convert sales leads to actual sales of insurance policies; access to data from consumers and insurance carriers; accuracy of information provided from and to consumers during the insurance shopping process; cost-effective advertisement through internet search engines; ability to contact consumers and market products by telephone; global economic conditions; disruption to operations as a result of future acquisitions; significant estimates and assumptions in the preparation of our financial statements; impairment of goodwill; potential litigation and claims, including IP litigation; our existing and future indebtedness; developments with respect to LIBOR; access to additional capital; failure to protect our intellectual property and our brand; fluctuations in our financial results caused by seasonality; accuracy and timeliness of commissions reports from insurance carriers; timing of insurance carriers’ approval and payment practices; factors that impact our estimate of the constrained lifetime value of commissions per policyholder; changes in accounting rules, tax legislation and other legislation; disruptions or failures of our technological infrastructure and platform; failure to maintain relationships with third-party service providers; cybersecurity breaches or other attacks involving our systems or those of our insurance carrier partners or third-party service providers; our ability to protect consumer information and other data; and failure to market and sell Medicare plans effectively or in compliance with laws. For a further discussion of these and other risk factors that could impact our future results and performance, see the section entitled “Risk Factors” in the most recent Annual Report on Form 10-K (the “Annual Report”) filed by us with the Securities Exchange Commission. Accordingly, you should not place undue reliance on any such forward-looking statements. Any forward-looking statement speaks only as of the date on which it is made, and, except as otherwise required by law, we do not undertake any obligation to publicly update or review any forward-looking statement, whether as a result of new information, future developments or otherwise. Certain information contained in this presentation and statements made orally during this presentation relates to or are based on publications and other data obtained from third-party sources. While we believe these third-party sources to be reliable as of the date of this presentation, we have not independently verified, and make no representation as to the adequacy, fairness, accuracy or completeness of, any information obtained from such third-party sources. No Offer or Solicitation; Further Information This presentation is for informational purposes only and is not an offer to sell with respect to any securities. This presentation should be read together with “Management’s Discussion and Analysis of Financial Condition and Results of Operations” and the consolidated financial statements and the related notes thereto included in the Annual Report and subsequent quarterly reports.. Non-GAAP Financial Measures This presentation includes certain non-GAAP financial measures intended to supplement, not substitute for, comparable GAAP measures. To supplement our financial statements presented in accordance with GAAP and to provide investors with additional information regarding our GAAP financial results, we have presented in this presentation Adjusted EBITDA and Adjusted EBITDA Margin, which are non-GAAP financial measures. These non-GAAP financial measures are not based on any standardized methodology prescribed by GAAP and are not necessarily comparable to similarly titled measures presented by other companies. We define Adjusted EBITDA as income before interest expense, income tax expense, depreciation and amortization, and certain add-backs for non-cash or non-recurring expenses, including restructuring and share-based compensation expenses. The most directly comparable GAAP measure is net income. We monitor and have presented in this presentation Adjusted EBITDA because it is a key measure used by our management and Board of Directors to understand and evaluate our operating performance, to establish budgets and to develop operational goals for managing our business. In particular, we believe that excluding the impact of these expenses in calculating Adjusted EBITDA can provide a useful measure for period-to-period comparisons of our core operating performance. For further discussion regarding this non-GAAP measure, please see today’s press release. Disclaimer

SelectQuote drove significant top-line and profit results for the 3rd quarter primarily driven by a strong OEP period in our Senior division and growth in Final Expense policies Consolidated revenue totaled $267 million, up 80% year-over-year Consolidated Adjusted EBITDA* totaled $65 million, up 48% year-over-year Consolidated net income totaled $36 million or $0.22 per diluted share 3rd Quarter Highlights: • Senior revenue totaled $216 million, up 101% year-over-year, and Adjusted EBITDA* totaled $75 million, up 63% year-over-year • 17% increase in Senior agent productivity with 75% increase in avg. productive agents • Final Expense premium growth of 176% • Secured $292 million of committed capital through refinancing of term loan ◦ $147 million immediately and $145 million in committed delayed draw term loan Recently launched Population Health platform and announced acquisition of Express Med Pharmaceuticals, now branded SelectRx 3rd Quarter Earnings Summary 3 *See reconciliations from non-GAAP measure, Adjusted EBITDA, to net income on slides 17-19.

3rd Quarter Review – OEP Summarized 4 Growth 112% YoY Approved MA Policies 110% YoY Total Approved Policies Efficiency 75% Increase in Productive Agents 17% Increase in Agent Productivity Stability $1,362 MA LTV Customer Focus +63% YoY Adj. EBITDA* *Senior division. See reconciliations from non-GAAP measure, Adjusted EBITDA, to net income on slides 17-19. 600k+ CCA Customer Contacts

5 Home-Based Care Meal Delivery Medical Transportation Behavioral Health Diagnostics Value-Based Care (Primary Care) Medicare Advantage Specialized Medication Management Pharmacy Express Med Pharmaceuticals now Healthcare Literacy & Wellness Population Health’s Ecosystem of Leading Providers Leading Medicare insurers, Value-Based Primary Care providers, and a specialized medication management pharmacy serve as the foundational pillars to achieving improved patient outcomes. • Medicare plan sales • Benefits education • Patient education • Patient introductions • Post-visit surveys • Drug adherence • Chronic disease poly-pharmacy
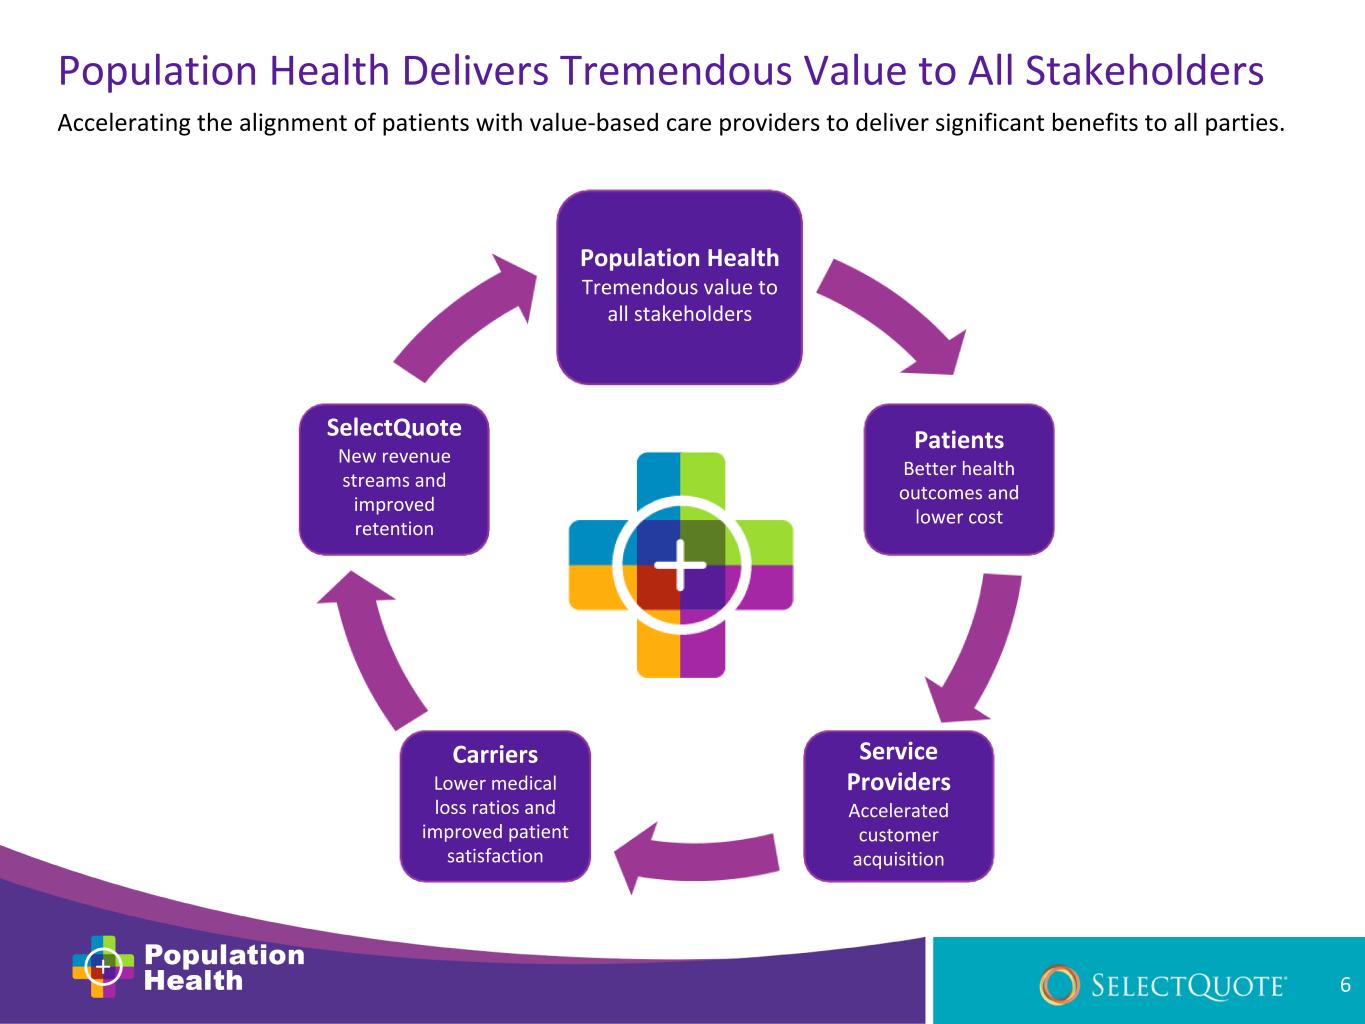
6 Accelerating the alignment of patients with value-based care providers to deliver significant benefits to all parties. SelectQuote New revenue streams and improved retention Patients Better health outcomes and lower cost Service Providers Accelerated customer acquisition Carriers Lower medical loss ratios and improved patient satisfaction Population Health Tremendous value to all stakeholders Population Health Delivers Tremendous Value to All Stakeholders

◦ Population Health not only reinforces our core business but also creates new revenue streams at low incremental CAC and with attractive cash profile ◦ Our market-leading and stable LTVs serve as a strong proof point to the sustainability and strategic advantages of our model ◦ Our differentiated approach to agents and technology delivers high quality growth at rapid scale and increasing agent productivity, which was up 17% Key Takeaways from 3rd Quarter and OEP 7 ◦ This was the most successful OEP in SelectQuote's history with Senior revenue and Adj. EBITDA* growth of 101% and 63%, respectively ◦ We are growing the business faster than expected and using less cash than expected to do it *See reconciliations from non-GAAP measure, Adjusted EBITDA, to net income on slides 17-19.

44 65 114 207 Q3 FY20 Q3 FY21 FYTD 20 FYTD 21 149 267 390 749 Q3 FY 20 Q3 FY 21 FYTD 20 FYTD 21 24% Adj. EBITDA Margin 30% 80 % *See reconciliations from non-GAAP measure, Adjusted EBITDA, to net income on slides 17-19. SelectQuote – Consolidated Financial Summary Revenue ($MM) Adj. EBITDA* ($MM) 92 % 28%29% 48 % 82 % 8
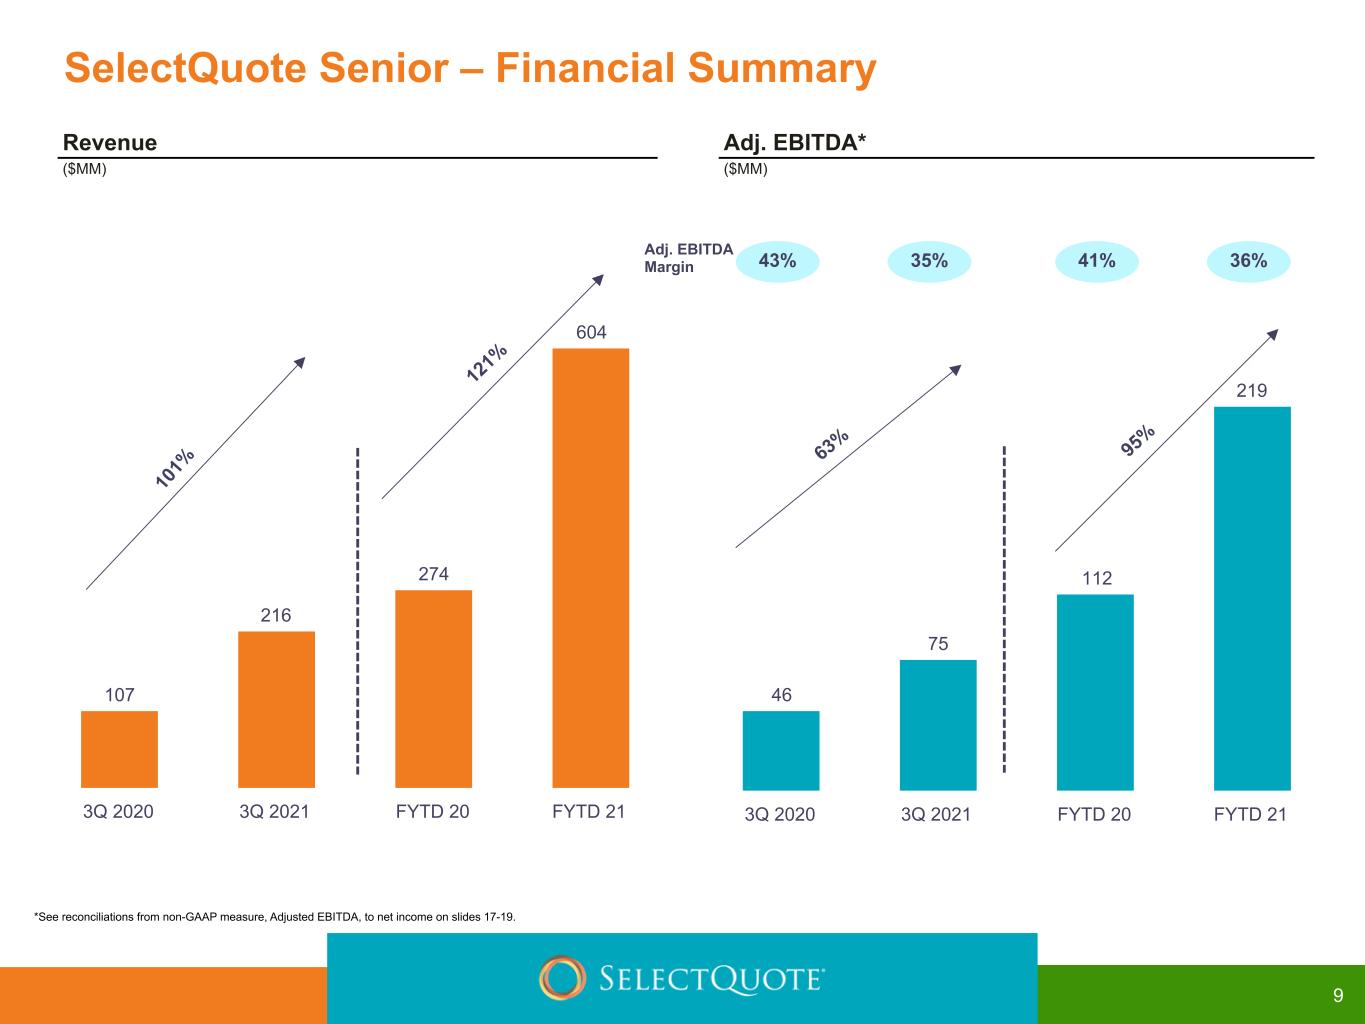
46 75 112 219 3Q 2020 3Q 2021 FYTD 20 FYTD 21 107 216 274 604 3Q 2020 3Q 2021 FYTD 20 FYTD 21 35% Adj. EBITDA Margin 43% 10 1% SelectQuote Senior – Financial Summary Revenue ($MM) Adj. EBITDA* ($MM) 12 1% 36%41% 63 % 95 % *See reconciliations from non-GAAP measure, Adjusted EBITDA, to net income on slides 17-19. 9

84,516 177,778 234,955 508,121 62,700 132,950 171,099 384,137 2,702 3,073 11,740 19,849 19,114 41,755 52,116 104,135 MA MS Other Q3 2020 Q3 2021 FYTD 20 FYTD 21 101,990 211,077 289,206 603,724 76,196 160,233 205,270 454,772 3,703 3,738 16,383 24,287 22,091 47,106 67,553 124,665 MA MS Other Q3 2020 Q3 2021 FYTD 20 FYTD 21 113% 107% 110% CAGR 1% 118% 110% 112% CAGR 14% Total Policies Submitted Total Policies Approved SelectQuote Senior – Policies 85% 109% 122% CAGR 48% 100% 116% 125% CAGR 69% 10

28 44 74 113 19 19 56 56 9 24 16 55 1 1 2 2 Core Premium Final Expense Ancillary Premium Q3 FY2020 Q3 FY2021 FYTD 20 FYTD 21 3 3 16 20 Q3 FY2020 Q3 FY2021 FYTD 20 FYTD 21 31 46 88 126 Q3 FY2020 Q3 FY2021 FYTD 20 FYTD 21 Adj. EBITDA Margin 7%11% 176% 58% 2% CAGR (9)% 50% Life Premium ($MM) Revenue ($MM) Adj. EBITDA* ($MM) SelectQuote Life – Financial Summary 96% 242% 52% —% CAGR 23% 43% 29% 16%18% *See reconciliations from non-GAAP measure, Adjusted EBITDA, to net income on slides 17-19. 11
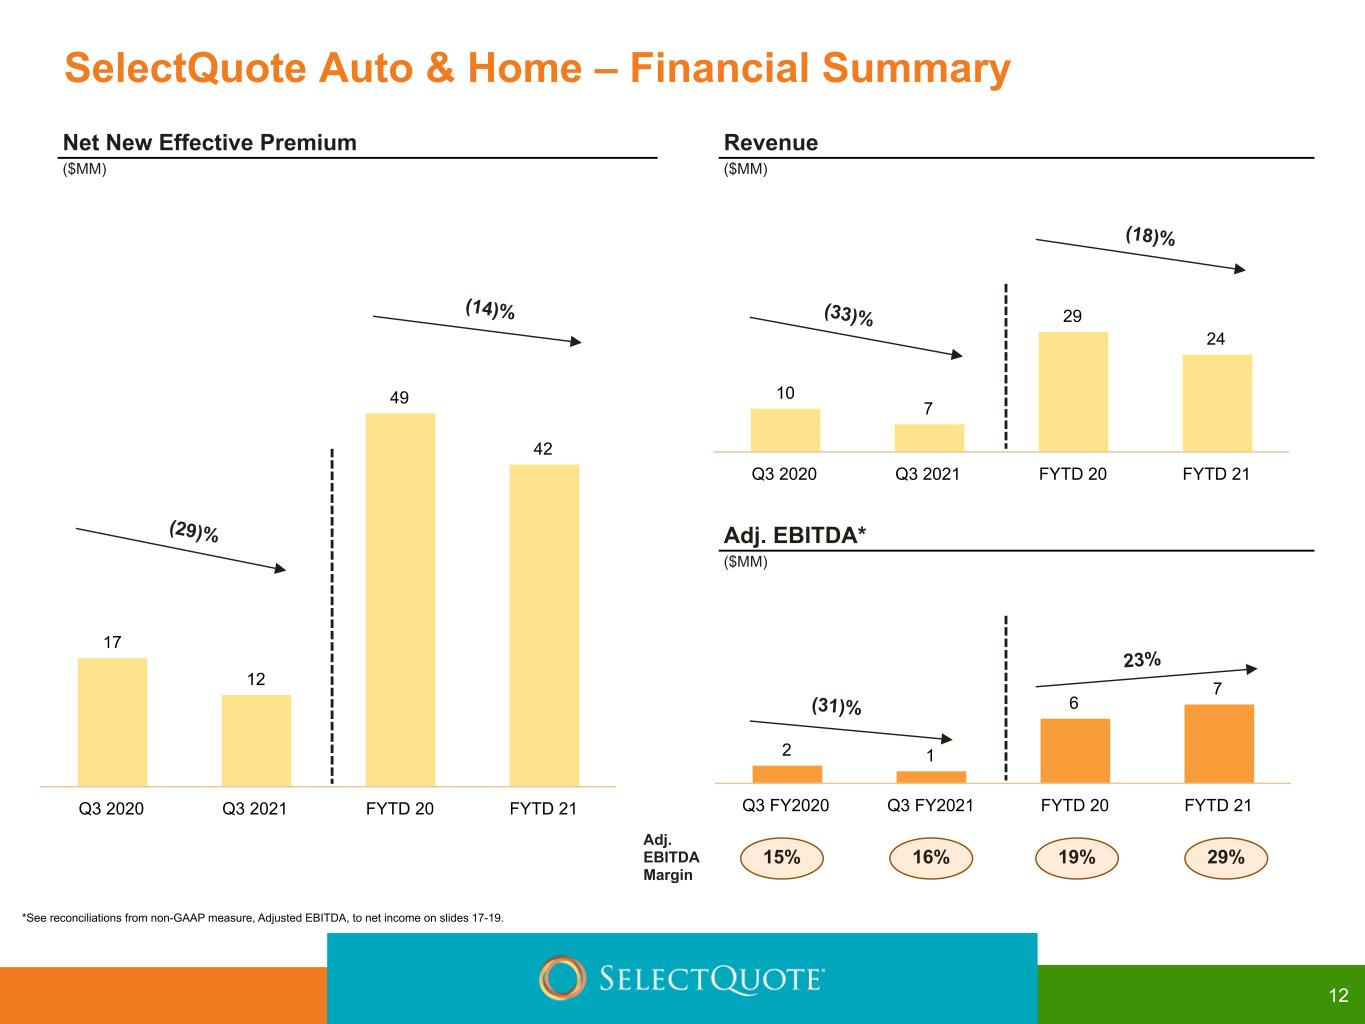
2 1 6 7 Q3 FY2020 Q3 FY2021 FYTD 20 FYTD 21 10 7 29 24 Q3 2020 Q3 2021 FYTD 20 FYTD 21 17 12 49 42 Q3 2020 Q3 2021 FYTD 20 FYTD 21 Adj. EBITDA Margin 16%15% (33)% (31)% (29)% Net New Effective Premium ($MM) Revenue ($MM) Adj. EBITDA* ($MM) *See reconciliations from non-GAAP measure, Adjusted EBITDA, to net income on slides 17-19. SelectQuote Auto & Home – Financial Summary (14)% (18)% 23% 29%19% 12

Growing Faster While Using Less Cash *See reconciliations from non-GAAP measure, Adjusted EBITDA, to net income on slides 17-19. ◦ IPO provided growth capital for the next several years ◦ Post IPO results have exceeded forecasts for revenue and EBITDA ◦ Accelerated growth would typically drive greater cash consumption ◦ Used less Cash Flow from Operations despite faster growth 4QFY20 - 3QFY21 ($MM) 13 704 168 (123) 891 247 (81) Expectation at IPO Actual + 27 % + 4 7% $43m Favo rable Revenue Adj. EBITDA* Cash Flow From Operations

• Net debt position of $103 million ◦ $369 million of cash and cash equivalents ◦ $472 million of term debt • Available borrowing capacity of $75 million on undrawn revolver • Accounts receivable, short and long term commissions receivable balance of $902 million • Refinanced Term Loan, lowered interest rate 20% to 5.75% and secured an additional $292 million of capital ◦ $147 million immediately ◦ $145 million in committed delayed draw term loan • Funded acquisition of asset deal and paid full Inside Response earnout in cash 14 Note: As of March 31, 2021 Capitalization Summary

($'s in millions) Range Implied YoY Growth Revenue $920 - $940 73% - 77% Net Income $130 - $138 60% - 70% Adjusted EBITDA* $225 - $235 46% - 53% *See reconciliations from non-GAAP measure, Adjusted EBITDA, to net income on slides 17-19. SelectQuote – FY2021 Consolidated Guidance 15
Supplemental information 16

3Q FY 2021 (in thousands) Senior Life Auto & Home Corp & Elims Consolidated Revenue $ 215,600 $ 46,400 $ 6,973 $ (2,050) $ 266,923 Operating expenses (140,111) (43,225) (5,877) (12,507) (201,720) Other expenses, net — — — (15) (15) Adjusted EBITDA 75,489 3,175 1,096 (14,572) 65,188 Share-based compensation expense (1,429) Non-recurring expenses (4,667) Fair value adjustments to contingent earnout obligations (334) Depreciation and amortization (4,323) Loss on disposal of property, equipment, and software (101) Interest expense, net (7,355) Loss on extinguishment of debt (3,315) Income tax expense (7,183) Net income $ 36,481 FYTD 2021 (in thousands) Senior Life Auto & Home Corp & Elims Consolidated Revenue $ 604,309 $ 125,598 $ 23,752 $ (4,293) $ 749,366 Operating expenses (385,363) (105,532) (16,889) (34,771) (542,555) Other expenses, net — — — (58) (58) Adjusted EBITDA 218,946 20,066 6,863 (39,122) 206,753 Share-based compensation expense (3,689) Non-recurring expenses (5,490) Fair value adjustments to contingent earnout obligations (1,487) Depreciation and amortization (11,260) Loss on disposal of property, equipment, and software (261) Interest expense, net (20,898) Loss on extinguishment of debt (3,315) Income tax expense (32,619) Net income $ 127,734 3Q FY 2021 and FYTD 2021 Adjusted EBITDA to Net Income Reconciliation 17
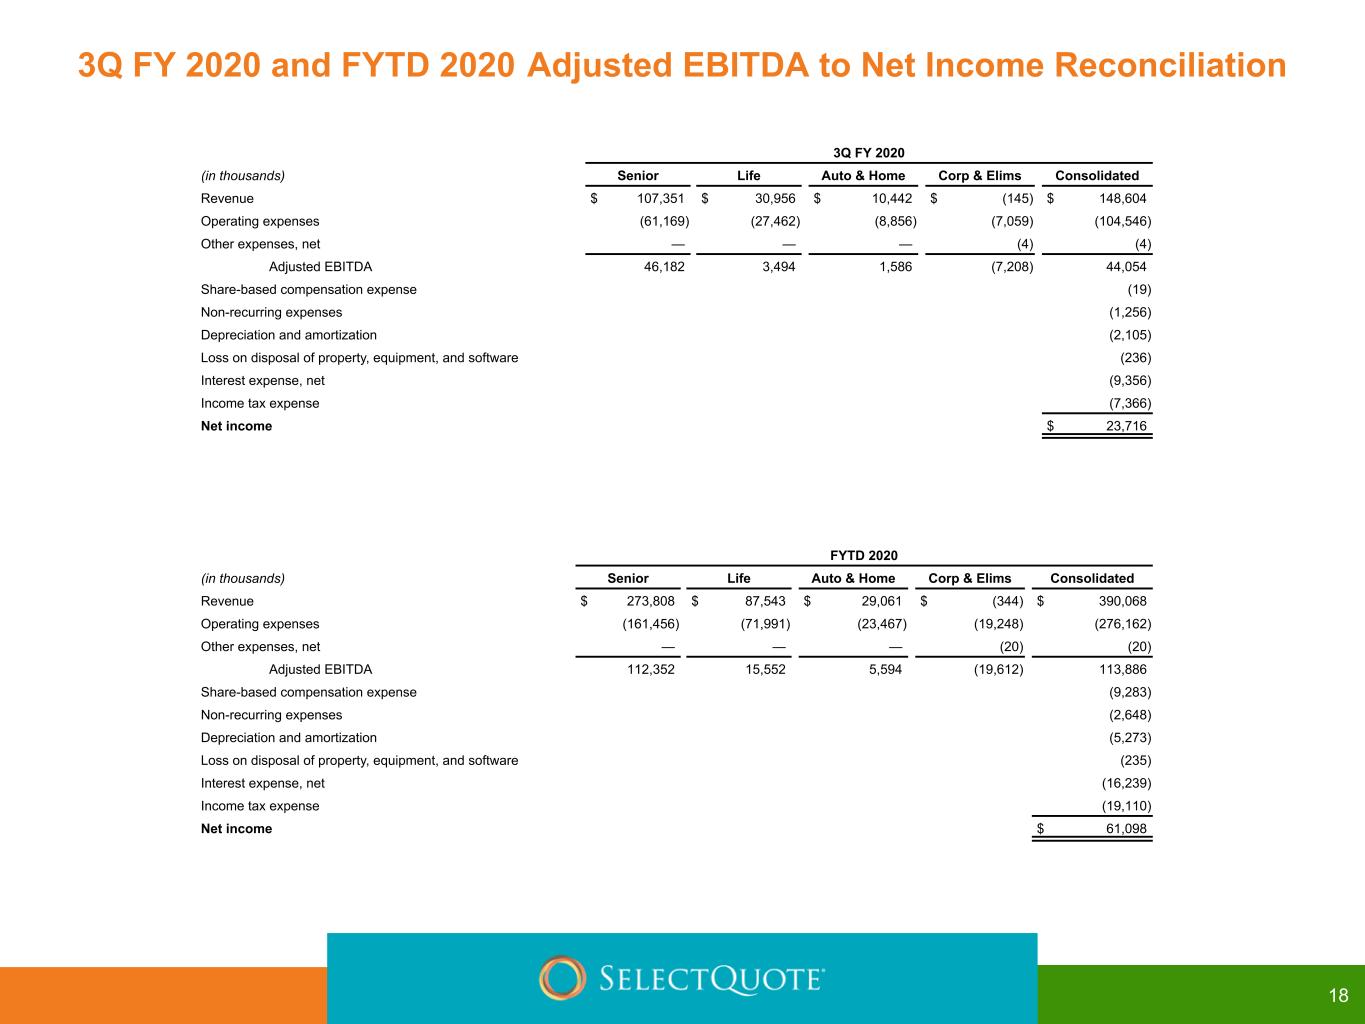
3Q FY 2020 (in thousands) Senior Life Auto & Home Corp & Elims Consolidated Revenue $ 107,351 $ 30,956 $ 10,442 $ (145) $ 148,604 Operating expenses (61,169) (27,462) (8,856) (7,059) (104,546) Other expenses, net — — — (4) (4) Adjusted EBITDA 46,182 3,494 1,586 (7,208) 44,054 Share-based compensation expense (19) Non-recurring expenses (1,256) Depreciation and amortization (2,105) Loss on disposal of property, equipment, and software (236) Interest expense, net (9,356) Income tax expense (7,366) Net income $ 23,716 FYTD 2020 (in thousands) Senior Life Auto & Home Corp & Elims Consolidated Revenue $ 273,808 $ 87,543 $ 29,061 $ (344) $ 390,068 Operating expenses (161,456) (71,991) (23,467) (19,248) (276,162) Other expenses, net — — — (20) (20) Adjusted EBITDA 112,352 15,552 5,594 (19,612) 113,886 Share-based compensation expense (9,283) Non-recurring expenses (2,648) Depreciation and amortization (5,273) Loss on disposal of property, equipment, and software (235) Interest expense, net (16,239) Income tax expense (19,110) Net income $ 61,098 3Q FY 2020 and FYTD 2020 Adjusted EBITDA to Net Income Reconciliation 18

(in thousands) Range Net Income $ 130,000 $ 138,000 Income tax expense 34,000 36,000 Loss on extinguishment of debt 3,000 3,000 Interest expense, net 29,000 29,000 Depreciation and amortization 16,000 16,000 Fair value adjustments to contingent earnout obligations 1,000 1,000 Non-recurring expenses 7,000 7,000 Share-based compensation expense 5,000 5,000 Adjusted EBITDA $ 225,000 $ 235,000 FY21 Guidance Adjusted EBITDA to Net Income Reconciliation 19
