Attached files
| file | filename |
|---|---|
| EX-99.2 - EX-99.2 - QuantumScape Corp | d400954dex992.htm |
| 8-K - 8-K - QuantumScape Corp | d400954d8k.htm |
Exhibit 99.1
Q1 FISCAL 2021 LETTER TO SHAREHOLDERS MAY 11, 2021


QuantumScape Corporation
Consolidated Balance Sheets
(In Thousands, Except Share and per Share Amounts)
| March 31, 2021 |
December 31, 2020 | |||||||
| Assets |
||||||||
| Current assets |
||||||||
| Cash and cash equivalents ($3,381 and $3,406 as of March 31, 2021 and December 31, 2020, respectively, for joint venture) |
$ |
762,341 |
|
$ |
113,216 |
| ||
| Marketable securities |
|
771,101 |
|
|
884,336 |
| ||
| Prepaid expenses and other current assets |
|
8,502 |
|
|
11,616 |
| ||
|
|
|
|
|
|
| |||
| Total current assets |
|
1,541,944 |
|
|
1,009,168 |
| ||
| Property and equipment, net |
|
59,533 |
|
|
43,696 |
| ||
|
Right-of-use lease asset |
|
12,031 |
|
|
11,712 |
| ||
| Other assets |
|
2,829 |
|
|
2,193 |
| ||
|
|
|
|
|
|
| |||
| Total assets |
$ |
1,616,337 |
|
$ |
1,066,769 |
| ||
|
|
|
|
|
|
| |||
| Liabilities, redeemable non-controlling interest and stockholders’ equity |
||||||||
| Current liabilities |
||||||||
| Accounts payable |
$ |
9,871 |
|
$ |
5,383 |
| ||
| Accrued liabilities |
|
4,160 |
|
|
2,701 |
| ||
| Accrued compensation |
|
5,355 |
|
|
2,391 |
| ||
| Operating lease liability, short-term |
|
1,465 |
|
|
1,220 |
| ||
| Strategic premium, short-term |
|
503 |
|
|
655 |
| ||
|
|
|
|
|
|
| |||
| Total current liabilities |
|
21,354 |
|
|
12,350 |
| ||
| Operating lease liability, long-term |
|
11,344 |
|
|
11,244 |
| ||
| Assumed common stock warrant liabilities |
|
288,039 |
|
|
689,699 |
| ||
|
|
|
|
|
|
| |||
| Total liabilities |
|
320,737 |
|
|
713,293 |
| ||
| Redeemable non-controlling interest |
|
1,694 |
|
|
1,704 |
| ||
| Stockholders’ equity |
||||||||
| Preferred stock- $0.0001 par value; 100,000,000 shares authorized, none issued and outstanding as of March 31, 2021 and December 31, 2020 |
|
— |
|
|
— |
| ||
| Common stock - $0.0001 par value; 1,250,000,000 shares authorized (1,000,000,000 Class A and 250,000,000 Class B); 233,610,488 Class A and 156,161,849 Class B shares issued and outstanding as of March 31, 2021, 207,769,091 Class A and 156,224,614 Class B shares issued and outstanding as of December 31, 2020 |
|
39 |
|
|
36 |
| ||
| Additional paid-in-capital |
|
3,346,442 |
|
|
2,329,406 |
| ||
| Accumulated other comprehensive (loss) income |
|
143 |
|
|
(31 |
) | ||
| Accumulated deficit |
|
(2,052,718 |
) |
|
(1,977,639 |
) | ||
|
|
|
|
|
|
| |||
| Total stockholders’ equity |
|
1,293,906 |
|
|
351,772 |
| ||
|
|
|
|
|
|
| |||
| Total liabilities, redeemable non-controlling interest and stockholders’ equity |
$ |
1,616,337 |
|
$ |
1,066,769 |
| ||
|
|
|
|
|
|
| |||

QuantumScape Corporation
Consolidated Statements of Operations and Comprehensive Loss
(In Thousands, Except Share and per Share Amounts)
| Three Months Ended March 31, | ||||||||
| 2021 | 2020 | |||||||
| Operating expenses: |
||||||||
| Research and development |
$ |
29,465 |
|
$ |
13,347 |
| ||
| General and administrative |
|
15,210 |
|
|
2,569 |
| ||
|
|
|
|
|
|
| |||
| Total operating expenses |
|
44,675 |
|
|
15,916 |
| ||
|
|
|
|
|
|
| |||
| Loss from operations |
|
(44,675 |
) |
|
(15,916 |
) | ||
| Other (expense) income: |
||||||||
| Interest income |
|
247 |
|
|
538 |
| ||
| Change in fair value of assumed common stock warrant liabilities |
|
(30,764 |
) |
|
— |
| ||
| Other income |
|
103 |
|
|
— |
| ||
|
|
|
|
|
|
| |||
| Total other (expense) income |
|
(30,414 |
) |
|
538 |
| ||
|
|
|
|
|
|
| |||
| Net loss |
|
(75,089 |
) |
|
(15,378 |
) | ||
| Less: Net (loss) income attributable to non-controlling interest, net of tax of $0 for the three months ended March 31, 2021 and 2020 |
|
(10 |
) |
|
(4 |
) | ||
|
|
|
|
|
|
| |||
| Net loss attributable to common stockholders |
$ |
(75,079 |
) |
$ |
(15,374 |
) | ||
|
|
|
|
|
|
| |||
| Net loss |
$ |
(75,089 |
) |
$ |
(15,378 |
) | ||
| Other comprehensive (loss) income: |
||||||||
| Unrealized gain on marketable securities |
|
174 |
|
|
315 |
| ||
|
|
|
|
|
|
| |||
| Total comprehensive loss |
|
(74,915 |
) |
|
(15,063 |
) | ||
| Less: Comprehensive (loss) income attributable to non-controlling interest |
|
(10 |
) |
|
(4 |
) | ||
|
|
|
|
|
|
| |||
| Comprehensive loss attributable to common stockholders |
$ |
(74,905 |
) |
$ |
(15,059 |
) | ||
|
|
|
|
|
|
| |||
| Basic and Diluted net loss per share |
$ |
(0.20 |
) |
$ |
(0.06 |
) | ||
| Basic and Diluted weighted-average common shares outstanding |
|
368,783,516 |
|
|
239,792,967 |
| ||

QuantumScape Corporation
Consolidated Statements of Cash Flows
(In Thousands)
| Three Months Ended March 31, | ||||||||
| 2021 | 2020 | |||||||
| Operating activities |
||||||||
| Net loss |
$ |
(75,089 |
) |
$ |
(15,378 |
) | ||
| Adjustments to reconcile net loss to net cash used in operating activities: |
||||||||
| Depreciation and amortization |
|
2,201 |
|
|
1,442 |
| ||
| Amortization of right-of-use assets |
|
371 |
|
|
300 |
| ||
| Amortization of premiums and accretion of discounts on marketable securities |
|
2,410 |
|
|
(53 |
) | ||
| Amortization of strategic premium |
|
(151 |
) |
|
(164 |
) | ||
| Gain on property and equipment disposals |
|
(104 |
) |
|
— |
| ||
| Stock-based compensation expense |
|
11,676 |
|
|
2,197 |
| ||
| Change in fair value of assumed common stock warrant liabilities |
|
30,764 |
|
|
— |
| ||
| Changes in operating assets and liabilities: |
||||||||
| Prepaid expenses and other current assets |
|
2,479 |
|
|
(165 |
) | ||
| Accounts payable, accrued liabilities and accrued compensation |
|
4,252 |
|
|
600 |
| ||
| Operating lease liability |
|
(345 |
) |
|
(260 |
) | ||
|
|
|
|
|
|
| |||
| Net cash used in operating activities |
|
(21,536 |
) |
|
(11,481 |
) | ||
| Investing activities |
||||||||
| Purchases of property and equipment |
|
(13,269 |
) |
|
(4,934 |
) | ||
| Proceeds from disposal of property and equipment |
|
108 |
|
|
— |
| ||
| Proceeds from maturities of marketable securities |
|
111,000 |
|
|
32,000 |
| ||
|
|
|
|
|
|
| |||
| Net cash (used in) provided by investing activities |
|
97,839 |
|
|
27,066 |
| ||
| Financing activities |
||||||||
| Proceeds from exercise of stock options |
|
880 |
|
|
13 |
| ||
| Proceeds from exercise of warrants |
|
109,133 |
|
|
— |
| ||
| Payment of Business Combination share issuance costs |
|
(1,016 |
) |
|
— |
| ||
| Proceeds from issuance of common stock, net of issuance costs paid |
|
463,825 |
|
|
— |
| ||
|
|
|
|
|
|
| |||
| Net cash provided by financing activities |
|
572,822 |
|
|
13 |
| ||
|
|
|
|
|
|
| |||
| Net increase (decrease) in cash, cash equivalents and restricted cash |
|
649,125 |
|
|
15,598 |
| ||
| Cash, cash equivalents and restricted cash at beginning of period |
|
115,409 |
|
|
25,596 |
| ||
|
|
|
|
|
|
| |||
| Cash, cash equivalents and restricted cash at end of period |
$ |
764,534 |
|
$ |
41,194 |
| ||
|
|
|
|
|
|
| |||
| Supplemental disclosure of cash flow information |
||||||||
| Purchases of property and equipment, accrued but not paid |
$ |
8,944 |
|
$ |
1,423 |
| ||
| Common stock issuance costs, accrued but not paid |
$ |
899 |
|
$ |
— |
| ||
| Fair value of assumed common stock warrants exercised |
$ |
432,424 |
|
$ |
— |
| ||

Net Loss to Adjusted EBITDA
Adjusted EBITDA is a non-GAAP supplemental measure of operating performance that does not represent and should not be considered an alternative to operating loss or cash flow from operations, as determined by GAAP. Adjusted EBITDA is defined as net income (loss) before interest expense, non-controlling interest, revaluations, stock-based compensation and depreciation and amortization expense. We use Adjusted EBITDA to measure the operating performance of our business, excluding specifically identified items that we do not believe directly reflect our core operations and may not be indicative of our recurring operations. Adjusted EBITDA may not be comparable to similarly titled measures provided by other companies due to potential differences in methods of calculations. A reconciliation of Adjusted EBITDA to net loss is as follows:
| ($ in Thousands) | Three Months Ended March 31, | |||||||
| 2021 | 2020 | |||||||
| GAAP net loss attributable to QuantumScape |
$ |
(75,079 |
) |
$ |
(15,374 |
) | ||
| Interest expense (income), net |
|
(247 |
) |
|
(538 |
) | ||
| Other expense (income), net |
|
(103 |
) |
|
- |
| ||
| Change in fair value of assumed common stock warrant liabilities |
|
30,764 |
|
|
- |
| ||
| Net gain (loss) attributable to non-controlling interests |
|
(10 |
) |
|
(4 |
) | ||
| Stock-based compensation |
|
11,676 |
|
|
2,197 |
| ||
|
|
|
|
|
|
| |||
| Non-GAAP operating loss |
$ |
(32,999 |
) |
$ |
(13,719 |
) | ||
| Depreciation and amortization expense |
|
2,050 |
|
|
1,278 |
| ||
|
|
|
|
|
|
| |||
| Adjusted EBITDA |
$ |
(30,949 |
) |
$ |
(12,441 |
) | ||
|
|
|
|
|
|
| |||
Management’s Use of Non-GAAP Financial Measures
This letter includes certain non-GAAP financial measures as defined by SEC rules. These non-GAAP financial measures are in addition to, and not a substitute for or superior to, measures of financial performance prepared in accordance with U.S. GAAP. There are a number of limitations related to the use of these non-GAAP financial measures versus their nearest GAAP equivalents. For example, other companies may calculate non-GAAP financial measures differently or may use other measures to evaluate their performance, all of which could reduce the usefulness of our non-GAAP financial measures as tools for comparison. We urge you to review the reconciliations of our non-GAAP financial measures to the most directly comparable U.S. GAAP financial measures set forth in this letter, and not to rely on any single financial measure to evaluate our business.

Forward-Looking Statements
This current report contains forward-looking statements within the meaning of the federal securities laws and information based on management’s current expectations as of the date of this current report. All statements other than statements of historical fact contained in this current report, including statements regarding the future development of the Company’s battery technology, the anticipated benefits of the Company’s technologies and the performance of its batteries, plans and objectives for future operations, forecasted cash usage, including spending and investment, are forward-looking statements. When used in this current report, the words “may,” “will,” “estimate,” “pro forma,” “expect,” “plan,” “believe,” “potential,” “predict,” “target,” “should,” “would,” “could,” “continue,” “believe,” “project,” “intend,” “anticipates” the negative of such terms and other similar expressions are intended to identify forward-looking statements, although not all forward-looking statements contain such identifying words. These forward-looking statements are based on management’s current expectations, assumptions, hopes, beliefs, intentions, and strategies regarding future events and are based on currently available information as to the outcome and timing of future events.
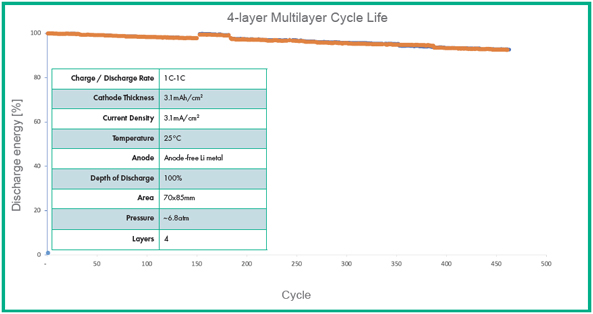
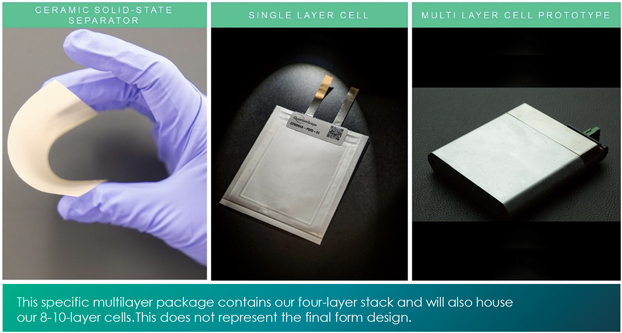
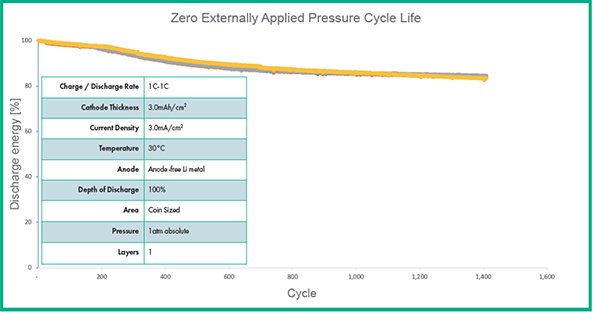
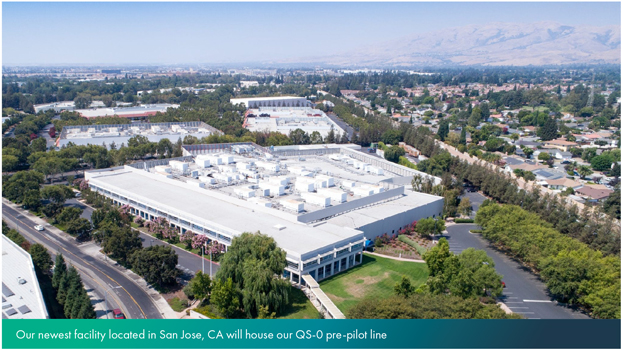
These forward-looking statements involve significant risks and uncertainties that could cause the actual results to differ materially from the expected results. Many of these factors are outside the Company’s control and are difficult to predict. Factors that may cause such differences include, but are not limited to ones listed here. The Company faces significant barriers in its attempts to produce a solid-state battery cell and may not be able to successfully develop its solid-state battery cell. Building high volumes of multi-layer cells in the commercial form factor and with higher layer count requires substantial development effort. The Company could encounter significant delays and/or technical challenges in replicating the performance seen in its single-layer cells and early tests of the smaller form factor four-layer cells and in achieving the high yield, reliability, uniformity and performance targets required for commercial production and sale. The Company may encounter delays and other obstacles in acquiring, installing and operating new manufacturing equipment for automated and/or continuous-flow processes, including vendor delays (which we have already experienced) and challenges optimizing complex manufacturing processes. The Company may encounter delays in hiring the engineers it needs to expand its development and production efforts, delays in acquiring the facility for QS-0, and delays caused by the COVID-19 pandemic. Delays in increasing production of engineering samples would slow the Company’s development efforts. The Company may be unable to adequately control the costs associated with its operations and the components necessary to build its solid-state battery cells at competitive prices. The Company’s spending may be higher than currently anticipated. The final closing under the Company’s financing agreement with VW may not occur if the Company does not achieve certain interim technical targets by the end of the quarter. The Company may not be successful in competing in the battery market industry or establishing and maintaining confidence in its long-term business prospectus among current and future partners and customers and the duration and impact of the COVID-19 pandemic on the Company’s business. The Company cautions that the foregoing list of factors is not exclusive. The Company cautions readers not to place undue reliance upon any forward-looking statements, which speak only as of the date made.
Except as otherwise required by applicable law, the Company disclaims any duty to update any forward-looking statements. Should underlying assumptions prove incorrect, actual results and projections could differ materially from those expressed in any forward-looking statements. Additional information concerning these and other factors that could materially affect the Company’s actual results can be found in the Company’s periodic filings with the SEC. The Company’s SEC filings are available publicly on the SEC’s website at www.sec.gov.


