Attached files
| file | filename |
|---|---|
| EX-99.2 - EX-99.2 - Opendoor Technologies Inc. | exhibit9921q21opendoorsh.htm |
| EX-99.1 - EX-99.1 - Opendoor Technologies Inc. | q12021form8-kxexhibit991.htm |
| 8-K - 8-K - Opendoor Technologies Inc. | open-20210511.htm |
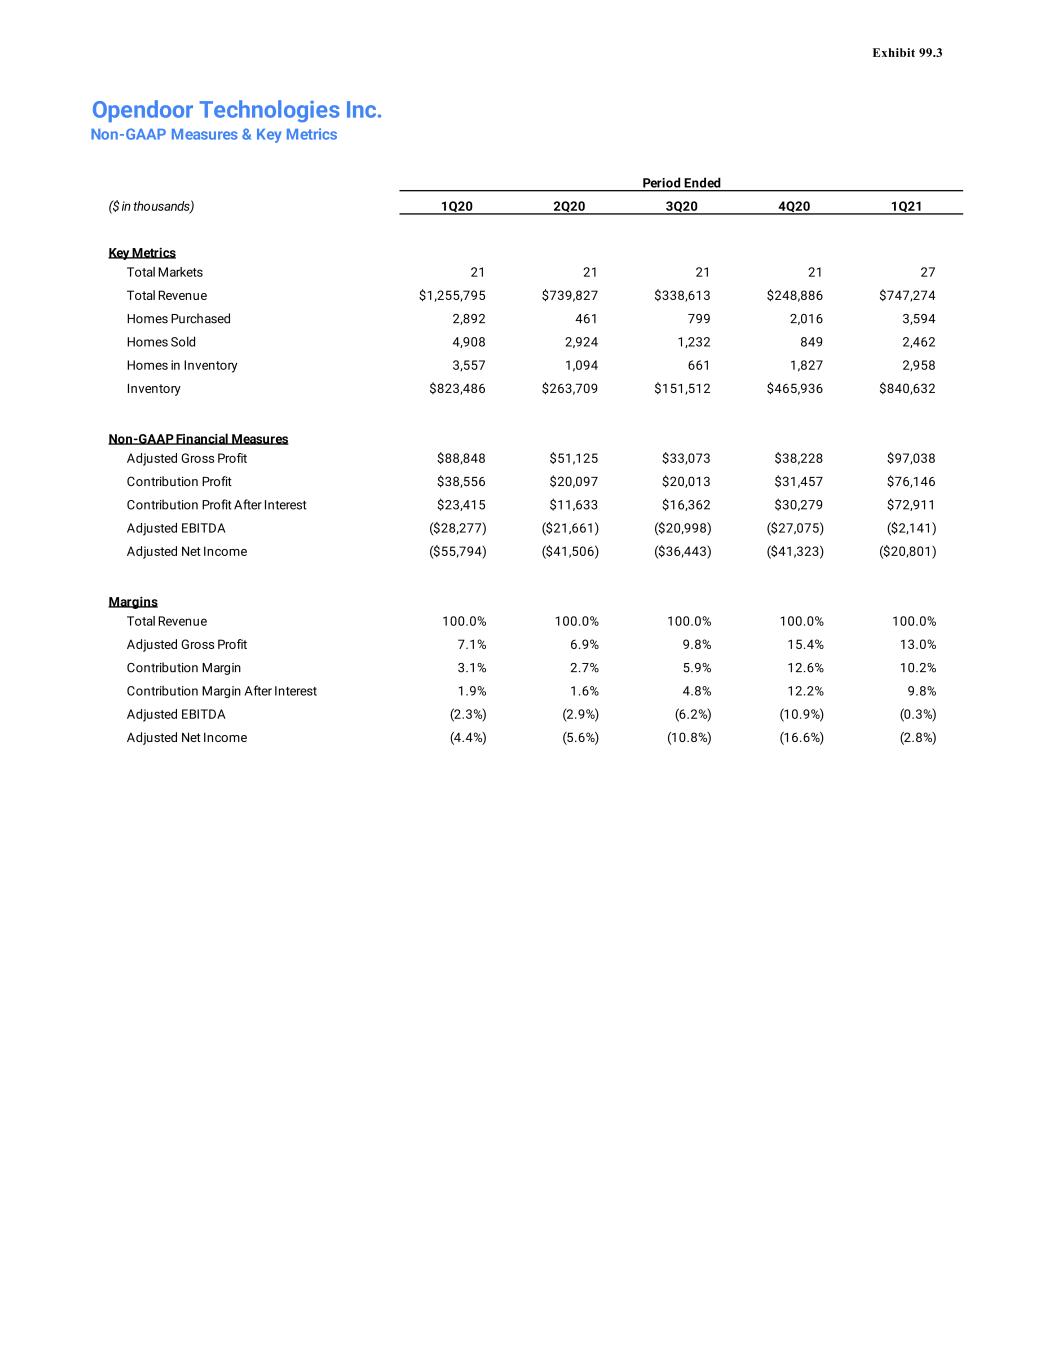
Opendoor Technologies Inc. Non-GAAP Measures & Key Metrics ($ in thousands) 1Q20 2Q20 3Q20 4Q20 1Q21 Key Metrics Total Markets 21 21 21 21 27 Total Revenue $1,255,795 $739,827 $338,613 $248,886 $747,274 Homes Purchased 2,892 461 799 2,016 3,594 Homes Sold 4,908 2,924 1,232 849 2,462 Homes in Inventory 3,557 1,094 661 1,827 2,958 Inventory $823,486 $263,709 $151,512 $465,936 $840,632 Non-GAAP Financial Measures Adjusted Gross Profit $88,848 $51,125 $33,073 $38,228 $97,038 Contribution Profit $38,556 $20,097 $20,013 $31,457 $76,146 Contribution Profit After Interest $23,415 $11,633 $16,362 $30,279 $72,911 Adjusted EBITDA ($28,277) ($21,661) ($20,998) ($27,075) ($2,141) Adjusted Net Income ($55,794) ($41,506) ($36,443) ($41,323) ($20,801) Margins Total Revenue 100.0% 100.0% 100.0% 100.0% 100.0% Adjusted Gross Profit 7.1% 6.9% 9.8% 15.4% 13.0% Contribution Margin 3.1% 2.7% 5.9% 12.6% 10.2% Contribution Margin After Interest 1.9% 1.6% 4.8% 12.2% 9.8% Adjusted EBITDA (2.3%) (2.9%) (6.2%) (10.9%) (0.3%) Adjusted Net Income (4.4%) (5.6%) (10.8%) (16.6%) (2.8%) Period Ended Exhibit 99.3
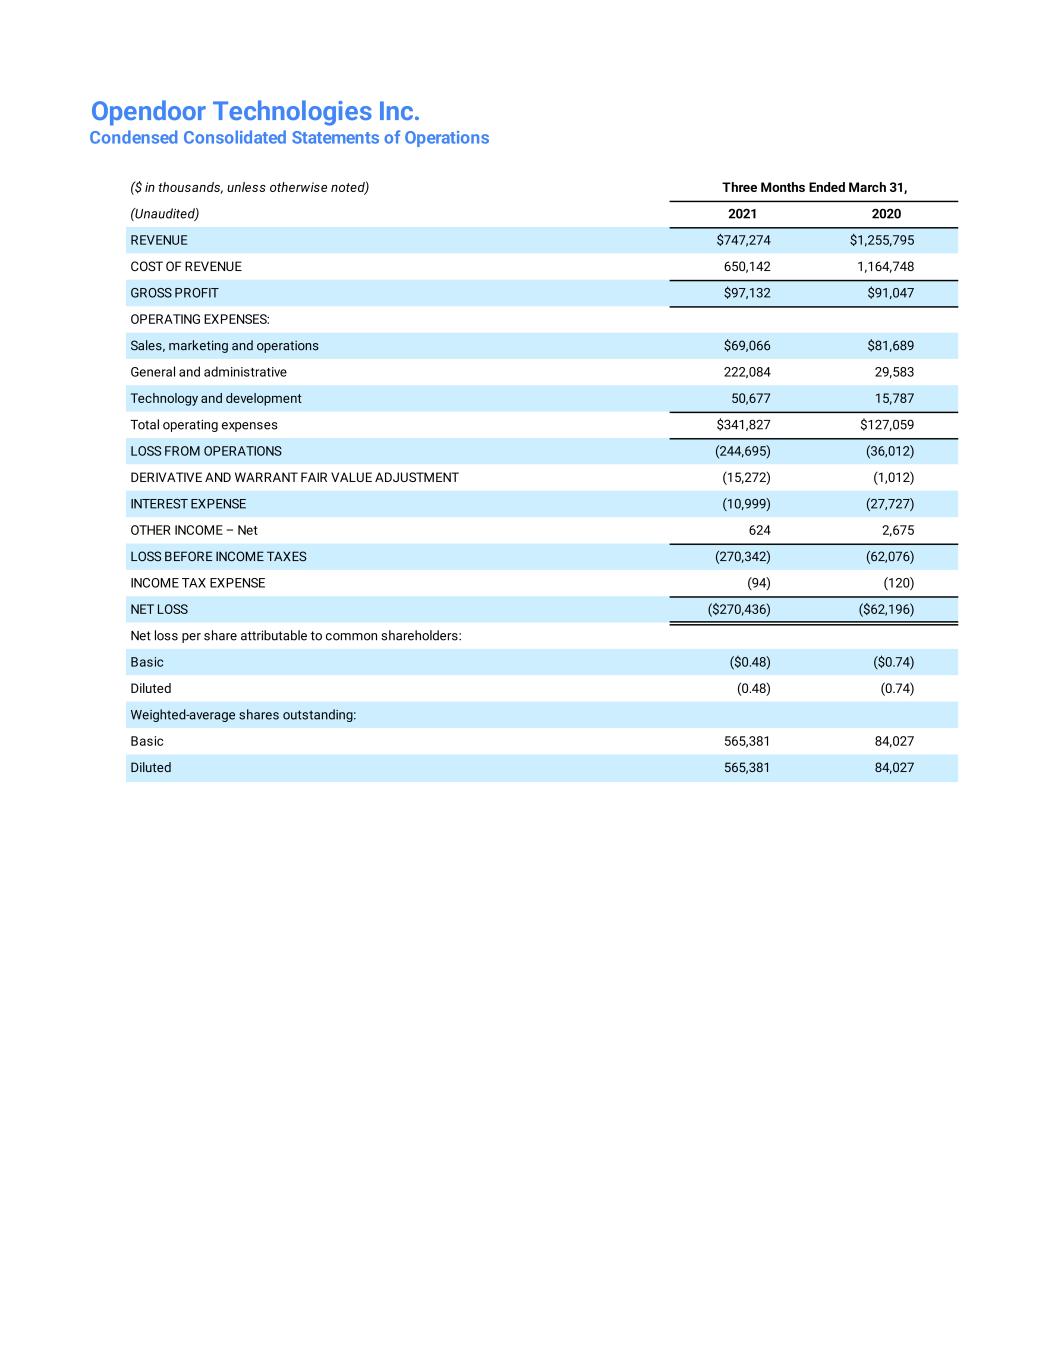
Opendoor Technologies Inc. Condensed Consolidated Statements of Operations ($ in thousands, unless otherwise noted) (Unaudited) 2021 2020 REVENUE $747,274 $1,255,795 COST OF REVENUE 650,142 1,164,748 GROSS PROFIT $97,132 $91,047 OPERATING EXPENSES: Sales, marketing and operations $69,066 $81,689 General and administrative 222,084 29,583 Technology and development 50,677 15,787 Total operating expenses $341,827 $127,059 LOSS FROM OPERATIONS (244,695) (36,012) DERIVATIVE AND WARRANT FAIR VALUE ADJUSTMENT (15,272) (1,012) INTEREST EXPENSE (10,999) (27,727) OTHER INCOME – Net 624 2,675 LOSS BEFORE INCOME TAXES (270,342) (62,076) INCOME TAX EXPENSE (94) (120) NET LOSS ($270,436) ($62,196) Net loss per share attributable to common shareholders: Basic ($0.48) ($0.74) Diluted (0.48) (0.74) Weighted-average shares outstanding: Basic 565,381 84,027 Diluted 565,381 84,027 Three Months Ended March 31,
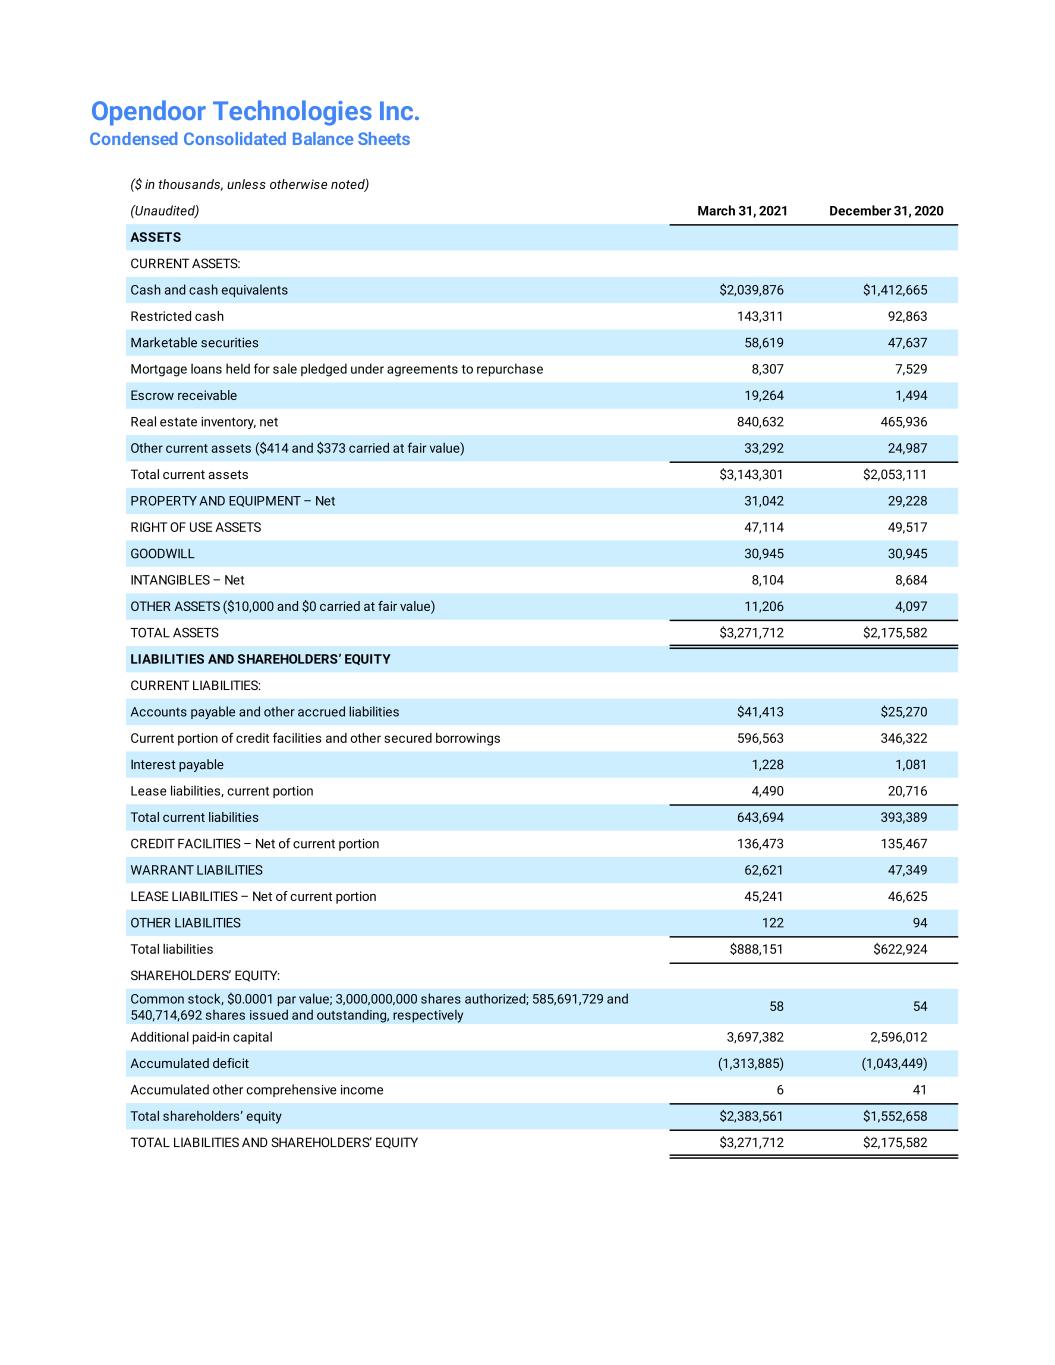
Opendoor Technologies Inc. Condensed Consolidated Balance Sheets ($ in thousands, unless otherwise noted) (Unaudited) March 31, 2021 December 31, 2020 ASSETS CURRENT ASSETS: Cash and cash equivalents $2,039,876 $1,412,665 Restricted cash 143,311 92,863 Marketable securities 58,619 47,637 Mortgage loans held for sale pledged under agreements to repurchase 8,307 7,529 Escrow receivable 19,264 1,494 Real estate inventory, net 840,632 465,936 Other current assets ($414 and $373 carried at fair value) 33,292 24,987 Total current assets $3,143,301 $2,053,111 PROPERTY AND EQUIPMENT – Net 31,042 29,228 RIGHT OF USE ASSETS 47,114 49,517 GOODWILL 30,945 30,945 INTANGIBLES – Net 8,104 8,684 OTHER ASSETS ($10,000 and $0 carried at fair value) 11,206 4,097 TOTAL ASSETS $3,271,712 $2,175,582 LIABILITIES AND SHAREHOLDERS’ EQUITY CURRENT LIABILITIES: Accounts payable and other accrued liabilities $41,413 $25,270 Current portion of credit facilities and other secured borrowings 596,563 346,322 Interest payable 1,228 1,081 Lease liabilities, current portion 4,490 20,716 Total current liabilities 643,694 393,389 CREDIT FACILITIES – Net of current portion 136,473 135,467 WARRANT LIABILITIES 62,621 47,349 LEASE LIABILITIES – Net of current portion 45,241 46,625 OTHER LIABILITIES 122 94 Total liabilities $888,151 $622,924 SHAREHOLDERS’ EQUITY: Common stock, $0.0001 par value; 3,000,000,000 shares authorized; 585,691,729 and 540,714,692 shares issued and outstanding, respectively 58 54 Additional paid-in capital 3,697,382 2,596,012 Accumulated deficit (1,313,885) (1,043,449) Accumulated other comprehensive income 6 41 Total shareholders’ equity $2,383,561 $1,552,658 TOTAL LIABILITIES AND SHAREHOLDERS’ EQUITY $3,271,712 $2,175,582
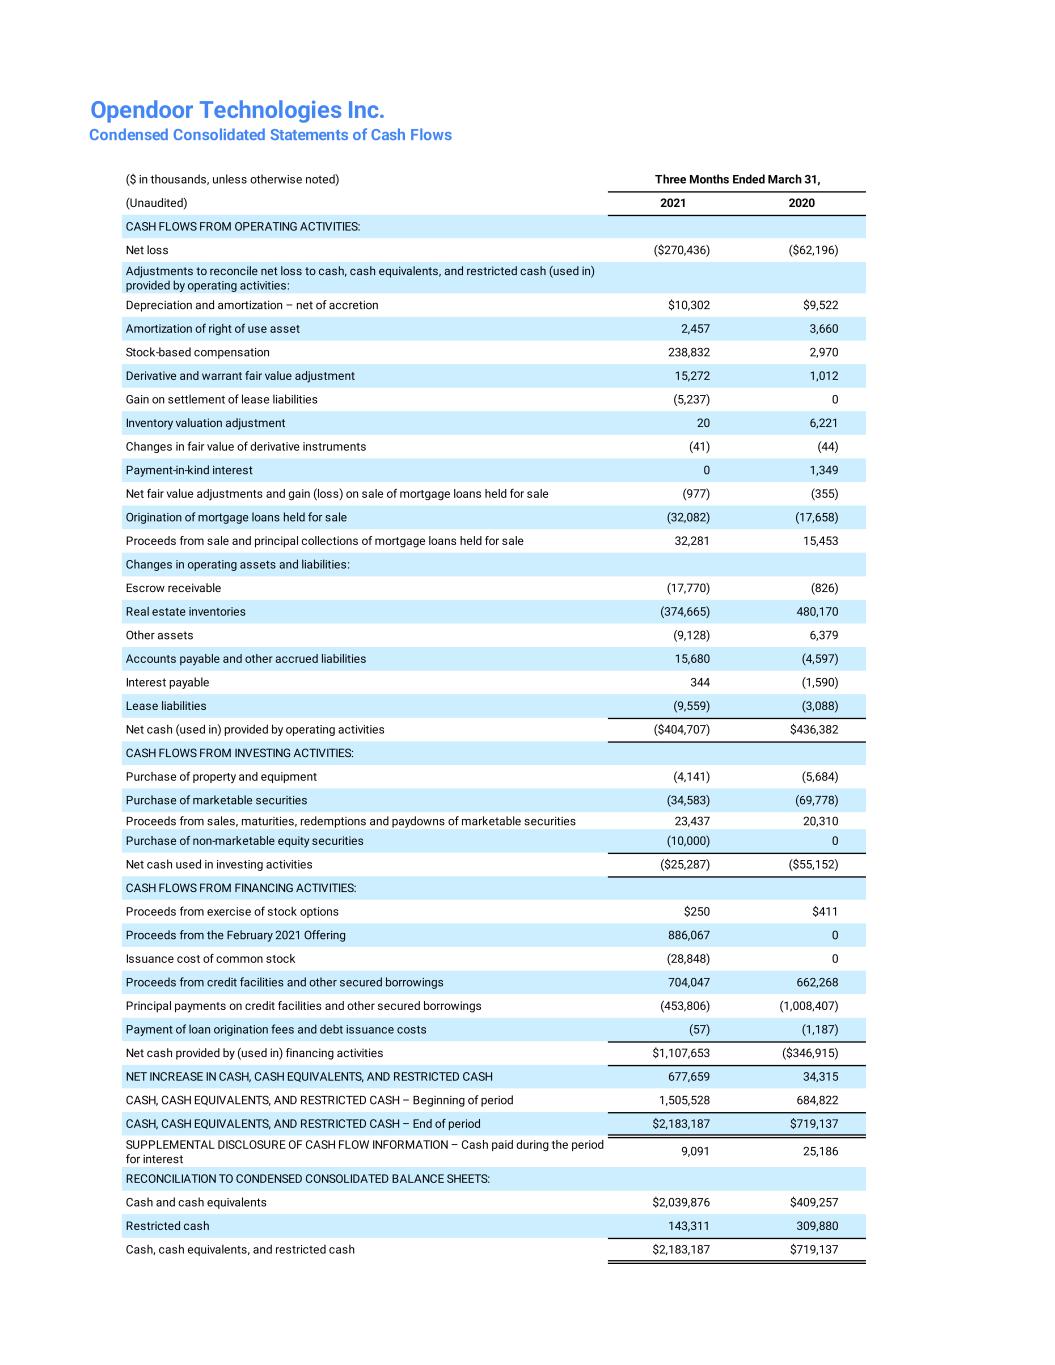
Opendoor Technologies Inc. Condensed Consolidated Statements of Cash Flows ($ in thousands, unless otherwise noted) (Unaudited) 2021 2020 CASH FLOWS FROM OPERATING ACTIVITIES: Net loss ($270,436) ($62,196) Adjustments to reconcile net loss to cash, cash equivalents, and restricted cash (used in) provided by operating activities: Depreciation and amortization – net of accretion $10,302 $9,522 Amortization of right of use asset 2,457 3,660 Stock-based compensation 238,832 2,970 Derivative and warrant fair value adjustment 15,272 1,012 Gain on settlement of lease liabilities (5,237) 0 Inventory valuation adjustment 20 6,221 Changes in fair value of derivative instruments (41) (44) Payment-in-kind interest 0 1,349 Net fair value adjustments and gain (loss) on sale of mortgage loans held for sale (977) (355) Origination of mortgage loans held for sale (32,082) (17,658) Proceeds from sale and principal collections of mortgage loans held for sale 32,281 15,453 Changes in operating assets and liabilities: Escrow receivable (17,770) (826) Real estate inventories (374,665) 480,170 Other assets (9,128) 6,379 Accounts payable and other accrued liabilities 15,680 (4,597) Interest payable 344 (1,590) Lease liabilities (9,559) (3,088) Net cash (used in) provided by operating activities ($404,707) $436,382 CASH FLOWS FROM INVESTING ACTIVITIES: Purchase of property and equipment (4,141) (5,684) Purchase of marketable securities (34,583) (69,778) Proceeds from sales, maturities, redemptions and paydowns of marketable securities 23,437 20,310 Purchase of non-marketable equity securities (10,000) 0 Net cash used in investing activities ($25,287) ($55,152) CASH FLOWS FROM FINANCING ACTIVITIES: Proceeds from exercise of stock options $250 $411 Proceeds from the February 2021 Offering 886,067 0 Issuance cost of common stock (28,848) 0 Proceeds from credit facilities and other secured borrowings 704,047 662,268 Principal payments on credit facilities and other secured borrowings (453,806) (1,008,407) Payment of loan origination fees and debt issuance costs (57) (1,187) Net cash provided by (used in) financing activities $1,107,653 ($346,915) NET INCREASE IN CASH, CASH EQUIVALENTS, AND RESTRICTED CASH 677,659 34,315 CASH, CASH EQUIVALENTS, AND RESTRICTED CASH – Beginning of period 1,505,528 684,822 CASH, CASH EQUIVALENTS, AND RESTRICTED CASH – End of period $2,183,187 $719,137 SUPPLEMENTAL DISCLOSURE OF CASH FLOW INFORMATION – Cash paid during the period for interest 9,091 25,186 RECONCILIATION TO CONDENSED CONSOLIDATED BALANCE SHEETS: Cash and cash equivalents $2,039,876 $409,257 Restricted cash 143,311 309,880 Cash, cash equivalents, and restricted cash $2,183,187 $719,137 Three Months Ended March 31,
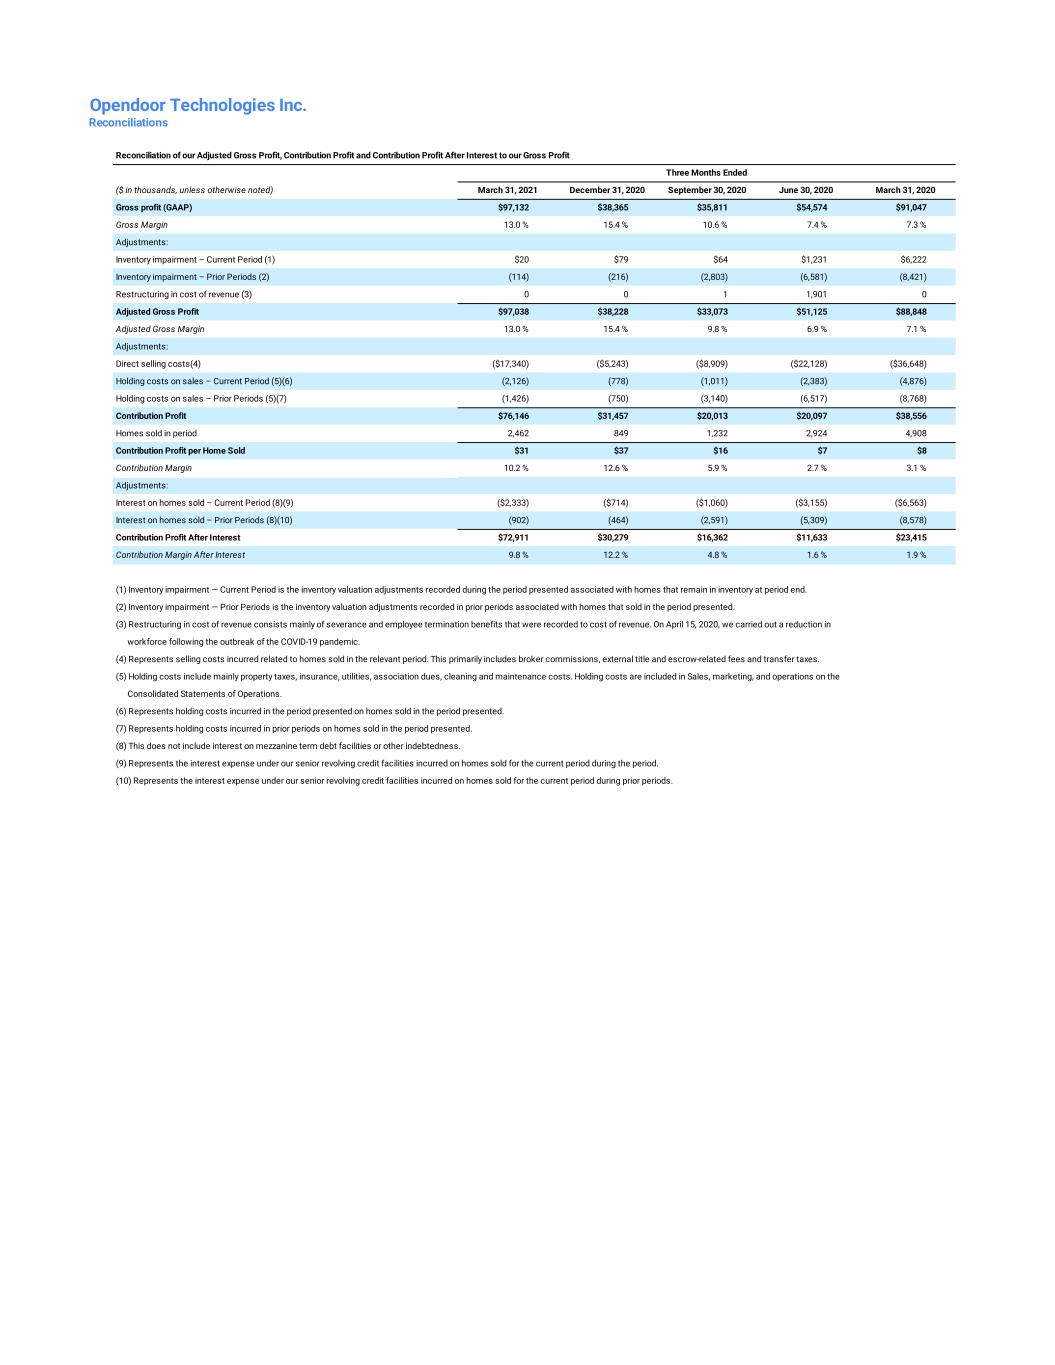
Opendoor Technologies Inc. Reconciliations ($ in thousands, unless otherwise noted) March 31, 2021 December 31, 2020 September 30, 2020 June 30, 2020 March 31, 2020 Gross profit (GAAP) $97,132 $38,365 $35,811 $54,574 $91,047 Gross Margin 13.0 % 15.4 % 10.6 % 7.4 % 7.3 % Adjustments: Inventory impairment – Current Period (1) $20 $79 $64 $1,231 $6,222 Inventory impairment – Prior Periods (2) (114) (216) (2,803) (6,581) (8,421) Restructuring in cost of revenue (3) 0 0 1 1,901 0 Adjusted Gross Profit $97,038 $38,228 $33,073 $51,125 $88,848 Adjusted Gross Margin 13.0 % 15.4 % 9.8 % 6.9 % 7.1 % Adjustments: Direct selling costs(4) ($17,340) ($5,243) ($8,909) ($22,128) ($36,648) Holding costs on sales – Current Period (5)(6) (2,126) (778) (1,011) (2,383) (4,876) Holding costs on sales – Prior Periods (5)(7) (1,426) (750) (3,140) (6,517) (8,768) Contribution Profit $76,146 $31,457 $20,013 $20,097 $38,556 Homes sold in period 2,462 849 1,232 2,924 4,908 Contribution Profit per Home Sold $31 $37 $16 $7 $8 Contribution Margin 10.2 % 12.6 % 5.9 % 2.7 % 3.1 % Adjustments: Interest on homes sold – Current Period (8)(9) ($2,333) ($714) ($1,060) ($3,155) ($6,563) Interest on homes sold – Prior Periods (8)(10) (902) (464) (2,591) (5,309) (8,578) Contribution Profit After Interest $72,911 $30,279 $16,362 $11,633 $23,415 Contribution Margin After Interest 9.8 % 12.2 % 4.8 % 1.6 % 1.9 % (1) Inventory impairment — Current Period is the inventory valuation adjustments recorded during the period presented associated with homes that remain in inventory at period end. (2) Inventory impairment — Prior Periods is the inventory valuation adjustments recorded in prior periods associated with homes that sold in the period presented. (3) Restructuring in cost of revenue consists mainly of severance and employee termination benefits that were recorded to cost of revenue. On April 15, 2020, we carried out a reduction in workforce following the outbreak of the COVID-19 pandemic. (4) Represents selling costs incurred related to homes sold in the relevant period. This primarily includes broker commissions, external title and escrow-related fees and transfer taxes. (5) Holding costs include mainly property taxes, insurance, utilities, association dues, cleaning and maintenance costs. Holding costs are included in Sales, marketing, and operations on the Consolidated Statements of Operations. (6) Represents holding costs incurred in the period presented on homes sold in the period presented. (7) Represents holding costs incurred in prior periods on homes sold in the period presented. (8) This does not include interest on mezzanine term debt facilities or other indebtedness. (9) Represents the interest expense under our senior revolving credit facilities incurred on homes sold for the current period during the period. (10) Represents the interest expense under our senior revolving credit facilities incurred on homes sold for the current period during prior periods. Reconciliation of our Adjusted Gross Profit, Contribution Profit and Contribution Profit After Interest to our Gross Profit Three Months Ended
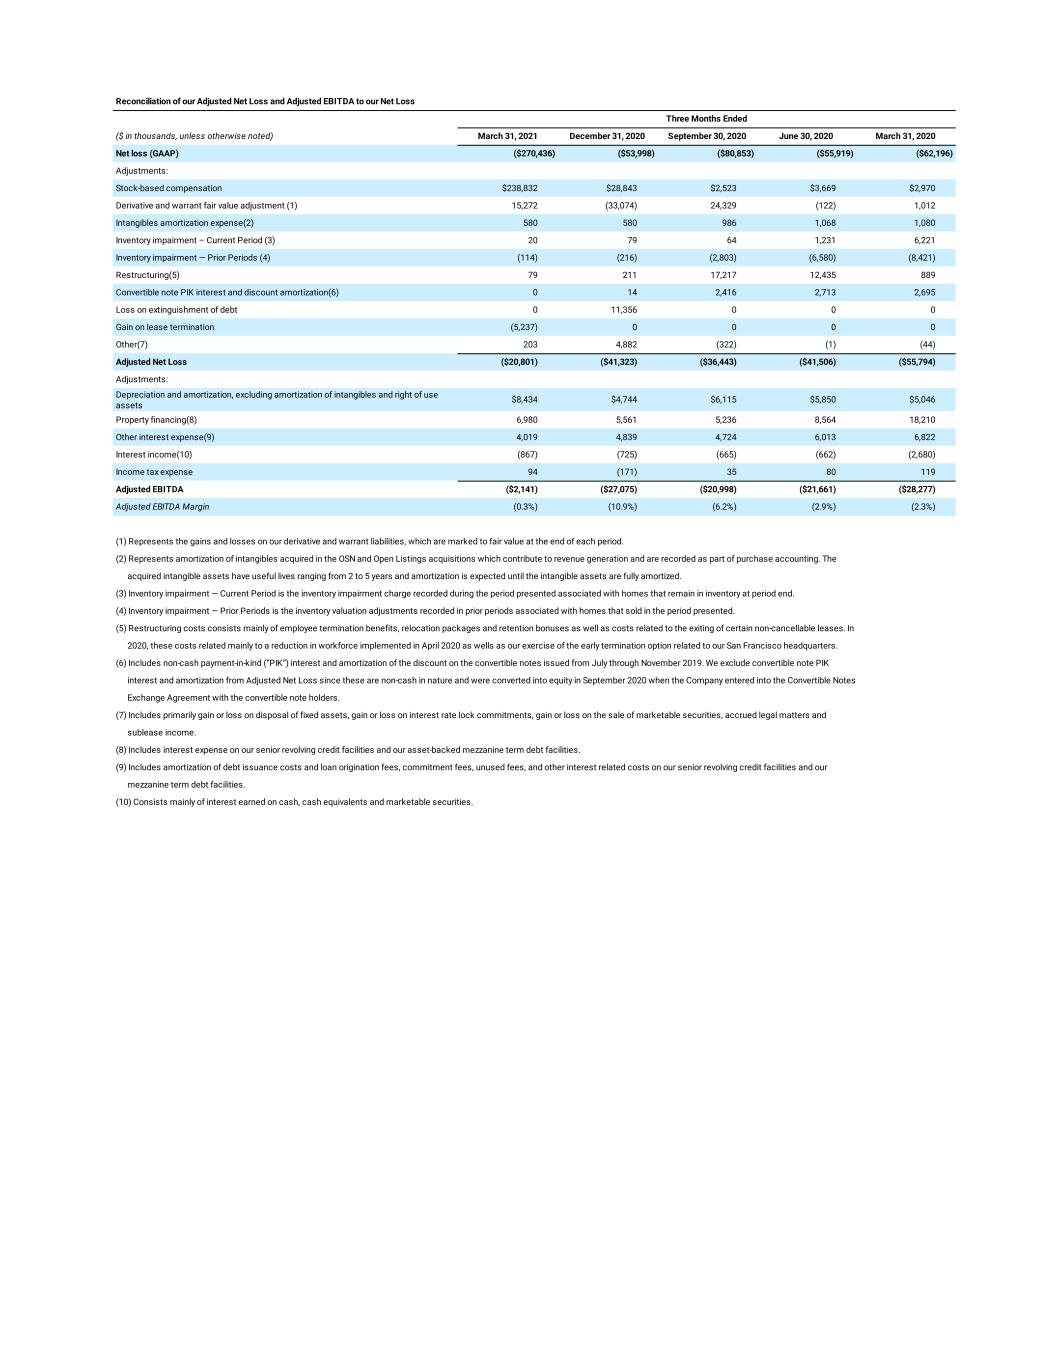
($ in thousands, unless otherwise noted) March 31, 2021 December 31, 2020 September 30, 2020 June 30, 2020 March 31, 2020 Net loss (GAAP) ($270,436) ($53,998) ($80,853) ($55,919) ($62,196) Adjustments: Stock-based compensation $238,832 $28,843 $2,523 $3,669 $2,970 Derivative and warrant fair value adjustment (1) 15,272 (33,074) 24,329 (122) 1,012 Intangibles amortization expense(2) 580 580 986 1,068 1,080 Inventory impairment – Current Period (3) 20 79 64 1,231 6,221 Inventory impairment — Prior Periods (4) (114) (216) (2,803) (6,580) (8,421) Restructuring(5) 79 211 17,217 12,435 889 Convertible note PIK interest and discount amortization(6) 0 14 2,416 2,713 2,695 Loss on extinguishment of debt 0 11,356 0 0 0 Gain on lease termination (5,237) 0 0 0 0 Other(7) 203 4,882 (322) (1) (44) Adjusted Net Loss ($20,801) ($41,323) ($36,443) ($41,506) ($55,794) Adjustments: Depreciation and amortization, excluding amortization of intangibles and right of use assets $8,434 $4,744 $6,115 $5,850 $5,046 Property financing(8) 6,980 5,561 5,236 8,564 18,210 Other interest expense(9) 4,019 4,839 4,724 6,013 6,822 Interest income(10) (867) (725) (665) (662) (2,680) Income tax expense 94 (171) 35 80 119 Adjusted EBITDA ($2,141) ($27,075) ($20,998) ($21,661) ($28,277) Adjusted EBITDA Margin (0.3%) (10.9%) (6.2%) (2.9%) (2.3%) (1) Represents the gains and losses on our derivative and warrant liabilities, which are marked to fair value at the end of each period. (2) Represents amortization of intangibles acquired in the OSN and Open Listings acquisitions which contribute to revenue generation and are recorded as part of purchase accounting. The acquired intangible assets have useful lives ranging from 2 to 5 years and amortization is expected until the intangible assets are fully amortized. (3) Inventory impairment — Current Period is the inventory impairment charge recorded during the period presented associated with homes that remain in inventory at period end. (4) Inventory impairment — Prior Periods is the inventory valuation adjustments recorded in prior periods associated with homes that sold in the period presented. (5) Restructuring costs consists mainly of employee termination benefits, relocation packages and retention bonuses as well as costs related to the exiting of certain non-cancellable leases. In 2020, these costs related mainly to a reduction in workforce implemented in April 2020 as wells as our exercise of the early termination option related to our San Francisco headquarters. (6) Includes non-cash payment-in-kind (“PIK”) interest and amortization of the discount on the convertible notes issued from July through November 2019. We exclude convertible note PIK interest and amortization from Adjusted Net Loss since these are non-cash in nature and were converted into equity in September 2020 when the Company entered into the Convertible Notes Exchange Agreement with the convertible note holders. (7) Includes primarily gain or loss on disposal of fixed assets, gain or loss on interest rate lock commitments, gain or loss on the sale of marketable securities, accrued legal matters and sublease income. (8) Includes interest expense on our senior revolving credit facilities and our asset-backed mezzanine term debt facilities. (9) Includes amortization of debt issuance costs and loan origination fees, commitment fees, unused fees, and other interest related costs on our senior revolving credit facilities and our mezzanine term debt facilities. (10) Consists mainly of interest earned on cash, cash equivalents and marketable securities. Reconciliation of our Adjusted Net Loss and Adjusted EBITDA to our Net Loss Three Months Ended
