Attached files
| file | filename |
|---|---|
| EX-99.1 - EXHIBIT 99.1 - AFC Gamma, Inc. | brhc10024317_ex99-1.htm |
| 8-K - 8-K - AFC Gamma, Inc. | brhc10024317_8k.htm |
Exhibit 99.2

AFC Gamma Q1 2021 Earnings PresentationMay 11, 2021
Forward Looking Statements Some of the statements contained in this presentation constitute
forward-looking statements, within the meaning of the Private Securities Litigation Reform Act of 1995 and Section 21E of the Securities Exchange Act of 1934, as amended (the “Exchange Act”), and we intend such statements to be covered by the
safe harbor provisions contained therein. The information contained in this section should be read in conjunction with our financial statements and notes thereto appearing elsewhere in our quarterly report on Form 10-Q for the quarter ended
March 31, 2021. This description contains forward-looking statements that involve risks and uncertainties. Actual results could differ significantly from the results discussed in the forward-looking statements due to the factors set forth in
“Risk Factors” in the final prospectus relating to our IPO filed with the Securities and Exchange Commission (“SEC”) in accordance with Rule 424(b) of the Securities Act of 1933, as amended on March 19, 2021 (“Final Prospectus”). In addition,
some of the statements in this presentation constitute forward-looking statements, which relate to future events or the future performance or financial condition of AFC Gamma, Inc. (“AFCG” and the “Company,” “we,” “us” and “our”). The
forward-looking statements contained in this presentation involve a number of risks and uncertainties, including statements concerning: our business and investment strategy; our projected operating results including our projections for
distributable earnings for the second quarter of 2021; the impact of the COVID-19 pandemic, on our business and the United States and global economies; the ability of our Manager to locate suitable loan opportunities for us, monitor, service
and administer our loans and execute our investment strategy; allocation of loan opportunities to us by our Manager; our projected operating results; actions and initiatives of the U.S. or state governments and changes to government policies
and the execution and impact of these actions, initiatives and policies, including the fact that cannabis remains illegal under federal law; the state of the United States, European Union and Asian economies generally or in specific
geographic regions; the estimated growth in and evolving market dynamics of the cannabis market; the demand for cannabis cultivation and processing facilities; shifts in public opinion regarding cannabis; the state of the U.S. economy
generally or in specific geographic regions; economic trends and economic recoveries; the collectability and timing of cash flows, if any, from our loans; our ability to obtain and maintain financing arrangements; our expected leverage;
changes in the value of our loans; our expected portfolio of loans; our expected investment and underwriting process; rates of default or decreased recovery rates on our loans; the degree to which our hedging strategies may or may not protect
us from interest rate volatility; changes in interest rates of our loans and impacts of such changes on our results of operations, cash flows and the market value of our loans; interest rate mismatches between our loans and our borrowings
used to fund such loans; the departure of any of the executive officers or key personnel supporting and assisting us from our Manager or its affiliates; impact of and changes in governmental regulations, tax law and rates, accounting guidance
and similar matters; our ability to maintain our exemption from registration under the Investment Company Act of 1940 (the “1940 Act”); our ability to qualify and maintain our qualification as a real estate investment trust (“REIT”) for
United States federal income tax purposes; estimates relating to our ability to make distributions to our stockholders in the future; our understanding of our competition; market trends in our industry, interest rates, real estate values, the
securities markets or the general economy.We use words such as “anticipates,” “believes,” “expects,” “intends,” “will,” “should,” “may” and similar expressions to identify forward-looking statements, although not all forward-looking
statements include these words. Our actual results and financial condition could differ materially from those implied or expressed in the forward-looking statements for any reason, including the factors set forth in “Risk Factors” and the
other information included in our Final Prospectus and elsewhere in our quarterly report on Form 10-Q for the quarter ended March 31, 2021. We have based the forward-looking statements included in this presentation on information available to
us on the date of this presentation, and we assume no obligation to update any such forward-looking statements. Although we undertake no obligation to revise or update any forward-looking statements, whether as a result of new information,
future events or otherwise, you are advised to consult any additional disclosures that we may make directly to you or through reports that we have filed or in the future may file with the SEC, including annual reports on Form 10-K,
registration statements on Form S-11, quarterly reports on Form 10-Q and current reports on Form 8-K .
Legal Disclaimers Important Notices This presentation is by AFC Gamma, Inc., a publicly traded company
that will elect to be taxed as a REIT for federal income tax purposes and is being furnished in connection with AFCG’s First Quarter 2021 results. This presentation is provided for investors in AFCG for informational purposes only and is not
an offer to sell, or a solicitation of an offer to buy, any security or instrument. AFCG is not a registered investment adviser. AFCG is managed by AFC Management, LLC ("AFCM"), a registered investment adviser. This presentation is not a
communication by AFCM and is not designed to maintain any existing AFCM client or investor or solicit new AFCM clients or investors.We routinely post important information for investors on our website, www.afcgamma.com. We intend to use this
webpage as a means of disclosing material information, for complying with our disclosure obligations under Regulation FD and to post and update investor presentations and similar materials on a regular basis. AFCG encourages investors,
analysts, the media and others interested in AFCG to monitor the Investors section of our website, in addition to following our press releases, SEC filings, public conference calls, presentations, webcasts and other information we post from
time to time on our website. To sign-up for email-notifications, please visit the “Email Alerts” section of our website under the “IR Resources” section and enter the required information to enable notifications. Past performance is no
guarantee of future results. There is no guarantee that any investment strategy referenced herein will work under all market conditions. You alone assume the responsibility of evaluating the merits and risks associated with any potential
investment or investment strategy referenced herein. The information contained herein is not intended to provide, and should not be relied upon for accounting, legal or tax advice or investment recommendations for AFCG or any of its
affiliates. Certain information contained in the presentation discusses general market activity, industry or sector trends, or other broad-based economic, market or political conditions and should not be construed as research or investment
advice. Non-GAAP Financial Measures This presentation includes certain non-GAAP financial measures, including Distributable Earnings to evaluate our performance excluding the effects of certain transactions and certain non-GAAP adjustments
that we believe are not necessarily indicative of our current loan activity and operations. We believe the non-GAAP financial measures are useful for management, investors, analysts, and other interested parties in evaluating our performance
but should not be viewed in isolation and are not a substitute for financial measures computed in accordance with GAAP. The determination of Distributable Earnings is substantially similar to the determination of Core Earnings under our
Management Agreement, provided that Core Earnings is a component of the calculation of any Incentive Fees earned under the Management Agreement for the applicable time period, and thus Core Earnings is calculated prior to Incentive Fee
expense, while the calculation of Distributable Earnings accounts for any Incentive Fees earned for such time period. We define Distributable Earnings as, for a specified period, the net income (loss) computed in accordance with GAAP,
excluding (i) non-cash equity compensation expense, (ii) depreciation and amortization, (iii) any unrealized gains, losses or other non-cash items recorded in net income (loss) for the period, regardless of whether such items are included in
other comprehensive income or loss, or in net income (loss); provided that Distributable Earnings does not exclude, in the case of investments with a deferred interest feature (such as OID, debt instruments with PIK interest and zero coupon
securities), accrued income that we have not yet received in cash, (iv) provision for current expected credit losses and (v) one-time events pursuant to changes in GAAP and certain non-cash charges, in each case after discussions between our
Manager and our independent directors and after approval by a majority of such independent directors.We caution readers that our methodology for calculating Distributable Earnings may differ from the methodologies employed by other REITs to
calculate the same or similar supplemental performance measures, and as a result, our reported Distributable Earnings may not be comparable to similar measures presented by other REITs. We have not provided reconciliations of expected
distributable earnings for the quarter ending June 30, 2021 for distributable earnings, in reliance on the unreasonable efforts exception provided under Item 10(e)(1)(i)(B) of Regulation S-K. We are unable, without unreasonable efforts, to
forecast certain items required to develop meaningful comparable GAAP financial measures. These items include changes in unrealized gains, non-cash equity compensation expenses and the impact of non-cash adjustments for current expected
credit losses that are difficult to predict in advance in order to include in a GAAP estimate.Please see the section entitled “Reconciliation of Distributable Earnings to GAAP Net Income” in the attached Appendix C for a reconciliation to the
most directly comparable GAAP financial measures.

Management Presenters Leonard TannenbaumFounder & Chief Executive Officer Jonathan Kalikow Head
of Real Estate Thomas Geoffroy Chief Financial Officer Robyn TannenbaumPartner, Head of Origination and Investor Relations Brandon Hetzel Controller Over 22 years of experience in credit investingFounder and former Chief Executive Officer
of Fifth Street, a ~$5 billion credit-focused asset manager Over 15 years experience in real estate as part Kalikow Real Estate & Construction, a family-owned real estate firm operating for ~100 yearsCo-Founder of Gamma Real Estate, a $2
billion commercial real estate lender and investor 20 years of experience in accounting and financeFormerly the Chief Financial Officer at United Capital Markets and Controller at Ares Management 11 years of experience primarily in real
estate accountingFormerly Vice President of Finance for El-Ad National Properties Over 7 years of experience in healthcare mergers & acquisitions and leveraged finance at CIT GroupFormer Head of Investor Relations at Fifth Street
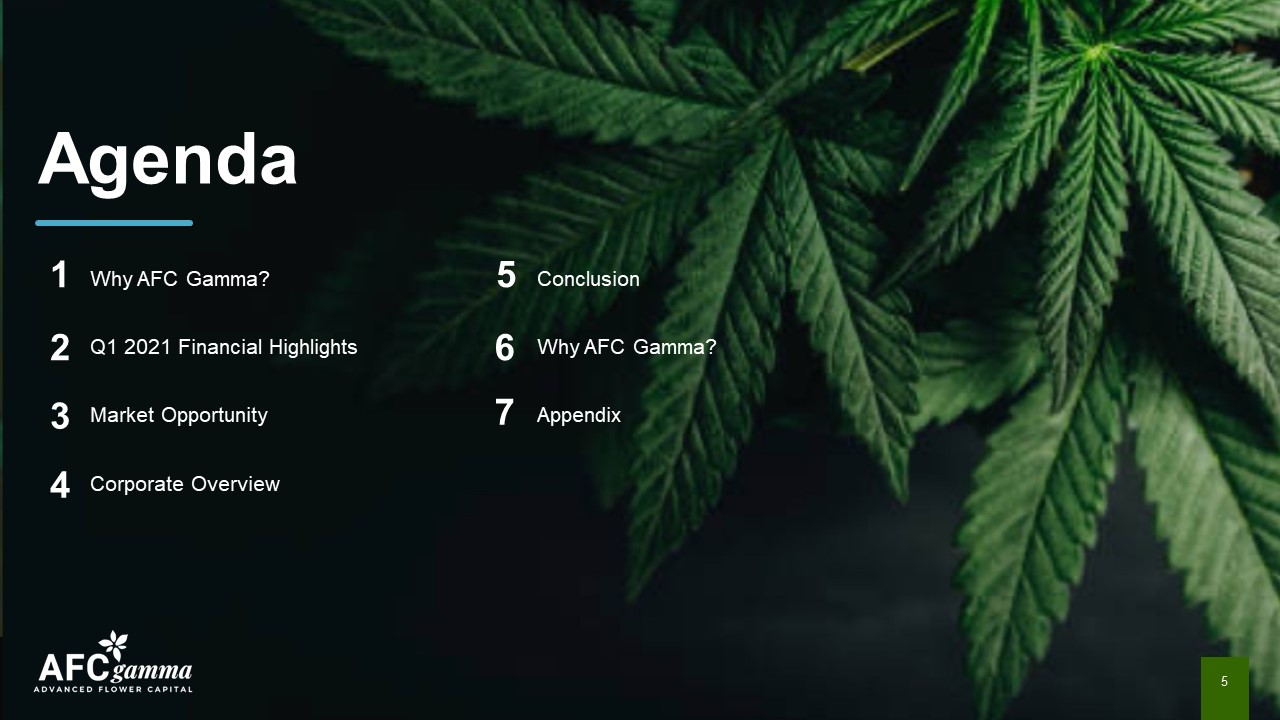
Agenda Why AFC Gamma? Q1 2021 Financial HighlightsMarket Opportunity Corporate OverviewConclusionWhy
AFC Gamma?Appendix 5 1 2 3 4 5 6 7

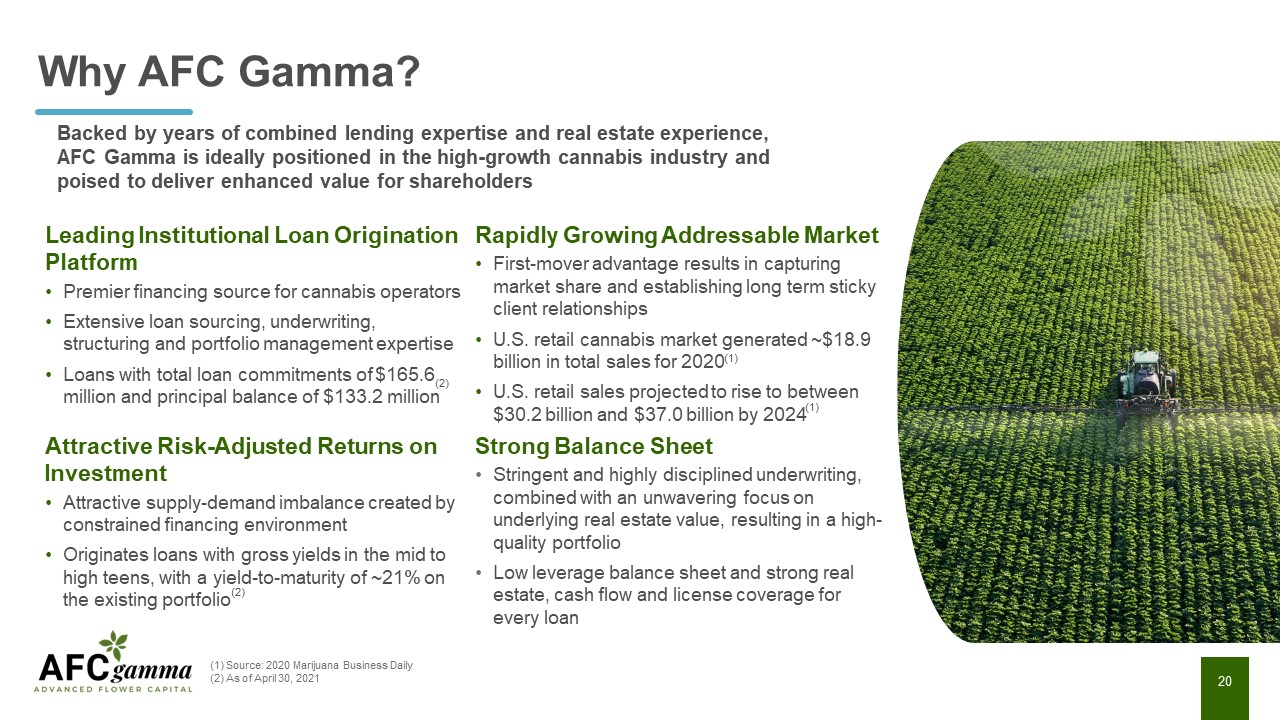
Why AFC Gamma? Backed by years of combined lending expertise and real estate experience, AFC Gamma is
ideally positioned in the high-growth cannabis industry and poised to deliver enhanced value for shareholders Leading Institutional Loan Origination PlatformPremier financing source for cannabis operatorsExtensive loan sourcing,
underwriting, structuring and portfolio management expertiseLoans with total loan commitments of $165.6 million and principal balance of $133.2 million Rapidly Growing Addressable MarketFirst-mover advantage results in capturing market share
and establishing long term sticky client relationships U.S. retail cannabis market generated ~$18.9 billion in total sales for 2020U.S. retail sales projected to rise to between $30.2 billion and $37.0 billion by 2024 Attractive
Risk-Adjusted Returns on InvestmentAttractive supply-demand imbalance created by constrained financing environmentOriginates loans with gross yields in the mid to high teens, with a yield-to-maturity of ~21% on the existing portfolio Strong
Balance SheetStringent and highly disciplined underwriting, combined with an unwavering focus on underlying real estate value, resulting in a high-quality portfolioLow leverage balance sheet and strong real estate, cash flow and license
coverage for every loan (1) (1) (2) (1) Source: 2020 Marijuana Business Daily(2) As of April 30, 2021 (2)

AFCG Company Overview Only NASDAQ-listed provider of institutional loans to the cannabis
industryOriginates and funds loans to established cannabis best-in-class operators in states with attractive licensing and favorable supply/demand environmentsProvides compelling risk-adjusted returns with loans that typically include
amortization and/or cash flow sweeps, significant collateral and favorable pricing, driving average annual gross cash returns of approximately 12% – 20%Robust investment review process including market research, management underwriting and
in-depth due diligenceFounded in July 2020 by veteran investor Leonard Tannenbaum Collectively, the management team has directly structured over $10 billion in loan transactions and taken three companies public Industry source: 2020
Marijuana Business Daily. All company data as of April 30, 2021 7 A Leading Lenderto the Cannabis Space ~21%Yield on Existing Portfolio $204MMTotal Loan Amount Since Inception by the Manager $18.9BnRetail Cannabis Market Size in
2020 50+Years Investing Experience by Investment Committee 1.02xReal Estate Collateral Coverage on Existing Portfolio $545MMActionable Pipeline Premier Commercial Mortgage REITNASDAQ: AFCG (1)
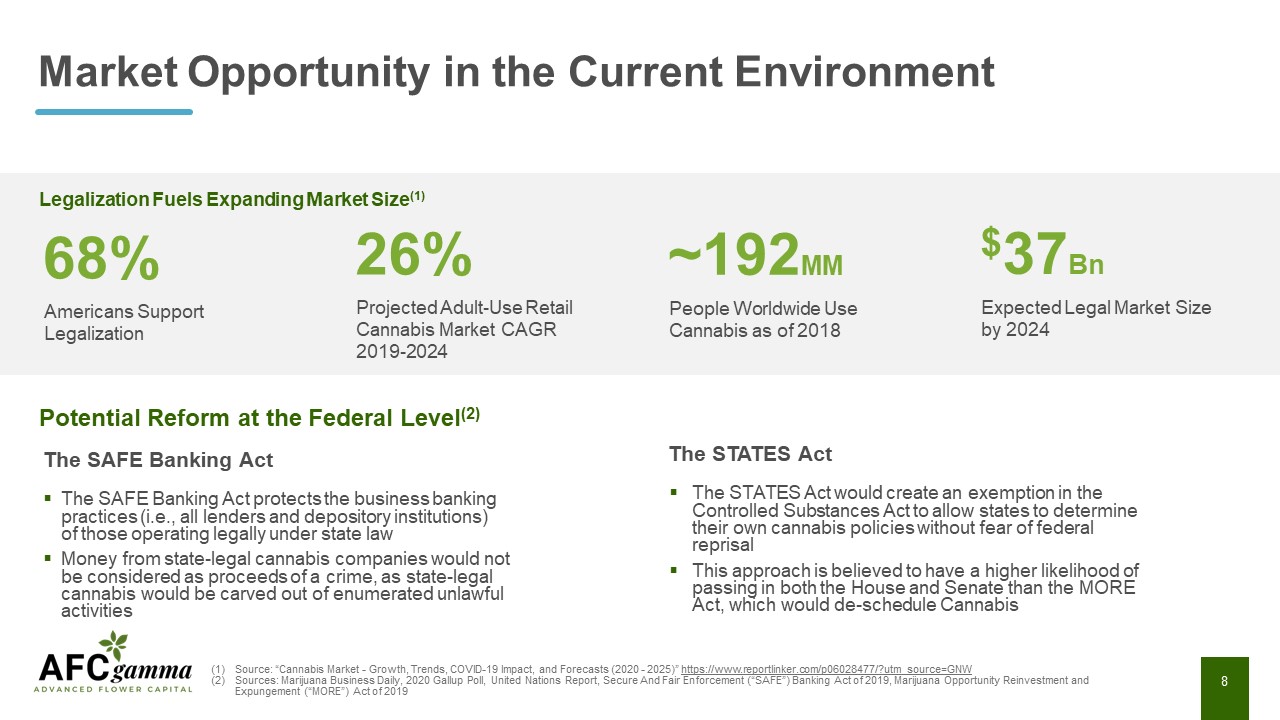
Market Opportunity in the Current Environment Source: “Cannabis Market - Growth, Trends, COVID-19
Impact, and Forecasts (2020 - 2025)” https://www.reportlinker.com/p06028477/?utm_source=GNWSources: Marijuana Business Daily, 2020 Gallup Poll, United Nations Report, Secure And Fair Enforcement (“SAFE”) Banking Act of 2019, Marijuana
Opportunity Reinvestment and Expungement (“MORE”) Act of 2019 8 68%Americans Support Legalization 26%Projected Adult-Use Retail Cannabis Market CAGR 2019-2024 ~192MMPeople Worldwide Use Cannabis as of 2018 $37BnExpected Legal Market
Size by 2024 Legalization Fuels Expanding Market Size(1) Potential Reform at the Federal Level(2) The SAFE Banking ActThe SAFE Banking Act protects the business banking practices (i.e., all lenders and depository institutions) of those
operating legally under state law Money from state-legal cannabis companies would not be considered as proceeds of a crime, as state-legal cannabis would be carved out of enumerated unlawful activities The STATES ActThe STATES Act would
create an exemption in the Controlled Substances Act to allow states to determine their own cannabis policies without fear of federal reprisal This approach is believed to have a higher likelihood of passing in both the House and Senate than
the MORE Act, which would de-schedule Cannabis
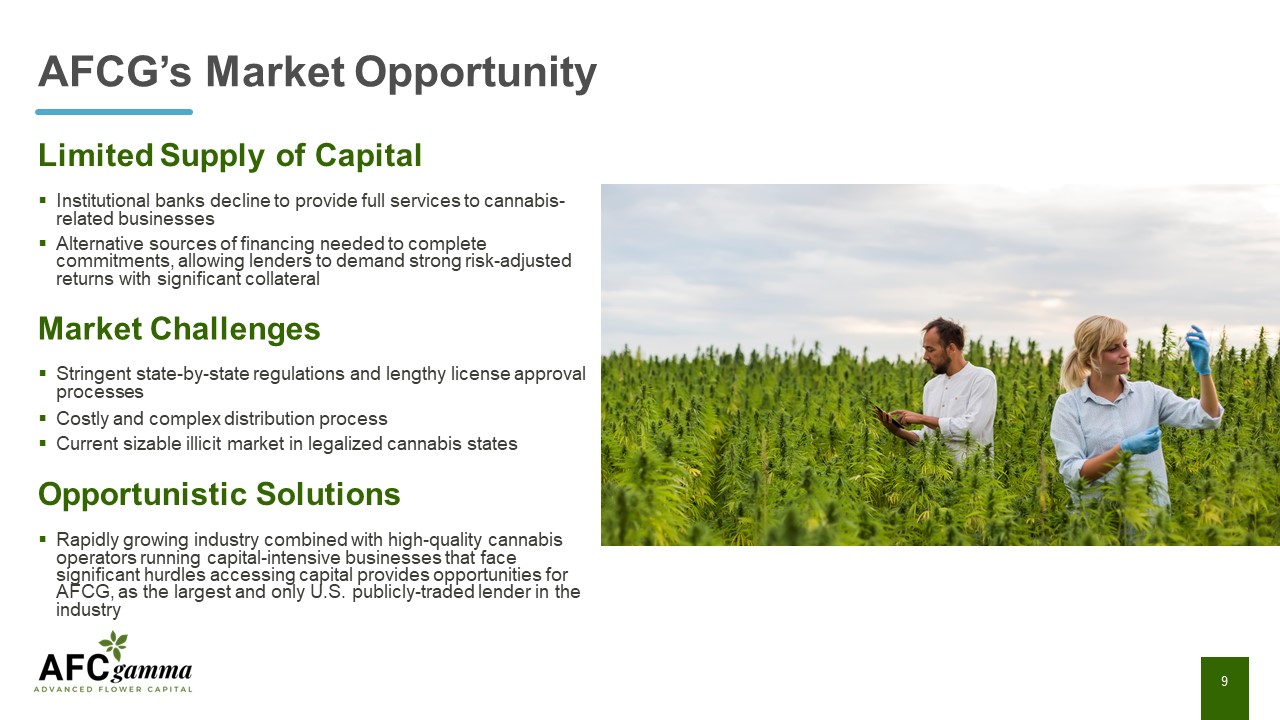
AFCG’s Market Opportunity 9 Limited Supply of CapitalInstitutional banks decline to provide full
services to cannabis-related businesses Alternative sources of financing needed to complete commitments, allowing lenders to demand strong risk-adjusted returns with significant collateral Market ChallengesStringent state-by-state
regulations and lengthy license approval processes Costly and complex distribution process Current sizable illicit market in legalized cannabis states Opportunistic SolutionsRapidly growing industry combined with high-quality cannabis
operators running capital-intensive businesses that face significant hurdles accessing capital provides opportunities for AFCG, as the largest and only U.S. publicly-traded lender in the industry
Impact of COVID-19 Source: Marijuana Business Daily (4/2/20), “US Markets that have Allowed
Marijuana Businesses to Remain Open During Coronavirus Pandemic”, Forbes, “Medical Cannabis Use For Mental Health Increased During Covid-19 Pandemic, Study Finds”*Massachusetts is the only state that deemed cannabis essential for medicinal
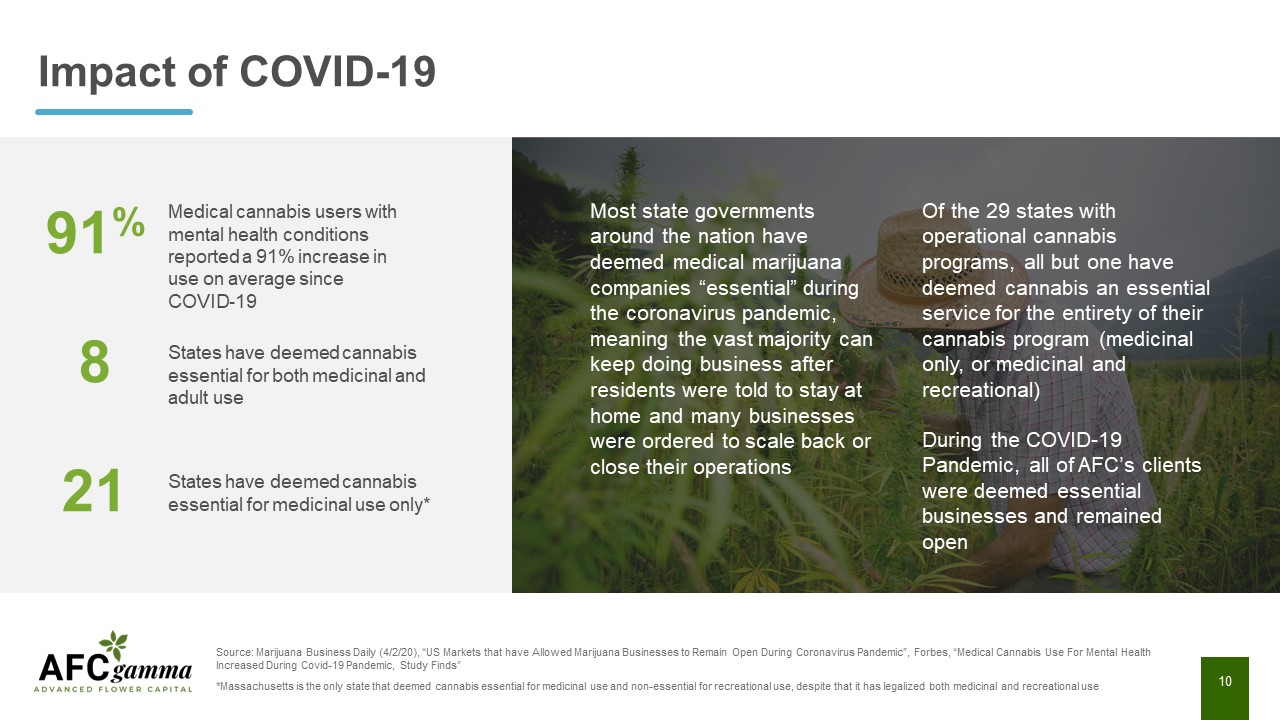
use and non-essential for recreational use, despite that it has legalized both medicinal and recreational use 10 Most state governments around the nation have deemed medical marijuana companies “essential” during the coronavirus pandemic,
meaning the vast majority can keep doing business after residents were told to stay at home and many businesses were ordered to scale back or close their operationsOf the 29 states with operational cannabis programs, all but one have deemed
cannabis an essential service for the entirety of their cannabis program (medicinal only, or medicinal and recreational)During the COVID-19 Pandemic, all of AFC’s clients were deemed essential businesses and remained open 91% 8 21 States
have deemed cannabis essential for medicinal use only* States have deemed cannabis essential for both medicinal and adult use Medical cannabis users with mental health conditions reported a 91% increase in use on average since COVID-19
Other tools include, but are not limited to appraisals, quality of earnings, environmental reports,
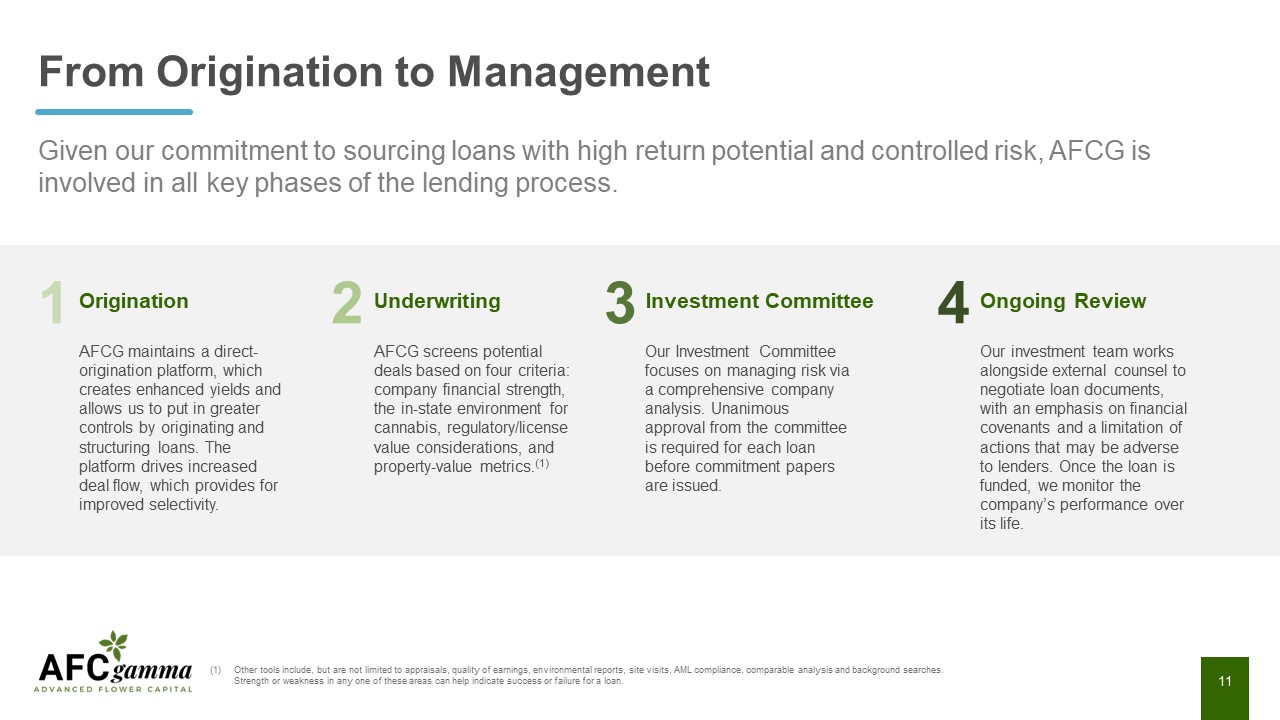
site visits, AML compliance, comparable analysis and background searches.Strength or weakness in any one of these areas can help indicate success or failure for a loan. From Origination to Management Given our commitment to sourcing loans
with high return potential and controlled risk, AFCG is involved in all key phases of the lending process. AFCG maintains a direct-origination platform, which creates enhanced yields and allows us to put in greater controls by originating
and structuring loans. The platform drives increased deal flow, which provides for improved selectivity. AFCG screens potential deals based on four criteria: company financial strength, the in-state environment for cannabis,
regulatory/license value considerations, and property-value metrics.(1) Our Investment Committee focuses on managing risk via a comprehensive company analysis. Unanimous approval from the committee is required for each loan before
commitment papers are issued. Our investment team works alongside external counsel to negotiate loan documents, with an emphasis on financial covenants and a limitation of actions that may be adverse to lenders. Once the loan is funded, we
monitor the company’s performance over its life. 1 2 3 4 Origination Underwriting Investment Committee Ongoing Review
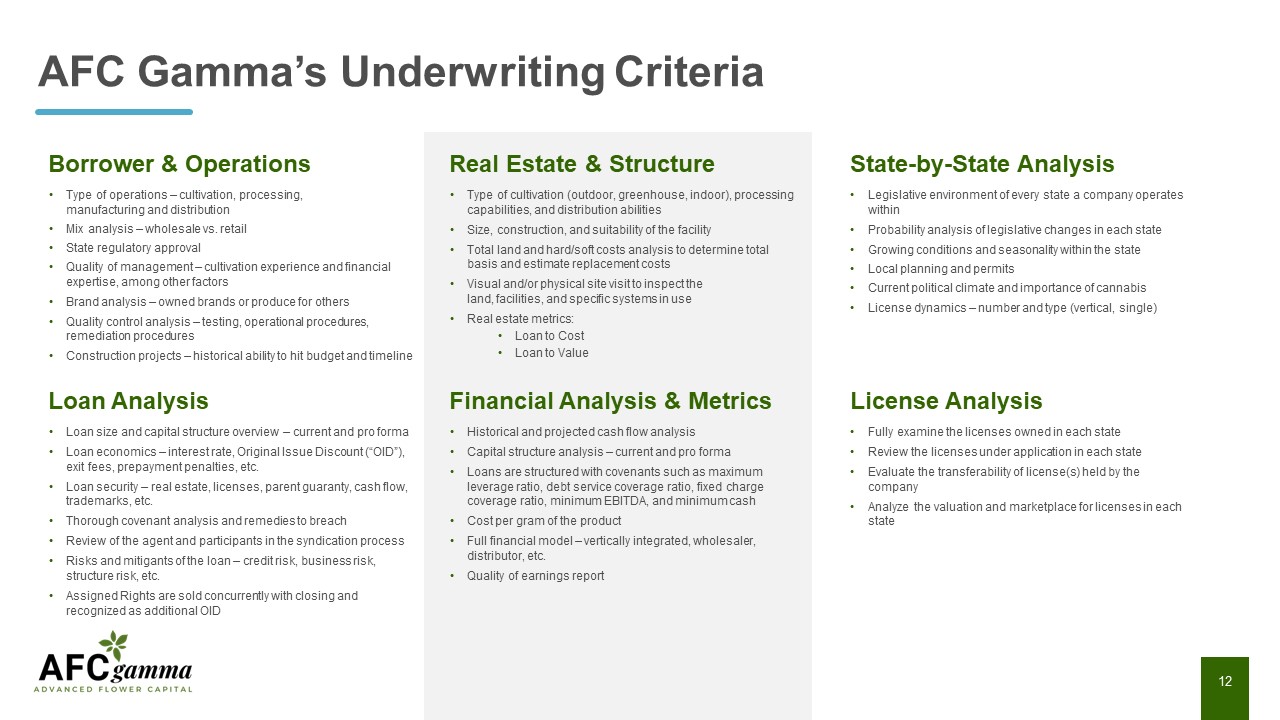
Borrower & Operations Real Estate & Structure State-by-State Analysis Type of operations –
cultivation, processing, manufacturing and distribution Mix analysis – wholesale vs. retail State regulatory approval Quality of management – cultivation experience and financial expertise, among other factors Brand analysis – owned brands or
produce for others Quality control analysis – testing, operational procedures, remediation procedures Construction projects – historical ability to hit budget and timeline Type of cultivation (outdoor, greenhouse, indoor), processing
capabilities, and distribution abilities Size, construction, and suitability of the facility Total land and hard/soft costs analysis to determine total basis and estimate replacement costs Visual and/or physical site visit to inspect the
land, facilities, and specific systems in use Real estate metrics: Loan to Cost Loan to Value Legislative environment of every state a company operates within Probability analysis of legislative changes in each state Growing conditions and
seasonality within the state Local planning and permits Current political climate and importance of cannabis License dynamics – number and type (vertical, single) AFC Gamma’s Underwriting Criteria Loan Analysis Financial Analysis &
Metrics License Analysis Loan size and capital structure overview – current and pro forma Loan economics – interest rate, Original Issue Discount (“OID”), exit fees, prepayment penalties, etc.Loan security – real estate, licenses, parent
guaranty, cash flow, trademarks, etc.Thorough covenant analysis and remedies to breach Review of the agent and participants in the syndication process Risks and mitigants of the loan – credit risk, business risk, structure risk, etc. Assigned
Rights are sold concurrently with closing and recognized as additional OID Historical and projected cash flow analysis Capital structure analysis – current and pro forma Loans are structured with covenants such as maximum leverage ratio,
debt service coverage ratio, fixed charge coverage ratio, minimum EBITDA, and minimum cash Cost per gram of the product Full financial model – vertically integrated, wholesaler, distributor, etc.Quality of earnings report Fully examine the
licenses owned in each state Review the licenses under application in each state Evaluate the transferability of license(s) held by the company Analyze the valuation and marketplace for licenses in each state
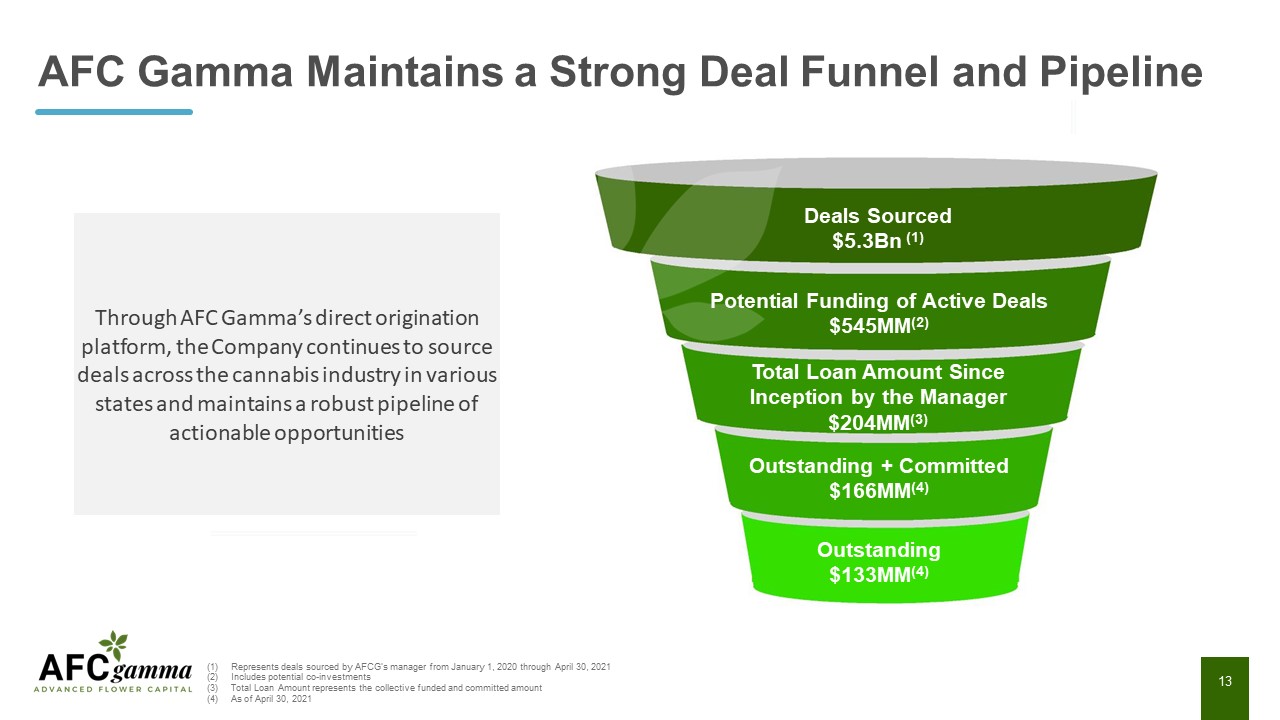
Represents deals sourced by AFCG’s manager from January 1, 2020 through April 30, 2021Includes
potential co-investmentsTotal Loan Amount represents the collective funded and committed amountAs of April 30, 2021 AFC Gamma Maintains a Strong Deal Funnel and Pipeline Potential Funding of Active Deals $545MM(2) Deals Sourced $5.3Bn
(1) Total Loan Amount Since Inception by the Manager $204MM(3) Outstanding + Committed $166MM(4) Outstanding $133MM(4) Through AFC Gamma’s direct origination platform, the Company continues to source deals across the cannabis industry in
various states and maintains a robust pipeline of actionable opportunities
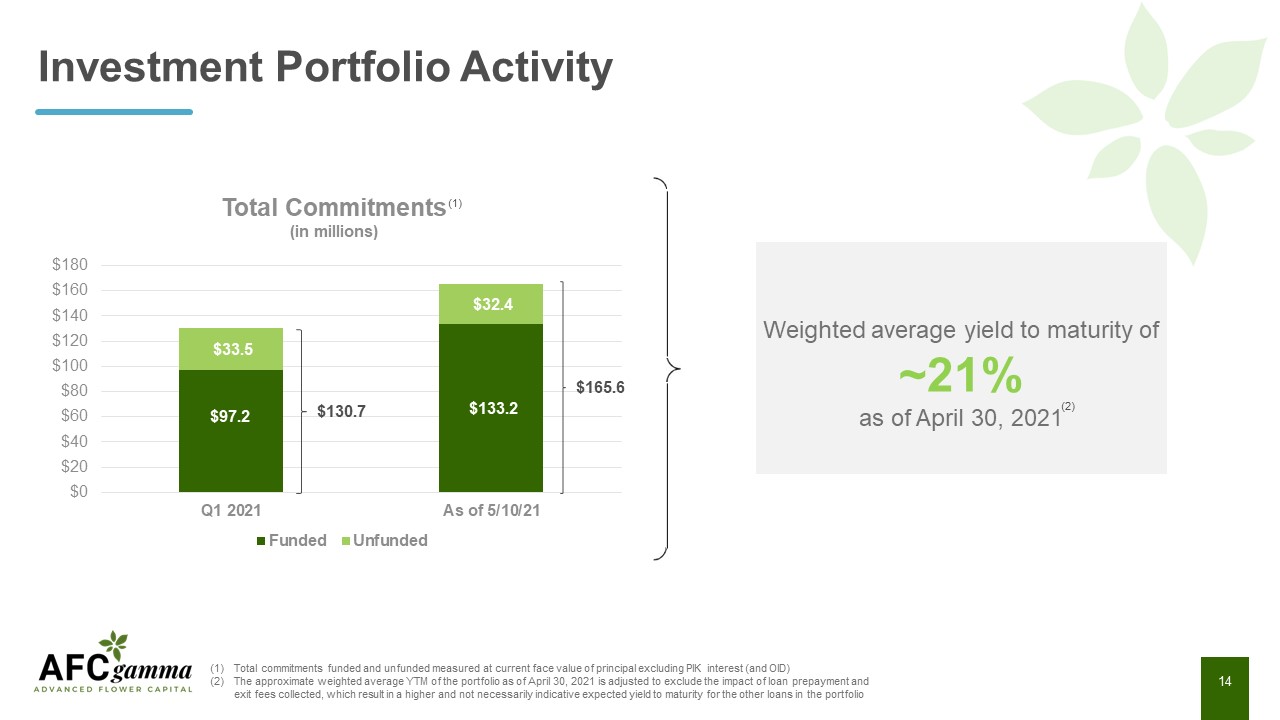
Weighted average yield to maturity of ~21% as of April 30, 2021 Investment Portfolio
Activity $97.2 (1) $165.6 Total commitments funded and unfunded measured at current face value of principal excluding PIK interest (and OID)The approximate weighted average YTM of the portfolio as of April 30, 2021 is adjusted to exclude
the impact of loan prepayment and exit fees collected, which result in a higher and not necessarily indicative expected yield to maturity for the other loans in the portfolio (2)
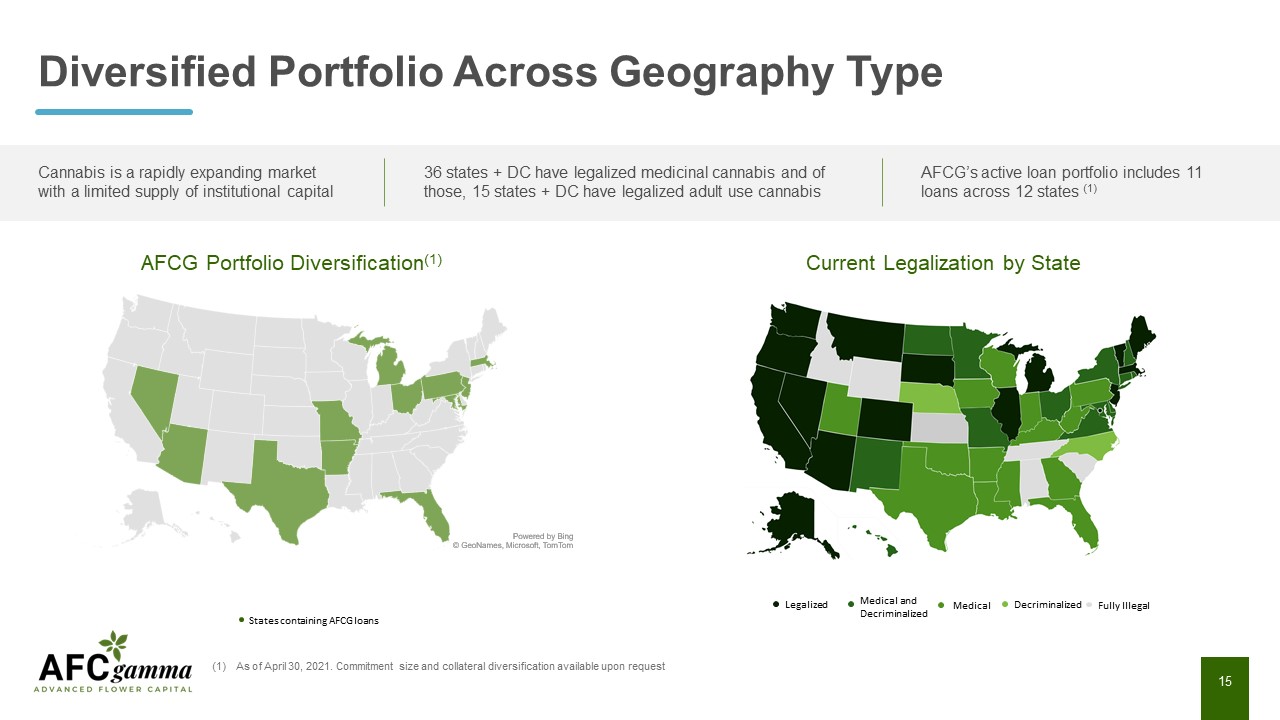
As of April 30, 2021. Commitment size and collateral diversification available upon
request Diversified Portfolio Across Geography Type States containing AFCG loans Cannabis is a rapidly expanding market with a limited supply of institutional capital 36 states + DC have legalized medicinal cannabis and of those, 15
states + DC have legalized adult use cannabis AFCG’s active loan portfolio includes 11 loans across 12 states (1) Legalized Medical Medical and Decriminalized Decriminalized Fully Illegal AFCG Portfolio
Diversification(1) Current Legalization by State
(1) All loans originated prior to 7/31/2020 were purchased from an affiliated entity at accreted and/or
amortized cost plus accrued interest on 7/31/2020.(2) Approximate Yield to Maturity (“YTM”) calculation includes a variety of fees and features that affect the total yield, which may include Original Issue Discount (“OID”), exit fees,
prepayment fees, extension fees, unused fees and contingent features. Original Issue Discount or "OID" is recognized as a discount to the funded loan principal and is accreted to income over the term of the loan. Loans originated before
7/31/2020 were acquired by AFC, net of unaccreted OID, which AFC accretes to income over the remaining term of the loan. In some cases additional OID is recognized from additional purchase discounts attributed to the fair value of equity
positions that were separated from the loans prior to our acquisition of such loans. The YTM calculations require management to make estimates and assumptions including but not limited to the timing and amounts of loan draws on delayed draw
loans, the timing collectability of exit fees, and the probability and timing of prepayments. Actual results could differ from those estimates. No prepayment penalties or early payoffs were assumed.(3) Loan has an optional extension for 364
days, but we do not have to participate in the extension, so it was not included nor assumed.(4) YTM is calculated based on the occurrence of a ratchet event per the credit agreement. In the event this does not occur, the YTM calculation may
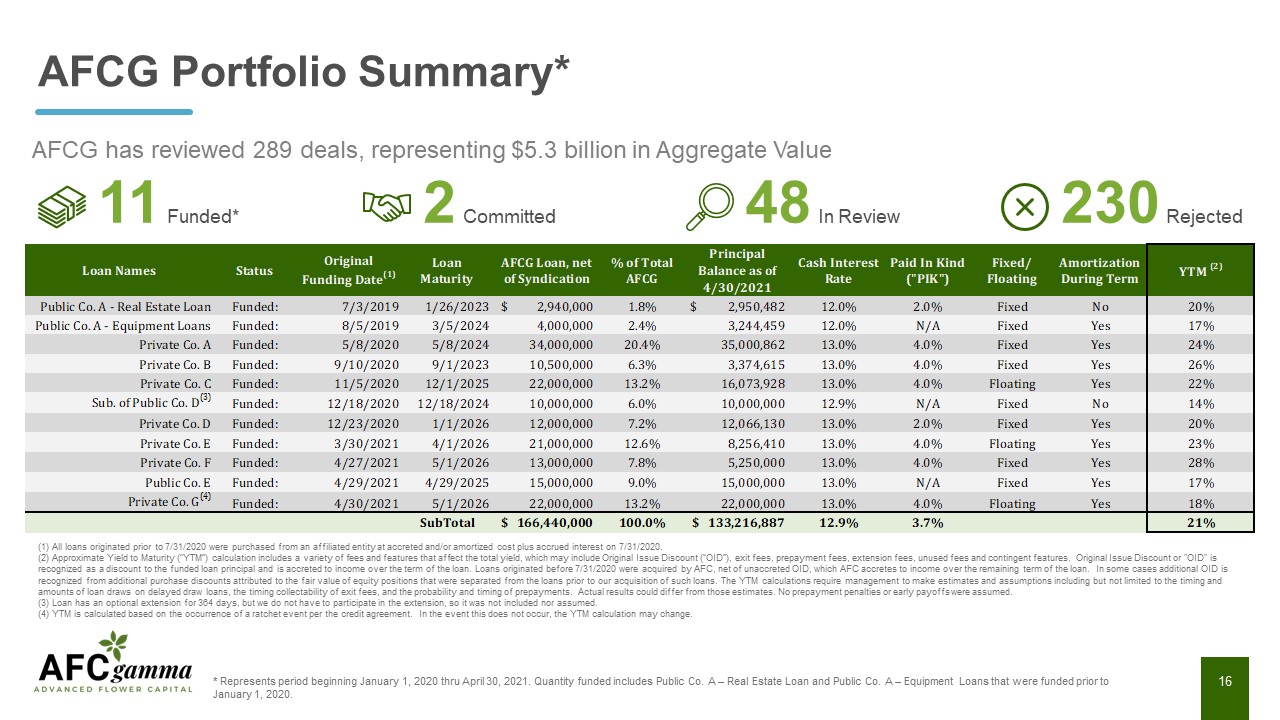
change. AFCG Portfolio Summary* AFCG has reviewed 289 deals, representing $5.3 billion in Aggregate Value 11 Funded* 2 Committed 48 In Review 230 Rejected * Represents period beginning January 1, 2020 thru April 30, 2021. Quantity
funded includes Public Co. A – Real Estate Loan and Public Co. A – Equipment Loans that were funded prior to January 1, 2020.
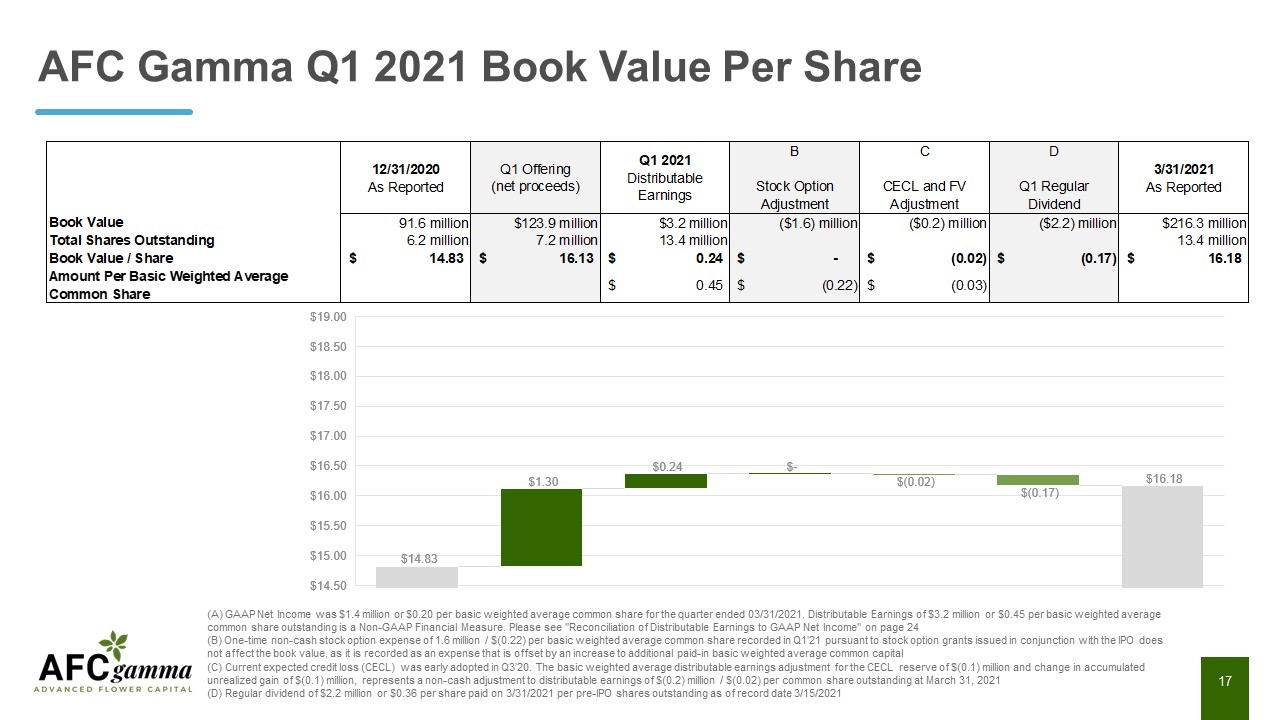
AFC Gamma Q1 2021 Book Value Per Share 97.2 (A) GAAP Net Income was $1.4 million or $0.20 per basic
weighted average common share for the quarter ended 03/31/2021. Distributable Earnings of $3.2 million or $0.45 per basic weighted average common share outstanding is a Non-GAAP Financial Measure. Please see "Reconciliation of Distributable
Earnings to GAAP Net Income" on page 24 (B) One-time non-cash stock option expense of 1.6 million / $(0.22) per basic weighted average common share recorded in Q1’21 pursuant to stock option grants issued in conjunction with the IPO does not
affect the book value, as it is recorded as an expense that is offset by an increase to additional paid-in basic weighted average common capital (C) Current expected credit loss (CECL) was early adopted in Q3’20. The basic weighted average
distributable earnings adjustment for the CECL reserve of $(0.1) million and change in accumulated unrealized gain of $(0.1) million, represents a non-cash adjustment to distributable earnings of $(0.2) million / $(0.02) per common share
outstanding at March 31, 2021(D) Regular dividend of $2.2 million or $0.36 per share paid on 3/31/2021 per pre-IPO shares outstanding as of record date 3/15/2021
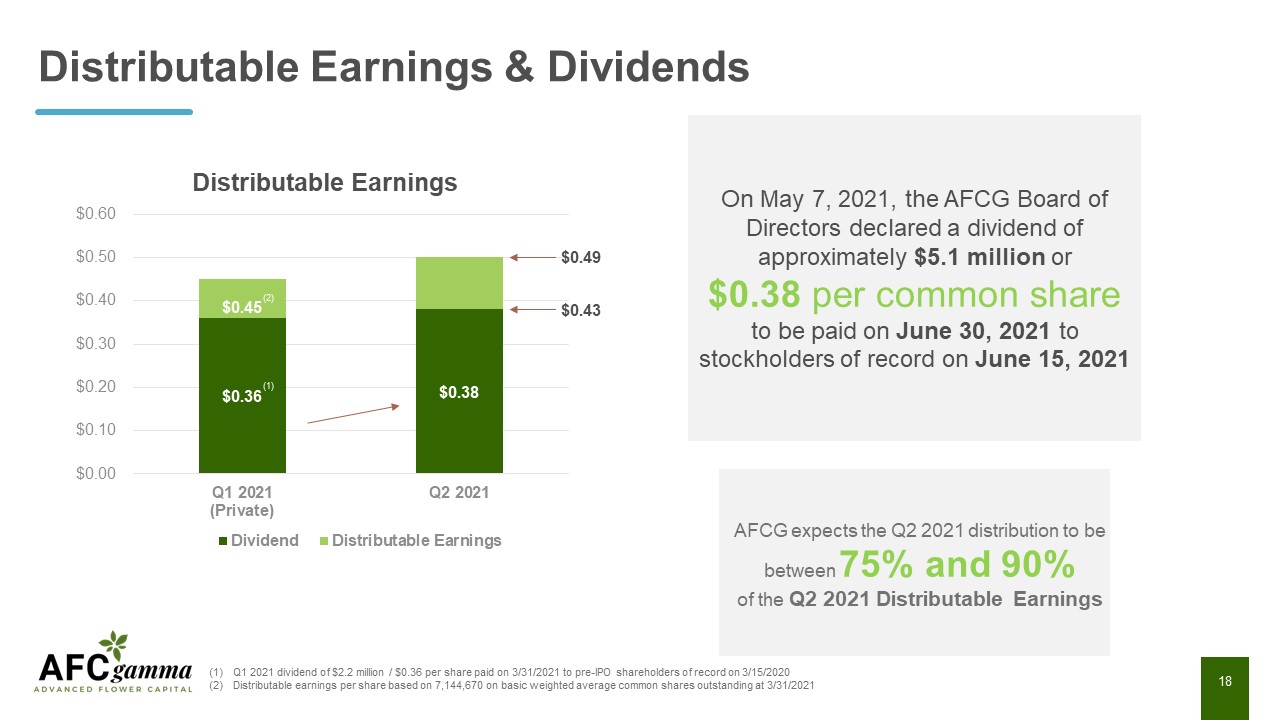
Distributable Earnings & Dividends AFCG expects the Q2 2021 distribution to be between 75% and
90% of the Q2 2021 Distributable Earnings $0.45 $0.43 $0.49 On May 7, 2021, the AFCG Board of Directors declared a dividend of approximately $5.1 million or $0.38 per common shareto be paid on June 30, 2021 to stockholders of record on
June 15, 2021 (1) Q1 2021 dividend of $2.2 million / $0.36 per share paid on 3/31/2021 to pre-IPO shareholders of record on 3/15/2020Distributable earnings per share based on 7,144,670 on basic weighted average common shares outstanding at
3/31/2021

Questions? Conclusion
Why AFC Gamma? Backed by years of combined lending expertise and real estate experience, AFC Gamma is
ideally positioned in the high-growth cannabis industry and poised to deliver enhanced value for shareholders Leading Institutional Loan Origination PlatformPremier financing source for cannabis operatorsExtensive loan sourcing,
underwriting, structuring and portfolio management expertiseLoans with total loan commitments of $165.6 million and principal balance of $133.2 million Rapidly Growing Addressable MarketFirst-mover advantage results in capturing market share
and establishing long term sticky client relationships U.S. retail cannabis market generated ~$18.9 billion in total sales for 2020U.S. retail sales projected to rise to between $30.2 billion and $37.0 billion by 2024 Attractive
Risk-Adjusted Returns on InvestmentAttractive supply-demand imbalance created by constrained financing environmentOriginates loans with gross yields in the mid to high teens, with a yield-to-maturity of ~21% on the existing portfolio Strong
Balance SheetStringent and highly disciplined underwriting, combined with an unwavering focus on underlying real estate value, resulting in a high-quality portfolioLow leverage balance sheet and strong real estate, cash flow and license
coverage for every loan (1) (1) (2) (1) Source: 2020 Marijuana Business Daily(2) As of April 30, 2021 (2)
Questions? APPENDIXQ1 2021 Financial Overview
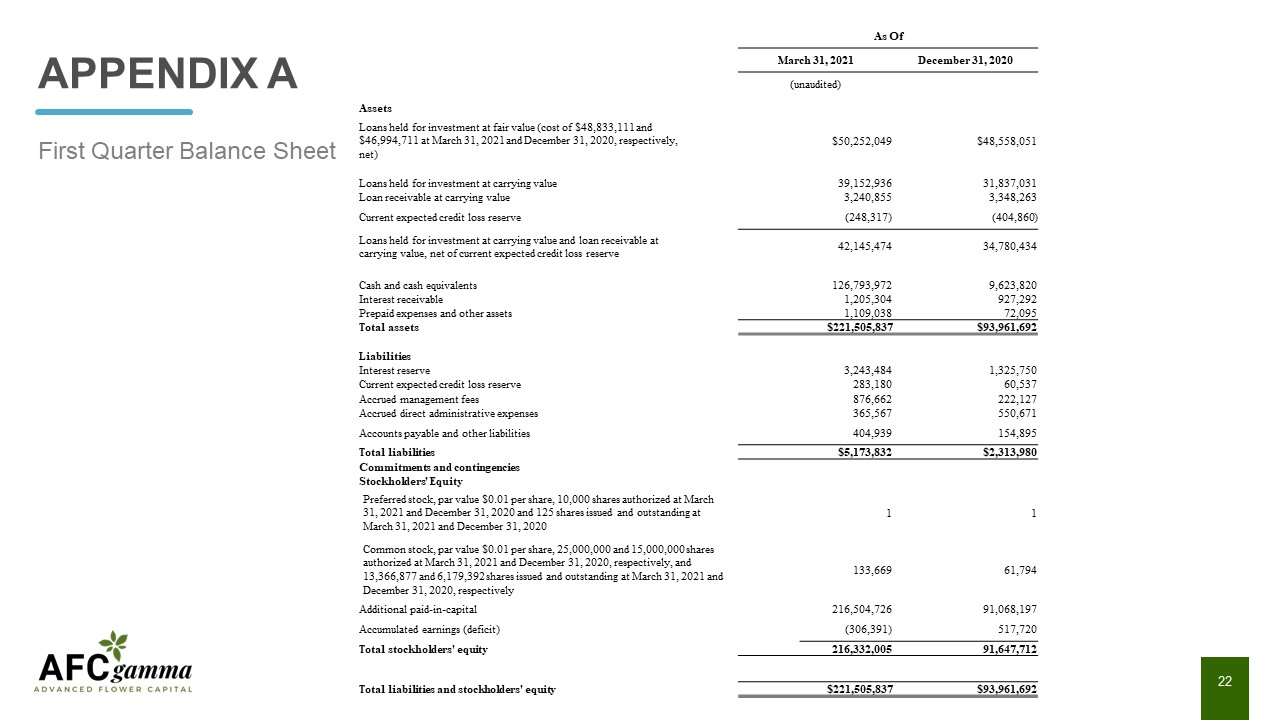
APPENDIX A First Quarter Balance Sheet As Of March 31, 2021 December 31,
2020 (unaudited) Assets Loans held for investment at fair value (cost of $48,833,111 and $46,994,711 at March 31, 2021 and December 31, 2020, respectively,
net) $50,252,049 $48,558,051 Loans held for investment at carrying value 39,152,936 31,837,031 Loan receivable at carrying value 3,240,855 3,348,263 Current expected credit loss
reserve (248,317) (404,860) Loans held for investment at carrying value and loan receivable at carrying value, net of current expected credit loss reserve 42,145,474 34,780,434 Cash and cash
equivalents 126,793,972 9,623,820 Interest receivable 1,205,304 927,292 Prepaid expenses and other assets 1,109,038 72,095 Total
assets $221,505,837 $93,961,692 Liabilities Interest reserve 3,243,484 1,325,750 Current expected credit loss reserve 283,180 60,537 Accrued management
fees 876,662 222,127 Accrued direct administrative expenses 365,567 550,671 Accounts payable and other liabilities 404,939 154,895 Total liabilities $5,173,832 $2,313,980 Commitments and
contingencies Stockholders' Equity Preferred stock, par value $0.01 per share, 10,000 shares authorized at March 31, 2021 and December 31, 2020 and 125 shares issued and outstanding at March 31, 2021 and
December 31, 2020 1 1 Common stock, par value $0.01 per share, 25,000,000 and 15,000,000 shares authorized at March 31, 2021 and December 31, 2020, respectively, and 13,366,877 and 6,179,392 shares issued and outstanding at March
31, 2021 and December 31, 2020, respectively 133,669 61,794 Additional paid-in-capital 216,504,726 91,068,197 Accumulated earnings (deficit) (306,391) 517,720 Total stockholders'
equity 216,332,005 91,647,712 Total liabilities and stockholders' equity $221,505,837 $93,961,692
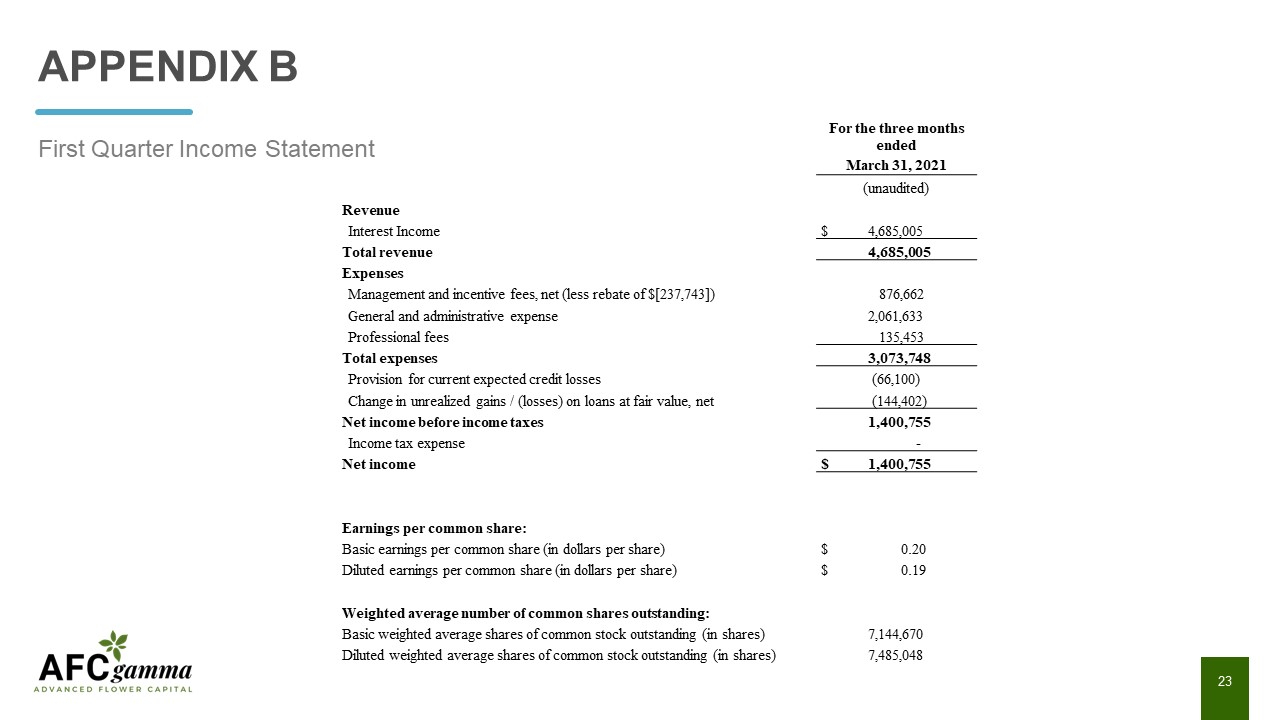
APPENDIX B First Quarter Income Statement For the three months ended March 31,
2021 (unaudited) Revenue Interest Income $ 4,685,005 Total revenue 4,685,005 Expenses Management and incentive fees, net (less rebate of $[237,743]) 876,662 General and administrative
expense 2,061,633 Professional fees 135,453 Total expenses 3,073,748 Provision for current expected credit losses (66,100) Change in unrealized gains / (losses) on loans at fair value, net
(144,402) Net income before income taxes 1,400,755 Income tax expense - Net income $ 1,400,755 Earnings per common share: Basic earnings per common share (in dollars per share) $
0.20 Diluted earnings per common share (in dollars per share) $ 0.19 Weighted average number of common shares outstanding: Basic weighted average shares of common stock outstanding (in shares) 7,144,670
Diluted weighted average shares of common stock outstanding (in shares) 7,485,048
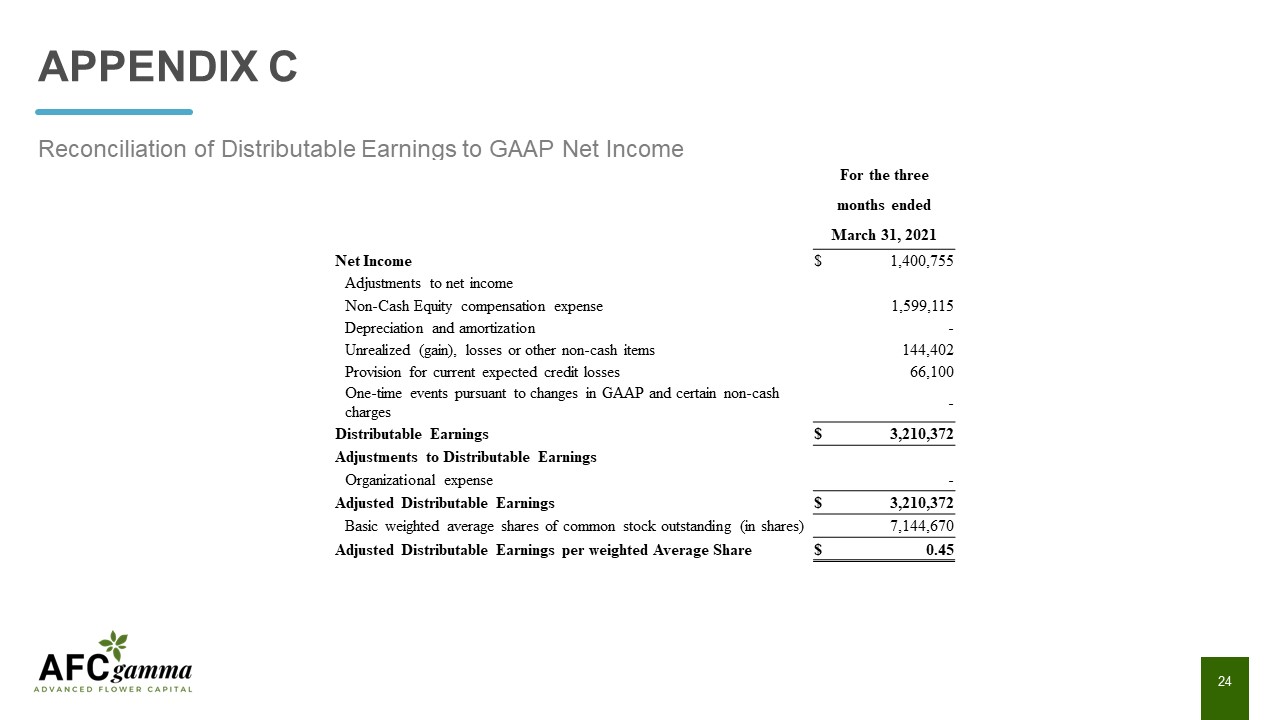
APPENDIX C Reconciliation of Distributable Earnings to GAAP Net Income For the three months
ended March 31, 2021 Net Income $ 1,400,755 Adjustments to net income Non-Cash Equity compensation expense 1,599,115 Depreciation and amortization - Unrealized (gain), losses or other non-cash
items 144,402 Provision for current expected credit losses 66,100 One-time events pursuant to changes in GAAP and certain non-cash charges - Distributable Earnings $ 3,210,372 Adjustments to Distributable
Earnings Organizational expense - Adjusted Distributable Earnings $ 3,210,372 Basic weighted average shares of common stock outstanding (in shares) 7,144,670 Adjusted Distributable Earnings per weighted Average
Share $ 0.45

www.afcgamma.com