Attached files
| file | filename |
|---|---|
| EX-99.1 - EX-99.1 - i3 Verticals, Inc. | iiiv2q21earningsrelease.htm |
| EX-10.1 - EX-10.1 - i3 Verticals, Inc. | exhibit101-i3verticalsxame.htm |
| 8-K - 8-K - i3 Verticals, Inc. | iiiv-20210504.htm |
Q2 Fiscal 2021 Supplemental Information

2 Q2 Fiscal 2021 GAAP Measures ($ in thousands) Three months ended March 31, 2021 Three months ended March 31, 2020(1) Merchant Services Proprietary Software and Payments Other Total Merchant Services Proprietary Software and Payments Other Total Revenue $ 25,992 $ 22,549 $ (678) $ 47,863 $ 25,729 $ 13,980 $ (531) $ 39,178 Income (loss) from operations $ 4,570 $ 4,030 $ (8,735) $ (135) $ 4,979 $ 3,842 $ (6,780) $ 2,041 ($ in thousands) Six months ended March 31, 2021 Six months ended March 31, 2020(1) Merchant Services Proprietary Software and Payments Other Total Merchant Services Proprietary Software and Payments Other Total Revenue $ 50,962 $ 41,325 $ (1,111) $ 91,176 $ 53,968 $ 27,262 $ (941) $ 80,289 Income (loss) from operations $ 9,332 $ 4,758 $ (16,536) $ (2,446) $ 13,406 $ 4,710 $ (11,978) $ 6,138 The following are our Revenues and Income (loss) from operations for the three and six months ended March 31, 2021 and 2020 calculated in accordance with GAAP. The presentation also includes references to the Company’s non-GAAP financials measures. The Company believes that, in addition to the financial measures calculated in accordance with GAAP, Adjusted Net Revenue, Adjusted EBITDA and Adjusted Net Income (Loss) are appropriate indicators to assist in the evaluation of its operating performance on a period-to-period basis. The Company also uses Adjusted EBITDA internally as a performance measure for planning purposes, including forecasting and for calculations of earnout liabilities. Adjusted EBITDA is also used to evaluate the Company’s ability to service debt.These non-GAAP financials measures presented throughout should be considered as a supplement to, not a substitute for, revenue, income from operations, net income, or other financials performance and liquidity measures prepared in accordance with GAAP. 1. Effective July 1, 2020, the Company reassigned a component from the Proprietary Software and Payments segment to the Merchant Services segment to better align the Company's business within its segments. The prior period comparatives have been retroactively adjusted to reflect the Company's current segment presentation.
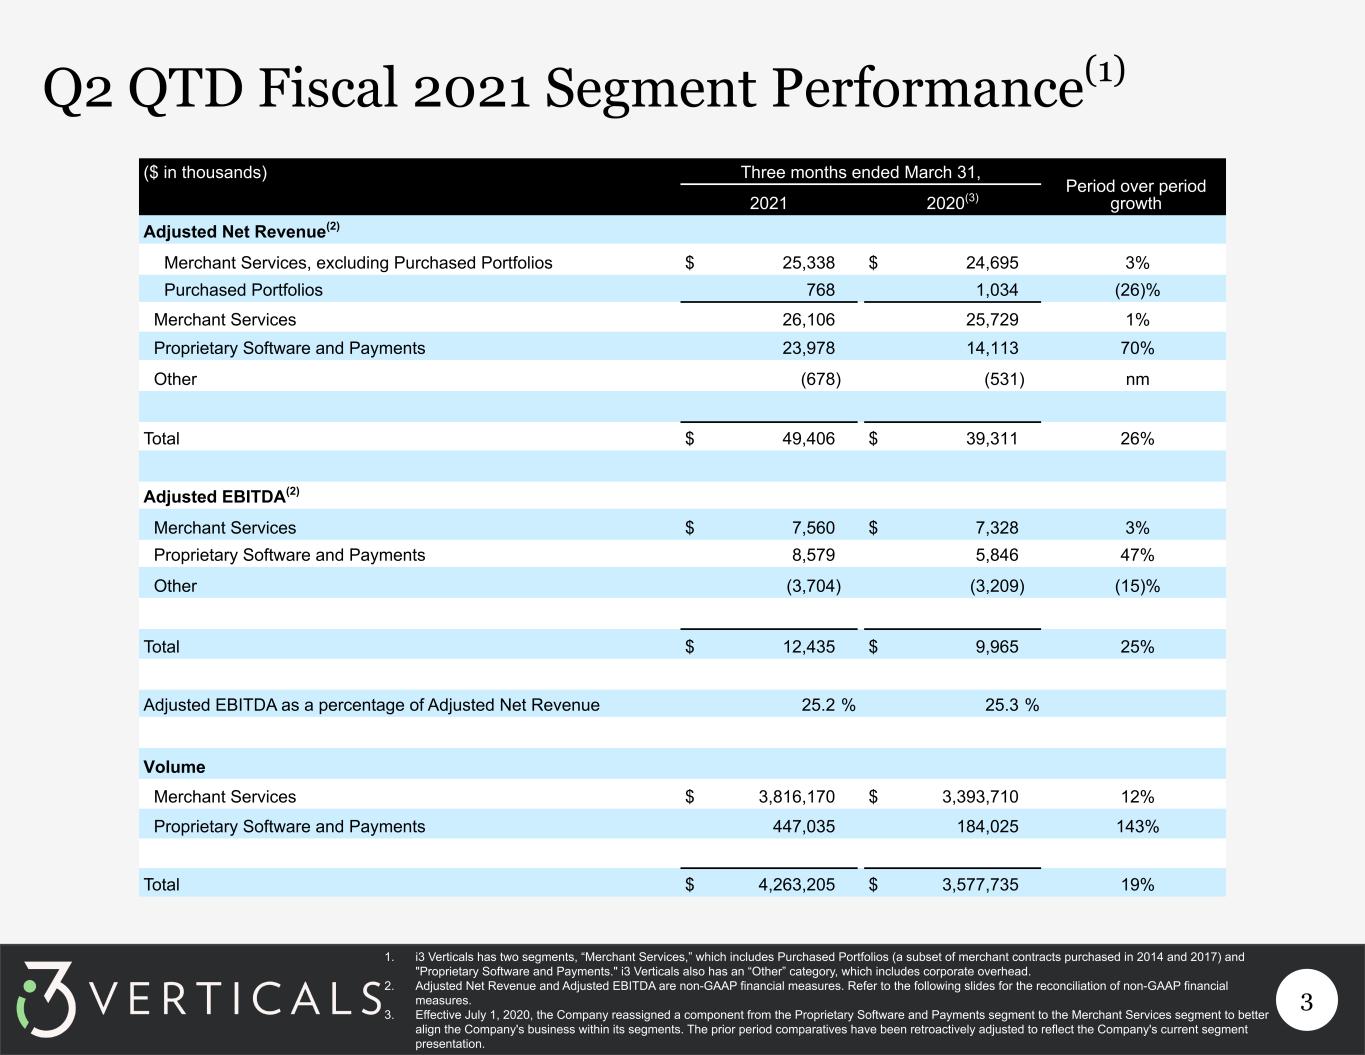
3 Q2 QTD Fiscal 2021 Segment Performance(1) ($ in thousands) Three months ended March 31, Period over period growth2021 2020(3) Adjusted Net Revenue(2) Merchant Services, excluding Purchased Portfolios $ 25,338 $ 24,695 3% Purchased Portfolios 768 1,034 (26)% Merchant Services 26,106 25,729 1% Proprietary Software and Payments 23,978 14,113 70% Other (678) (531) nm Total $ 49,406 $ 39,311 26% Adjusted EBITDA(2) Merchant Services $ 7,560 $ 7,328 3% Proprietary Software and Payments 8,579 5,846 47% Other (3,704) (3,209) (15)% Total $ 12,435 $ 9,965 25% Adjusted EBITDA as a percentage of Adjusted Net Revenue 25.2 % 25.3 % Volume Merchant Services $ 3,816,170 $ 3,393,710 12% Proprietary Software and Payments 447,035 184,025 143% Total $ 4,263,205 $ 3,577,735 19% 1. i3 Verticals has two segments, “Merchant Services,” which includes Purchased Portfolios (a subset of merchant contracts purchased in 2014 and 2017) and "Proprietary Software and Payments." i3 Verticals also has an “Other” category, which includes corporate overhead. 2. Adjusted Net Revenue and Adjusted EBITDA are non-GAAP financial measures. Refer to the following slides for the reconciliation of non-GAAP financial measures. 3. Effective July 1, 2020, the Company reassigned a component from the Proprietary Software and Payments segment to the Merchant Services segment to better align the Company's business within its segments. The prior period comparatives have been retroactively adjusted to reflect the Company's current segment presentation.
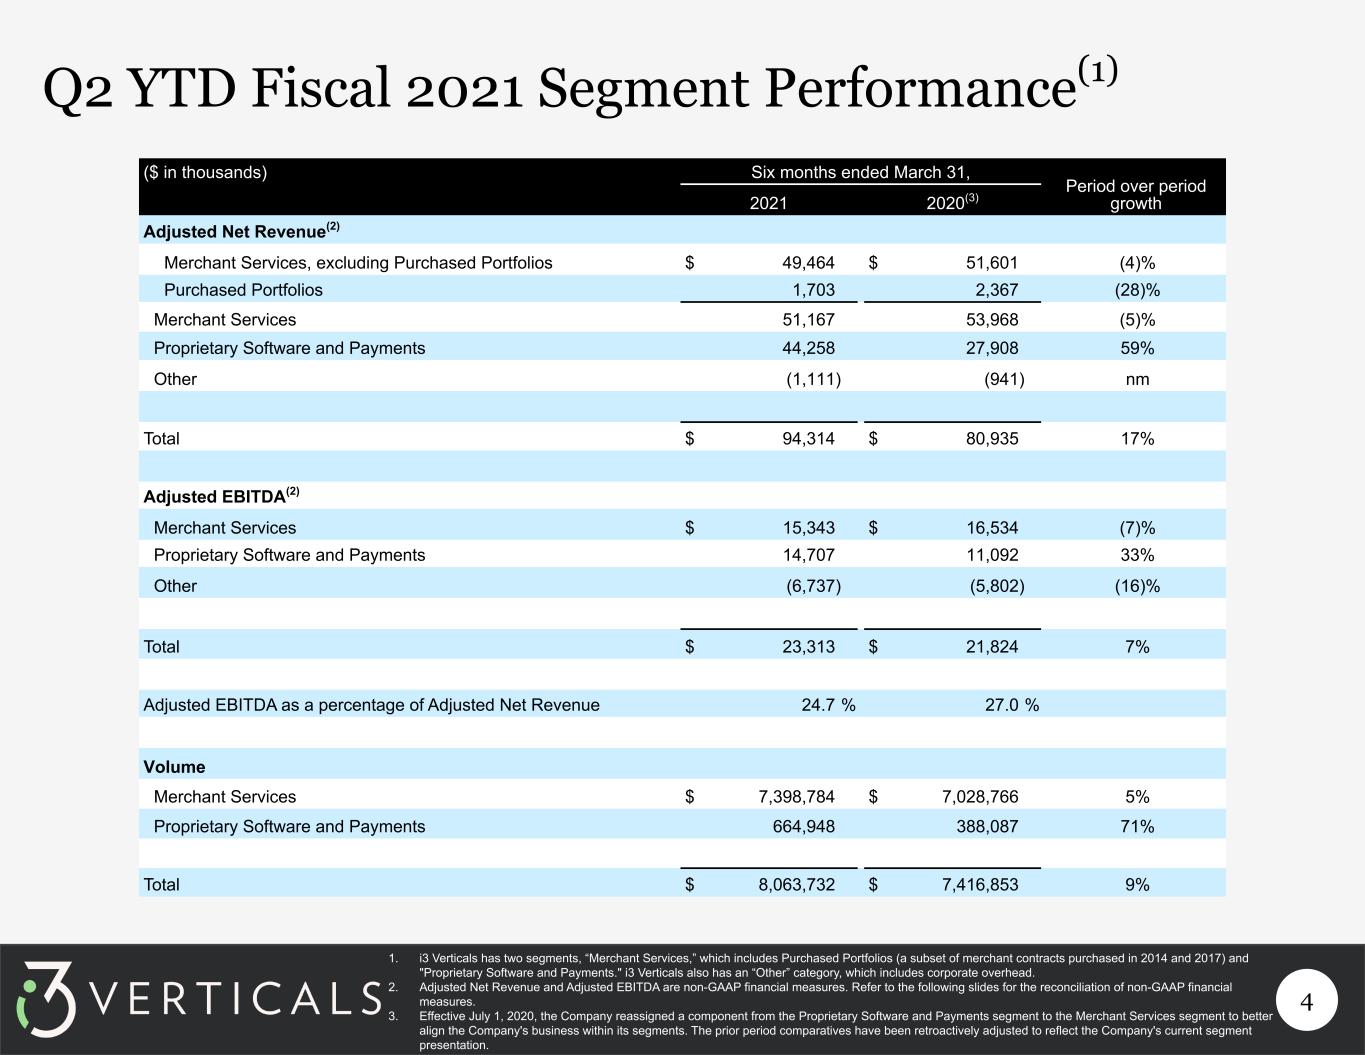
4 Q2 YTD Fiscal 2021 Segment Performance(1) ($ in thousands) Six months ended March 31, Period over period growth2021 2020(3) Adjusted Net Revenue(2) Merchant Services, excluding Purchased Portfolios $ 49,464 $ 51,601 (4)% Purchased Portfolios 1,703 2,367 (28)% Merchant Services 51,167 53,968 (5)% Proprietary Software and Payments 44,258 27,908 59% Other (1,111) (941) nm Total $ 94,314 $ 80,935 17% Adjusted EBITDA(2) Merchant Services $ 15,343 $ 16,534 (7)% Proprietary Software and Payments 14,707 11,092 33% Other (6,737) (5,802) (16)% Total $ 23,313 $ 21,824 7% Adjusted EBITDA as a percentage of Adjusted Net Revenue 24.7 % 27.0 % Volume Merchant Services $ 7,398,784 $ 7,028,766 5% Proprietary Software and Payments 664,948 388,087 71% Total $ 8,063,732 $ 7,416,853 9% 1. i3 Verticals has two segments, “Merchant Services,” which includes Purchased Portfolios (a subset of merchant contracts purchased in 2014 and 2017) and "Proprietary Software and Payments." i3 Verticals also has an “Other” category, which includes corporate overhead. 2. Adjusted Net Revenue and Adjusted EBITDA are non-GAAP financial measures. Refer to the following slides for the reconciliation of non-GAAP financial measures. 3. Effective July 1, 2020, the Company reassigned a component from the Proprietary Software and Payments segment to the Merchant Services segment to better align the Company's business within its segments. The prior period comparatives have been retroactively adjusted to reflect the Company's current segment presentation.
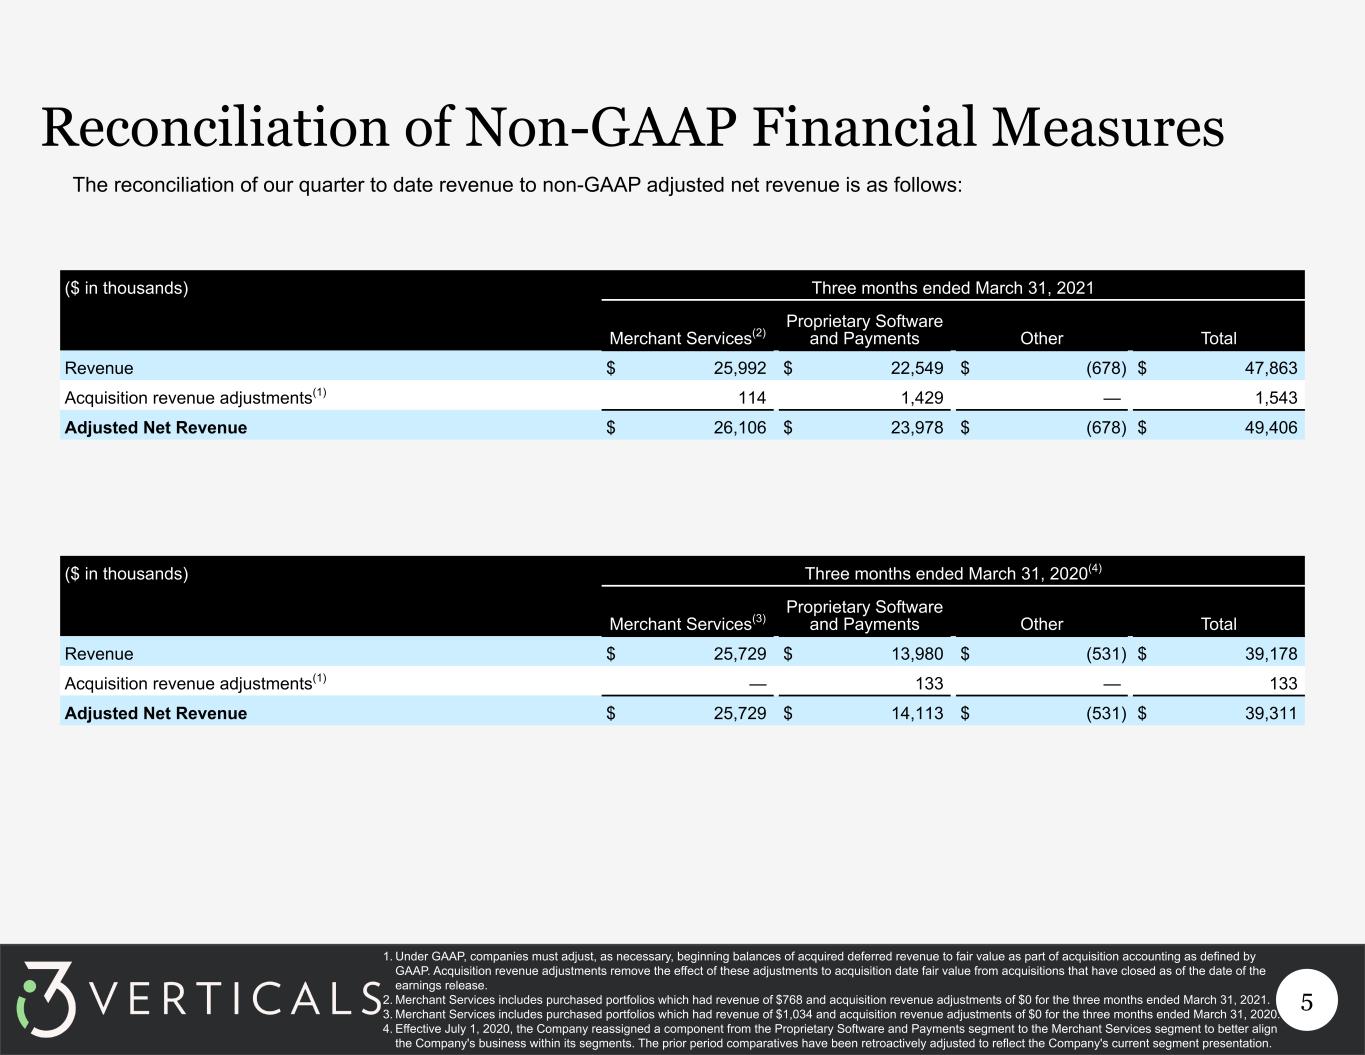
5 Reconciliation of Non-GAAP Financial Measures ($ in thousands) Three months ended March 31, 2021 Merchant Services(2) Proprietary Software and Payments Other Total Revenue $ 25,992 $ 22,549 $ (678) $ 47,863 Acquisition revenue adjustments(1) 114 1,429 — 1,543 Adjusted Net Revenue $ 26,106 $ 23,978 $ (678) $ 49,406 ($ in thousands) Three months ended March 31, 2020(4) Merchant Services(3) Proprietary Software and Payments Other Total Revenue $ 25,729 $ 13,980 $ (531) $ 39,178 Acquisition revenue adjustments(1) — 133 — 133 Adjusted Net Revenue $ 25,729 $ 14,113 $ (531) $ 39,311 1. Under GAAP, companies must adjust, as necessary, beginning balances of acquired deferred revenue to fair value as part of acquisition accounting as defined by GAAP. Acquisition revenue adjustments remove the effect of these adjustments to acquisition date fair value from acquisitions that have closed as of the date of the earnings release. 2. Merchant Services includes purchased portfolios which had revenue of $768 and acquisition revenue adjustments of $0 for the three months ended March 31, 2021. 3. Merchant Services includes purchased portfolios which had revenue of $1,034 and acquisition revenue adjustments of $0 for the three months ended March 31, 2020. 4. Effective July 1, 2020, the Company reassigned a component from the Proprietary Software and Payments segment to the Merchant Services segment to better align the Company's business within its segments. The prior period comparatives have been retroactively adjusted to reflect the Company's current segment presentation. The reconciliation of our quarter to date revenue to non-GAAP adjusted net revenue is as follows:

6 Reconciliation of Non-GAAP Financial Measures ($ in thousands) Six months ended March 31, 2021 Merchant Services(2) Proprietary Software and Payments Other Total Revenue $ 50,962 $ 41,325 $ (1,111) $ 91,176 Acquisition revenue adjustments(1) 205 2,933 — 3,138 Adjusted Net Revenue $ 51,167 $ 44,258 $ (1,111) $ 94,314 ($ in thousands) Six months ended March 31, 2020(4) Merchant Services(3) Proprietary Software and Payments Other Total Revenue $ 53,968 $ 27,262 $ (941) $ 80,289 Acquisition revenue adjustments(1) — 646 — 646 Adjusted Net Revenue $ 53,968 $ 27,908 $ (941) $ 80,935 1. Under GAAP, companies must adjust, as necessary, beginning balances of acquired deferred revenue to fair value as part of acquisition accounting as defined by GAAP. Acquisition revenue adjustments remove the effect of these adjustments to acquisition date fair value from acquisitions that have closed as of the date of the earnings release. 2. Merchant Services includes purchased portfolios which had revenue of $1,703 and acquisition revenue adjustments of $0 for the six months ended March 31, 2021. 3. Merchant Services includes purchased portfolios which had revenue of $2,367 and acquisition revenue adjustments of $0 for the six months ended March 31, 2020. 4. Effective July 1, 2020, the Company reassigned a component from the Proprietary Software and Payments segment to the Merchant Services segment to better align the Company's business within its segments. The prior period comparatives have been retroactively adjusted to reflect the Company's current segment presentation. The reconciliation of our fiscal year to date revenue to non-GAAP adjusted net revenue is as follows:
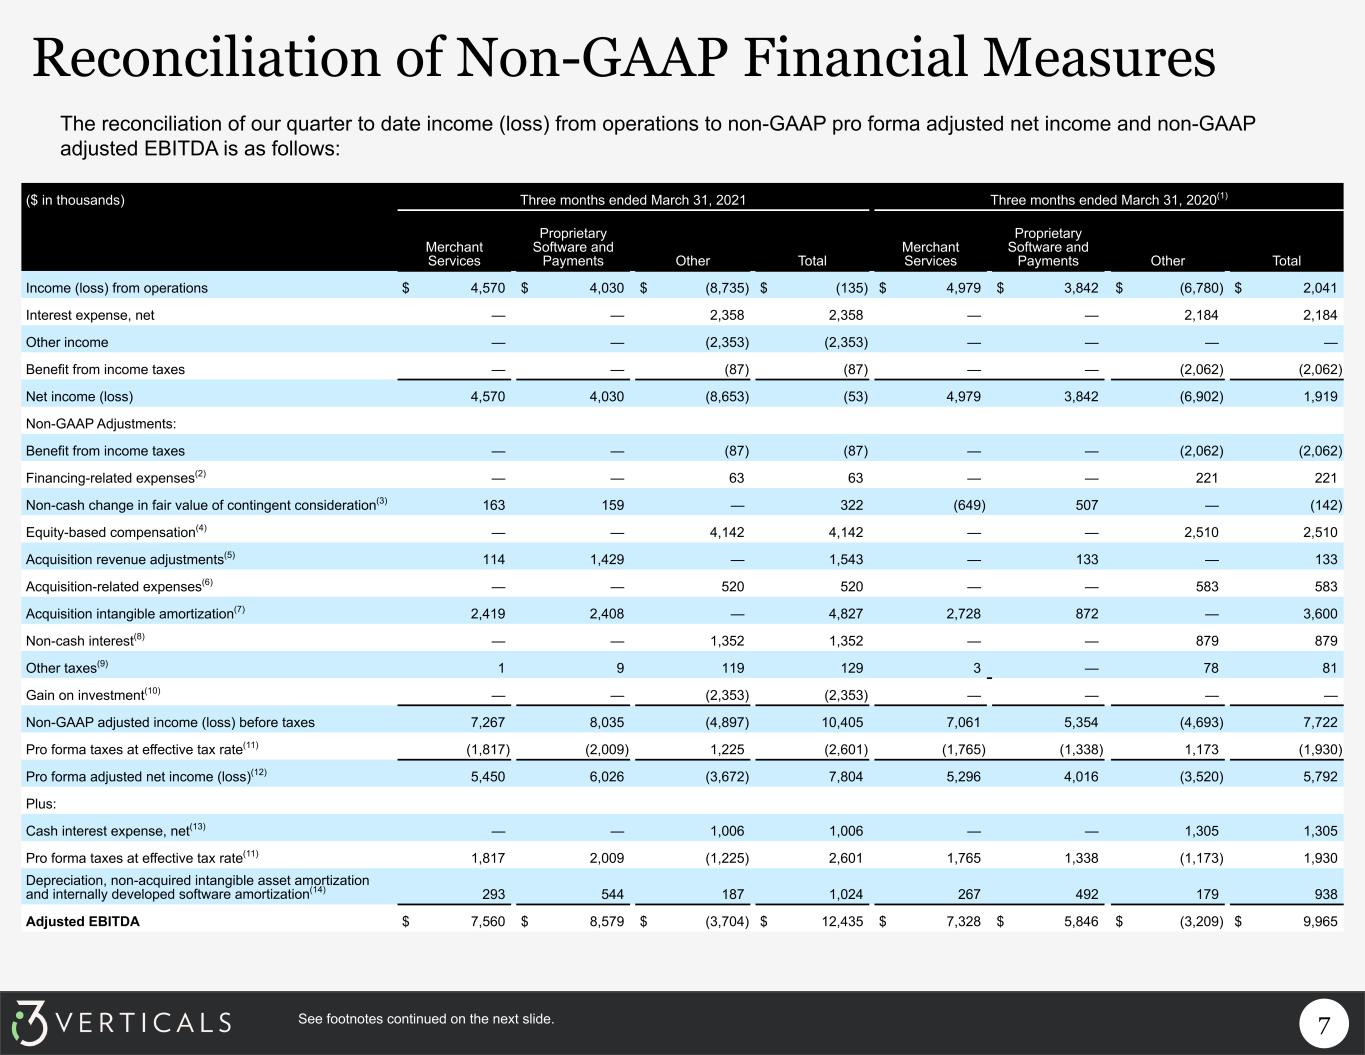
7 ($ in thousands) Three months ended March 31, 2021 Three months ended March 31, 2020(1) Merchant Services Proprietary Software and Payments Other Total Merchant Services Proprietary Software and Payments Other Total Income (loss) from operations $ 4,570 $ 4,030 $ (8,735) $ (135) $ 4,979 $ 3,842 $ (6,780) $ 2,041 Interest expense, net — — 2,358 2,358 — — 2,184 2,184 Other income — — (2,353) (2,353) — — — — Benefit from income taxes — — (87) (87) — — (2,062) (2,062) Net income (loss) 4,570 4,030 (8,653) (53) 4,979 3,842 (6,902) 1,919 Non-GAAP Adjustments: Benefit from income taxes — — (87) (87) — — (2,062) (2,062) Financing-related expenses(2) — — 63 63 — — 221 221 Non-cash change in fair value of contingent consideration(3) 163 159 — 322 (649) 507 — (142) Equity-based compensation(4) — — 4,142 4,142 — — 2,510 2,510 Acquisition revenue adjustments(5) 114 1,429 — 1,543 — 133 — 133 Acquisition-related expenses(6) — — 520 520 — — 583 583 Acquisition intangible amortization(7) 2,419 2,408 — 4,827 2,728 872 — 3,600 Non-cash interest(8) — — 1,352 1,352 — — 879 879 Other taxes(9) 1 9 119 129 3 — 78 81 Gain on investment(10) — — (2,353) (2,353) — — — — Non-GAAP adjusted income (loss) before taxes 7,267 8,035 (4,897) 10,405 7,061 5,354 (4,693) 7,722 Pro forma taxes at effective tax rate(11) (1,817) (2,009) 1,225 (2,601) (1,765) (1,338) 1,173 (1,930) Pro forma adjusted net income (loss)(12) 5,450 6,026 (3,672) 7,804 5,296 4,016 (3,520) 5,792 Plus: Cash interest expense, net(13) — — 1,006 1,006 — — 1,305 1,305 Pro forma taxes at effective tax rate(11) 1,817 2,009 (1,225) 2,601 1,765 1,338 (1,173) 1,930 Depreciation, non-acquired intangible asset amortization and internally developed software amortization(14) 293 544 187 1,024 267 492 179 938 Adjusted EBITDA $ 7,560 $ 8,579 $ (3,704) $ 12,435 $ 7,328 $ 5,846 $ (3,209) $ 9,965 See footnotes continued on the next slide. The reconciliation of our quarter to date income (loss) from operations to non-GAAP pro forma adjusted net income and non-GAAP adjusted EBITDA is as follows: Reconciliation of Non-GAAP Financial Measures
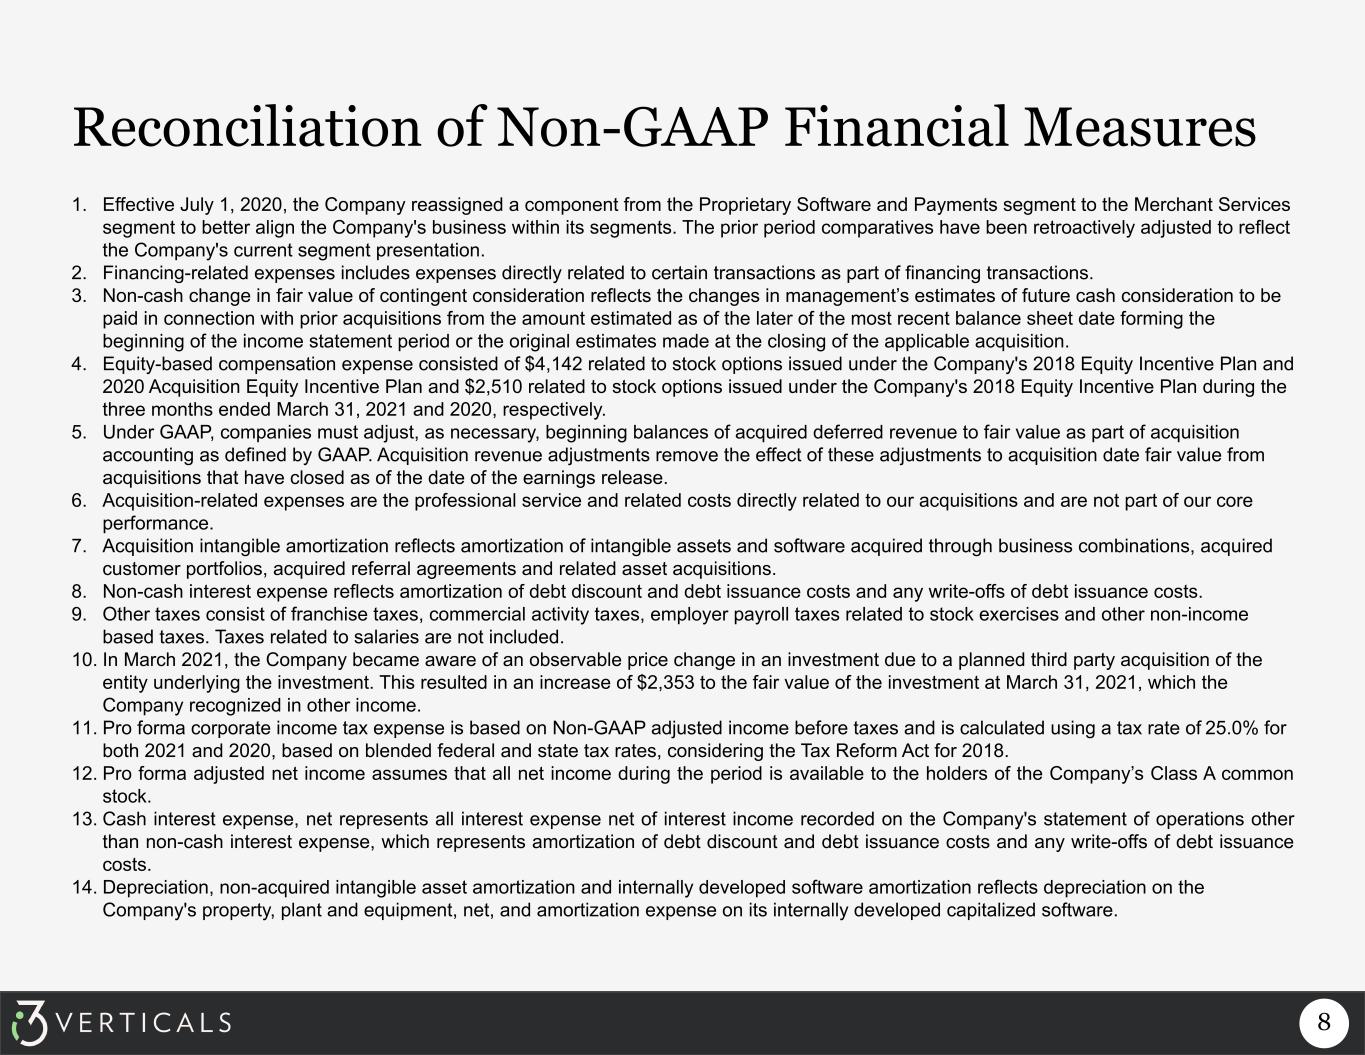
8 Reconciliation of Non-GAAP Financial Measures 1. Effective July 1, 2020, the Company reassigned a component from the Proprietary Software and Payments segment to the Merchant Services segment to better align the Company's business within its segments. The prior period comparatives have been retroactively adjusted to reflect the Company's current segment presentation. 2. Financing-related expenses includes expenses directly related to certain transactions as part of financing transactions. 3. Non-cash change in fair value of contingent consideration reflects the changes in management’s estimates of future cash consideration to be paid in connection with prior acquisitions from the amount estimated as of the later of the most recent balance sheet date forming the beginning of the income statement period or the original estimates made at the closing of the applicable acquisition. 4. Equity-based compensation expense consisted of $4,142 related to stock options issued under the Company's 2018 Equity Incentive Plan and 2020 Acquisition Equity Incentive Plan and $2,510 related to stock options issued under the Company's 2018 Equity Incentive Plan during the three months ended March 31, 2021 and 2020, respectively. 5. Under GAAP, companies must adjust, as necessary, beginning balances of acquired deferred revenue to fair value as part of acquisition accounting as defined by GAAP. Acquisition revenue adjustments remove the effect of these adjustments to acquisition date fair value from acquisitions that have closed as of the date of the earnings release. 6. Acquisition-related expenses are the professional service and related costs directly related to our acquisitions and are not part of our core performance. 7. Acquisition intangible amortization reflects amortization of intangible assets and software acquired through business combinations, acquired customer portfolios, acquired referral agreements and related asset acquisitions. 8. Non-cash interest expense reflects amortization of debt discount and debt issuance costs and any write-offs of debt issuance costs. 9. Other taxes consist of franchise taxes, commercial activity taxes, employer payroll taxes related to stock exercises and other non-income based taxes. Taxes related to salaries are not included. 10. In March 2021, the Company became aware of an observable price change in an investment due to a planned third party acquisition of the entity underlying the investment. This resulted in an increase of $2,353 to the fair value of the investment at March 31, 2021, which the Company recognized in other income. 11. Pro forma corporate income tax expense is based on Non-GAAP adjusted income before taxes and is calculated using a tax rate of 25.0% for both 2021 and 2020, based on blended federal and state tax rates, considering the Tax Reform Act for 2018. 12. Pro forma adjusted net income assumes that all net income during the period is available to the holders of the Company’s Class A common stock. 13. Cash interest expense, net represents all interest expense net of interest income recorded on the Company's statement of operations other than non-cash interest expense, which represents amortization of debt discount and debt issuance costs and any write-offs of debt issuance costs. 14. Depreciation, non-acquired intangible asset amortization and internally developed software amortization reflects depreciation on the Company's property, plant and equipment, net, and amortization expense on its internally developed capitalized software.
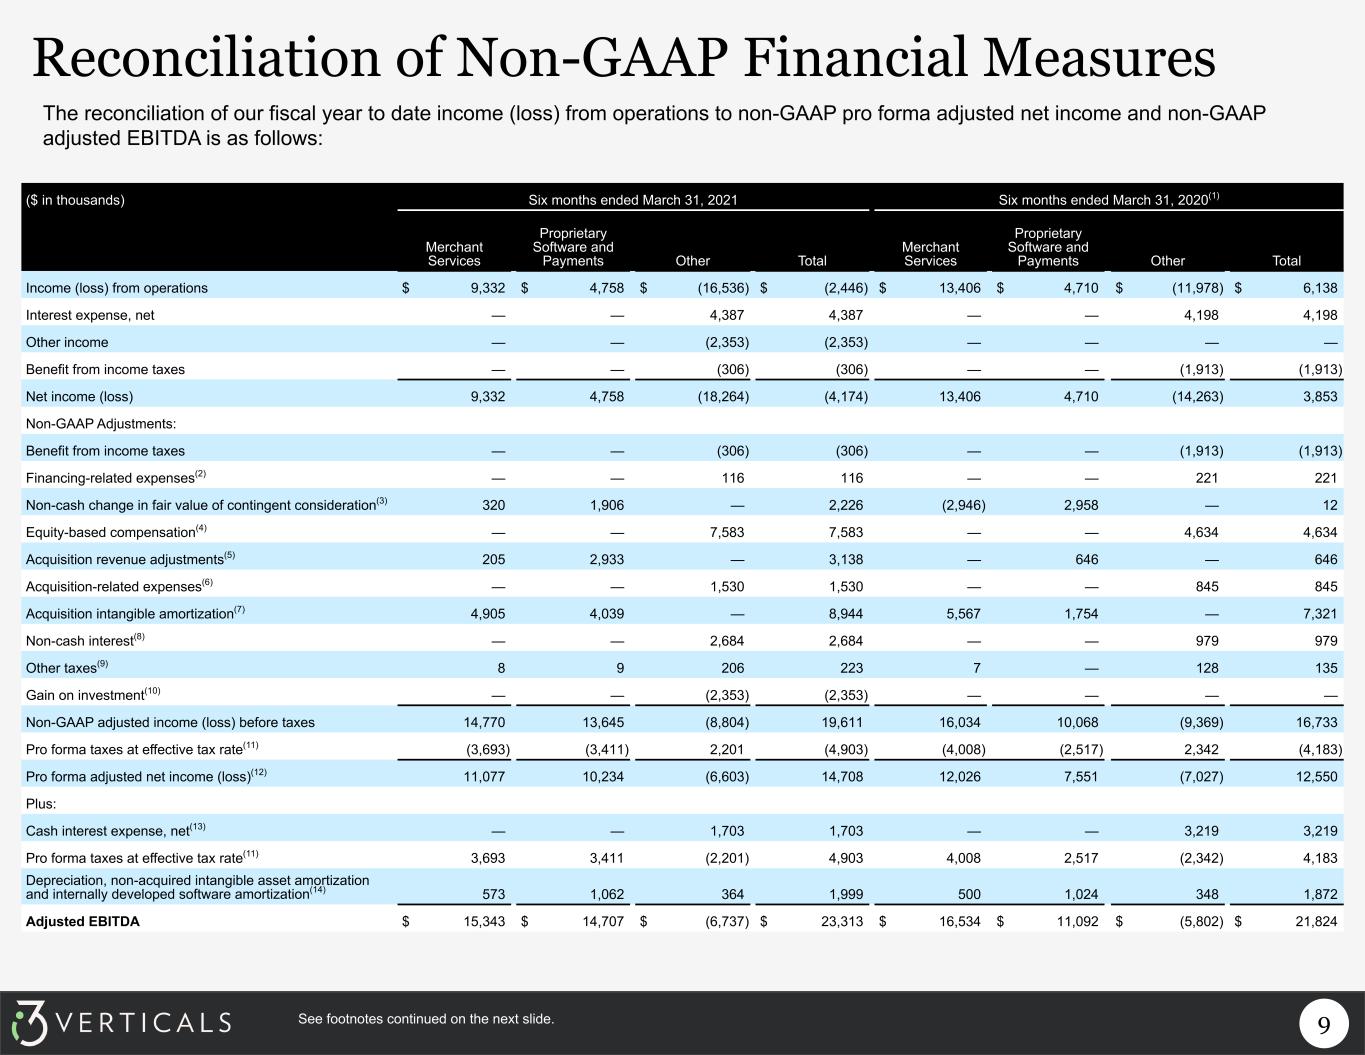
9 ($ in thousands) Six months ended March 31, 2021 Six months ended March 31, 2020(1) Merchant Services Proprietary Software and Payments Other Total Merchant Services Proprietary Software and Payments Other Total Income (loss) from operations $ 9,332 $ 4,758 $ (16,536) $ (2,446) $ 13,406 $ 4,710 $ (11,978) $ 6,138 Interest expense, net — — 4,387 4,387 — — 4,198 4,198 Other income — — (2,353) (2,353) — — — — Benefit from income taxes — — (306) (306) — — (1,913) (1,913) Net income (loss) 9,332 4,758 (18,264) (4,174) 13,406 4,710 (14,263) 3,853 Non-GAAP Adjustments: Benefit from income taxes — — (306) (306) — — (1,913) (1,913) Financing-related expenses(2) — — 116 116 — — 221 221 Non-cash change in fair value of contingent consideration(3) 320 1,906 — 2,226 (2,946) 2,958 — 12 Equity-based compensation(4) — — 7,583 7,583 — — 4,634 4,634 Acquisition revenue adjustments(5) 205 2,933 — 3,138 — 646 — 646 Acquisition-related expenses(6) — — 1,530 1,530 — — 845 845 Acquisition intangible amortization(7) 4,905 4,039 — 8,944 5,567 1,754 — 7,321 Non-cash interest(8) — — 2,684 2,684 — — 979 979 Other taxes(9) 8 9 206 223 7 — 128 135 Gain on investment(10) — — (2,353) (2,353) — — — — Non-GAAP adjusted income (loss) before taxes 14,770 13,645 (8,804) 19,611 16,034 10,068 (9,369) 16,733 Pro forma taxes at effective tax rate(11) (3,693) (3,411) 2,201 (4,903) (4,008) (2,517) 2,342 (4,183) Pro forma adjusted net income (loss)(12) 11,077 10,234 (6,603) 14,708 12,026 7,551 (7,027) 12,550 Plus: Cash interest expense, net(13) — — 1,703 1,703 — — 3,219 3,219 Pro forma taxes at effective tax rate(11) 3,693 3,411 (2,201) 4,903 4,008 2,517 (2,342) 4,183 Depreciation, non-acquired intangible asset amortization and internally developed software amortization(14) 573 1,062 364 1,999 500 1,024 348 1,872 Adjusted EBITDA $ 15,343 $ 14,707 $ (6,737) $ 23,313 $ 16,534 $ 11,092 $ (5,802) $ 21,824 See footnotes continued on the next slide. The reconciliation of our fiscal year to date income (loss) from operations to non-GAAP pro forma adjusted net income and non-GAAP adjusted EBITDA is as follows: Reconciliation of Non-GAAP Financial Measures
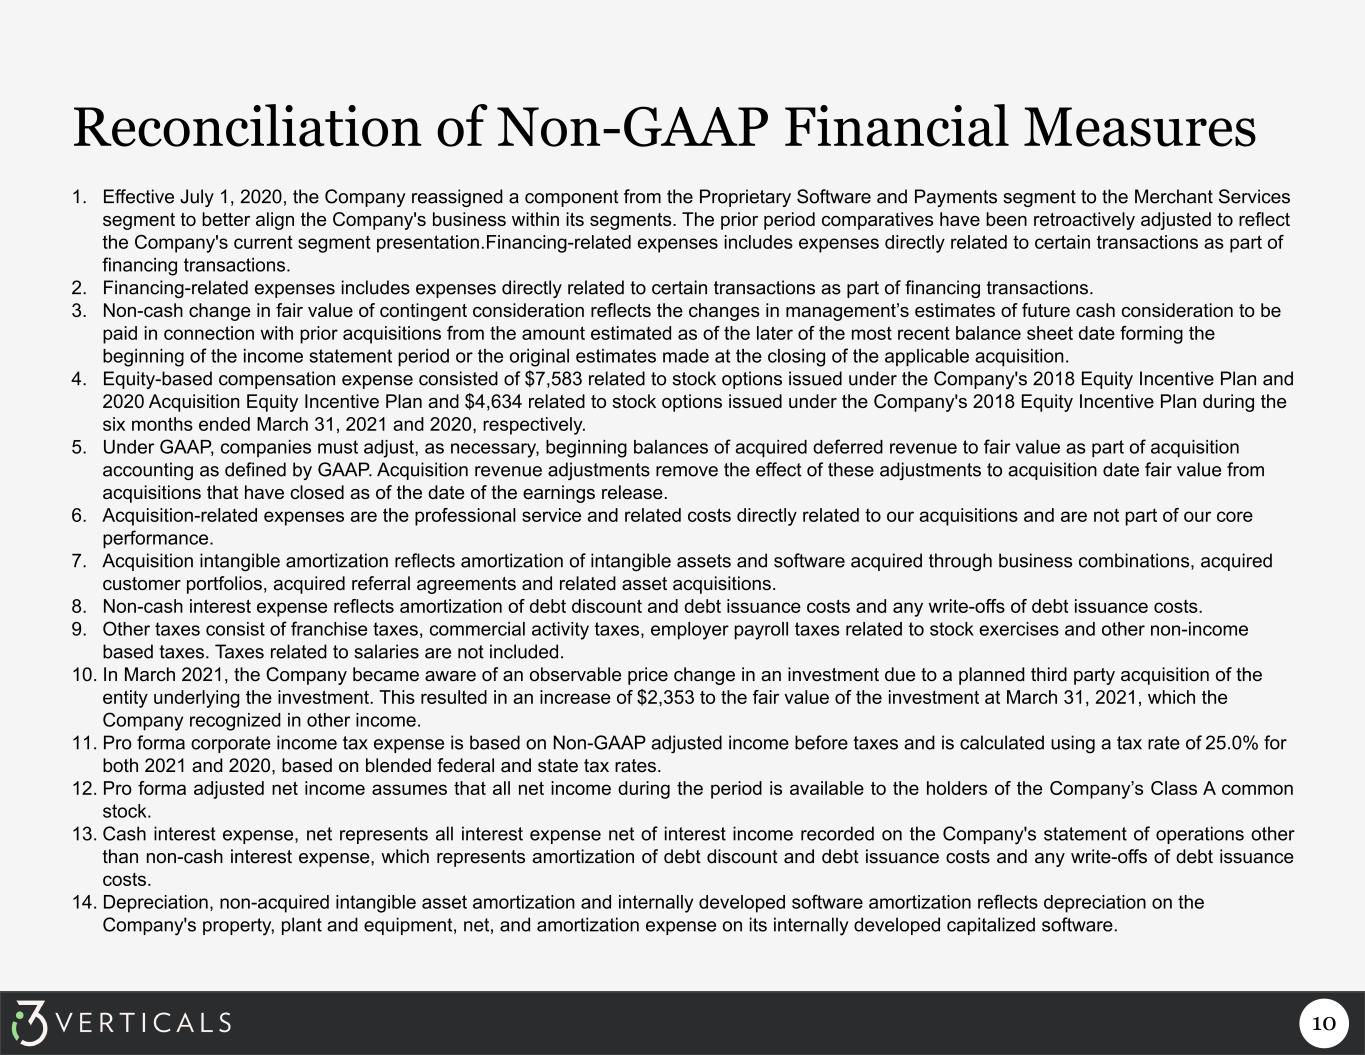
10 Reconciliation of Non-GAAP Financial Measures 1. Effective July 1, 2020, the Company reassigned a component from the Proprietary Software and Payments segment to the Merchant Services segment to better align the Company's business within its segments. The prior period comparatives have been retroactively adjusted to reflect the Company's current segment presentation.Financing-related expenses includes expenses directly related to certain transactions as part of financing transactions. 2. Financing-related expenses includes expenses directly related to certain transactions as part of financing transactions. 3. Non-cash change in fair value of contingent consideration reflects the changes in management’s estimates of future cash consideration to be paid in connection with prior acquisitions from the amount estimated as of the later of the most recent balance sheet date forming the beginning of the income statement period or the original estimates made at the closing of the applicable acquisition. 4. Equity-based compensation expense consisted of $7,583 related to stock options issued under the Company's 2018 Equity Incentive Plan and 2020 Acquisition Equity Incentive Plan and $4,634 related to stock options issued under the Company's 2018 Equity Incentive Plan during the six months ended March 31, 2021 and 2020, respectively. 5. Under GAAP, companies must adjust, as necessary, beginning balances of acquired deferred revenue to fair value as part of acquisition accounting as defined by GAAP. Acquisition revenue adjustments remove the effect of these adjustments to acquisition date fair value from acquisitions that have closed as of the date of the earnings release. 6. Acquisition-related expenses are the professional service and related costs directly related to our acquisitions and are not part of our core performance. 7. Acquisition intangible amortization reflects amortization of intangible assets and software acquired through business combinations, acquired customer portfolios, acquired referral agreements and related asset acquisitions. 8. Non-cash interest expense reflects amortization of debt discount and debt issuance costs and any write-offs of debt issuance costs. 9. Other taxes consist of franchise taxes, commercial activity taxes, employer payroll taxes related to stock exercises and other non-income based taxes. Taxes related to salaries are not included. 10. In March 2021, the Company became aware of an observable price change in an investment due to a planned third party acquisition of the entity underlying the investment. This resulted in an increase of $2,353 to the fair value of the investment at March 31, 2021, which the Company recognized in other income. 11. Pro forma corporate income tax expense is based on Non-GAAP adjusted income before taxes and is calculated using a tax rate of 25.0% for both 2021 and 2020, based on blended federal and state tax rates. 12. Pro forma adjusted net income assumes that all net income during the period is available to the holders of the Company’s Class A common stock. 13. Cash interest expense, net represents all interest expense net of interest income recorded on the Company's statement of operations other than non-cash interest expense, which represents amortization of debt discount and debt issuance costs and any write-offs of debt issuance costs. 14. Depreciation, non-acquired intangible asset amortization and internally developed software amortization reflects depreciation on the Company's property, plant and equipment, net, and amortization expense on its internally developed capitalized software.
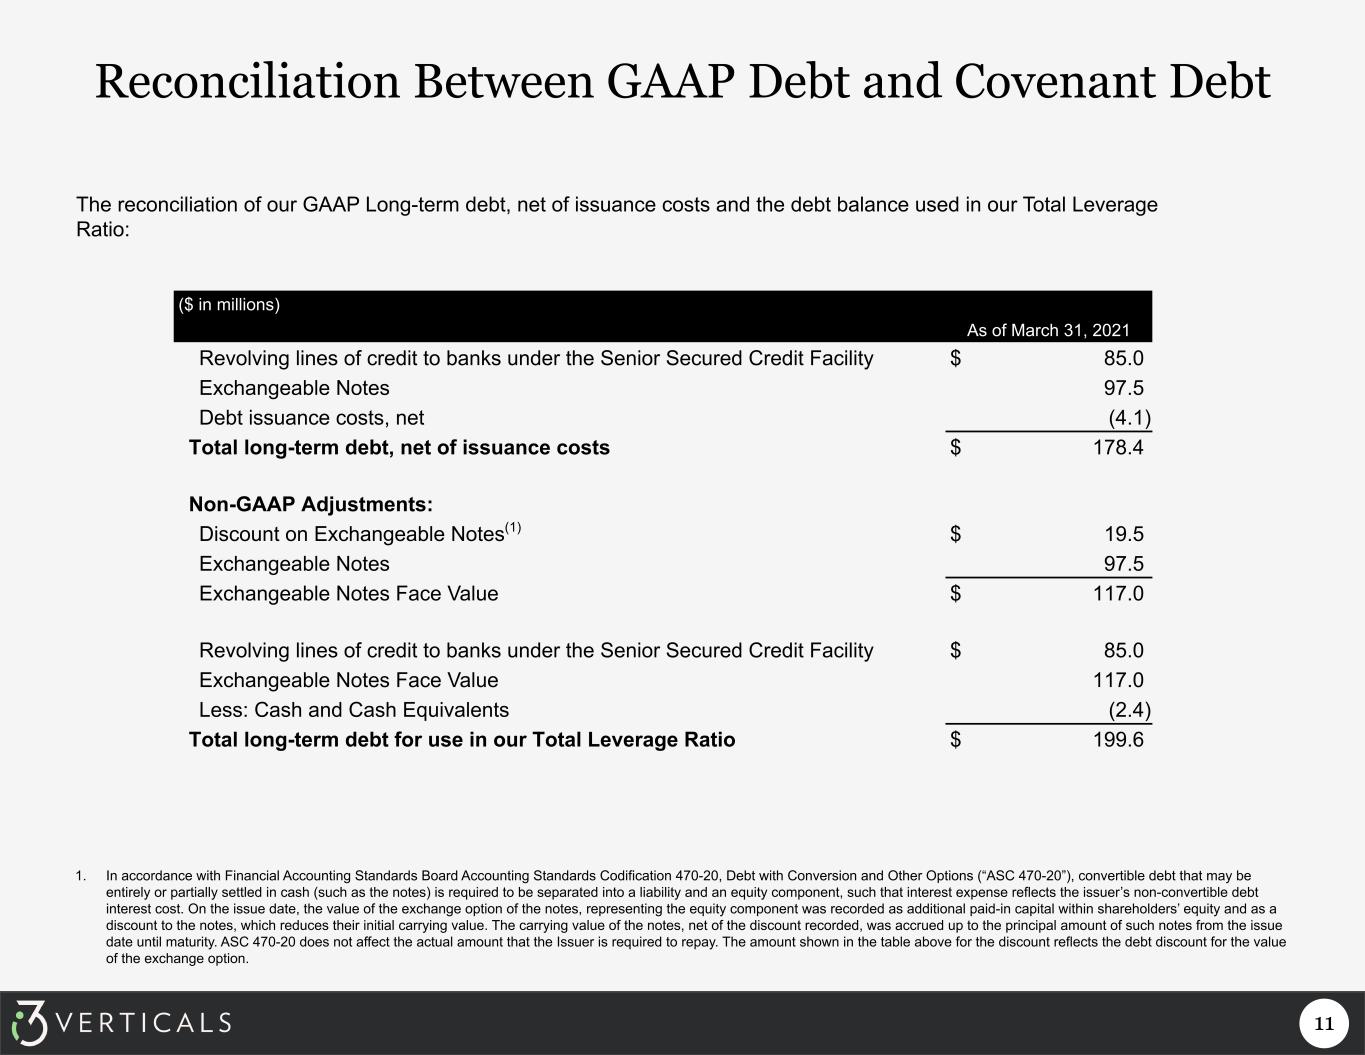
11 Reconciliation Between GAAP Debt and Covenant Debt ($ in millions) As of March 31, 2021 Revolving lines of credit to banks under the Senior Secured Credit Facility $ 85.0 Exchangeable Notes 97.5 Debt issuance costs, net (4.1) Total long-term debt, net of issuance costs $ 178.4 Non-GAAP Adjustments: Discount on Exchangeable Notes(1) $ 19.5 Exchangeable Notes 97.5 Exchangeable Notes Face Value $ 117.0 Revolving lines of credit to banks under the Senior Secured Credit Facility $ 85.0 Exchangeable Notes Face Value 117.0 Less: Cash and Cash Equivalents (2.4) Total long-term debt for use in our Total Leverage Ratio $ 199.6 The reconciliation of our GAAP Long-term debt, net of issuance costs and the debt balance used in our Total Leverage Ratio: 1. In accordance with Financial Accounting Standards Board Accounting Standards Codification 470-20, Debt with Conversion and Other Options (“ASC 470-20”), convertible debt that may be entirely or partially settled in cash (such as the notes) is required to be separated into a liability and an equity component, such that interest expense reflects the issuer’s non-convertible debt interest cost. On the issue date, the value of the exchange option of the notes, representing the equity component was recorded as additional paid-in capital within shareholders’ equity and as a discount to the notes, which reduces their initial carrying value. The carrying value of the notes, net of the discount recorded, was accrued up to the principal amount of such notes from the issue date until maturity. ASC 470-20 does not affect the actual amount that the Issuer is required to repay. The amount shown in the table above for the discount reflects the debt discount for the value of the exchange option.
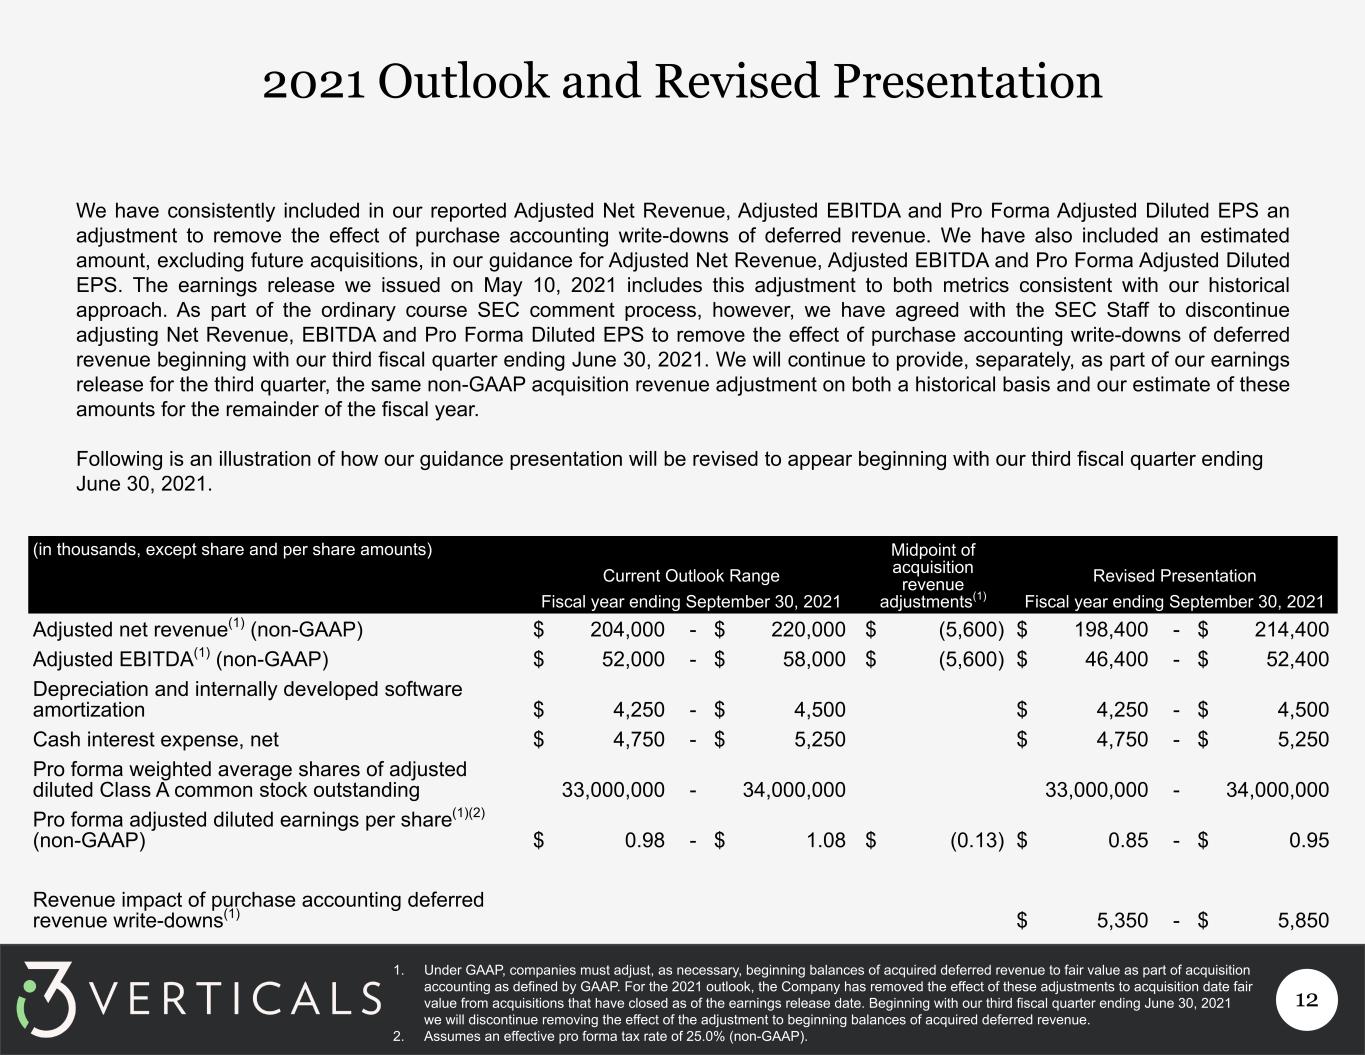
12 2021 Outlook and Revised Presentation We have consistently included in our reported Adjusted Net Revenue, Adjusted EBITDA and Pro Forma Adjusted Diluted EPS an adjustment to remove the effect of purchase accounting write-downs of deferred revenue. We have also included an estimated amount, excluding future acquisitions, in our guidance for Adjusted Net Revenue, Adjusted EBITDA and Pro Forma Adjusted Diluted EPS. The earnings release we issued on May 10, 2021 includes this adjustment to both metrics consistent with our historical approach. As part of the ordinary course SEC comment process, however, we have agreed with the SEC Staff to discontinue adjusting Net Revenue, EBITDA and Pro Forma Diluted EPS to remove the effect of purchase accounting write-downs of deferred revenue beginning with our third fiscal quarter ending June 30, 2021. We will continue to provide, separately, as part of our earnings release for the third quarter, the same non-GAAP acquisition revenue adjustment on both a historical basis and our estimate of these amounts for the remainder of the fiscal year. Following is an illustration of how our guidance presentation will be revised to appear beginning with our third fiscal quarter ending June 30, 2021. (in thousands, except share and per share amounts) Current Outlook Range Midpoint of acquisition revenue adjustments(1) Revised Presentation Fiscal year ending September 30, 2021 Fiscal year ending September 30, 2021 Adjusted net revenue(1) (non-GAAP) $ 204,000 - $ 220,000 $ (5,600) $ 198,400 - $ 214,400 Adjusted EBITDA(1) (non-GAAP) $ 52,000 - $ 58,000 $ (5,600) $ 46,400 - $ 52,400 Depreciation and internally developed software amortization $ 4,250 - $ 4,500 $ 4,250 - $ 4,500 Cash interest expense, net $ 4,750 - $ 5,250 $ 4,750 - $ 5,250 Pro forma weighted average shares of adjusted diluted Class A common stock outstanding 33,000,000 - 34,000,000 33,000,000 - 34,000,000 Pro forma adjusted diluted earnings per share(1)(2) (non-GAAP) $ 0.98 - $ 1.08 $ (0.13) $ 0.85 - $ 0.95 Revenue impact of purchase accounting deferred revenue write-downs(1) $ 5,350 - $ 5,850 1. Under GAAP, companies must adjust, as necessary, beginning balances of acquired deferred revenue to fair value as part of acquisition accounting as defined by GAAP. For the 2021 outlook, the Company has removed the effect of these adjustments to acquisition date fair value from acquisitions that have closed as of the earnings release date. Beginning with our third fiscal quarter ending June 30, 2021 we will discontinue removing the effect of the adjustment to beginning balances of acquired deferred revenue. 2. Assumes an effective pro forma tax rate of 25.0% (non-GAAP).
