Attached files
| file | filename |
|---|---|
| EX-99.4 - EXHIBIT 99.4 - Star Peak Corp II | tm2115705d1_ex99-4.htm |
| EX-99.3 - EXHIBIT 99.3 - Star Peak Corp II | tm2115705d1_ex99-3.htm |
| EX-99.1 - EXHIBIT 99.1 - Star Peak Corp II | tm2115705d1_ex99-1.htm |
| EX-10.4 - EXHIBIT 10.4 - Star Peak Corp II | tm2115705d1_ex10-4.htm |
| EX-10.3 - EXHIBIT 10.3 - Star Peak Corp II | tm2115705d1_ex10-3.htm |
| EX-10.2 - EXHIBIT 10.2 - Star Peak Corp II | tm2115705d1_ex10-2.htm |
| EX-10.1 - EXHIBIT 10.1 - Star Peak Corp II | tm2115705d1_ex10-1.htm |
| EX-2.1 - EXHIBIT 2.1 - Star Peak Corp II | tm2115705d1_ex2-1.htm |
| 8-K - FORM 8-K - Star Peak Corp II | tm2115705d1_8k.htm |
Exhibit 99.2
 |
Investor Presentation May 2021 |
 |
2 Disclaimer This presentation was prepared exclusively by Goldman Sachs & Co. LLC (“GS”), Credit Suisse Securities (USA) LLC (“Credit Suisse”) and Barclays Capital Inc. (“Barclays”) (and, together with GS and Credit Suisse, “we” or “us”) on a confidential basis and is being delivered to a limited number of accredited investors who have agreed to hold it in confidence. This presentation may not be copied or reproduced, or shown to or reviewed with any person other than the intended recipient and its authorized representatives. Although the information contained herein is believed to be accurate, GS, Credit Suisse, Barclays and each of the other parties mentioned herein, including for the avoidance of doubt, Star Peak Corp II (“Star Peak II”) and Benson Hill, Inc. (“Benson Hill”) (as well as each of their respective directors, officers, shareholders, members, partners and representatives), expressly disclaims liability for, and makes no expressed or implied representation or warranty with respect to, any information contained in or omitted from this presentation, or any other information or communication (whether written or oral) transmitted to any prospective investor. Only those representations and warranties made in a definitive agreement with any person shall have any legal effect. PAST PERFORMANCE IS NO GUARANTEE OF FUTURE PERFORMANCE. The recipient of this presentation acknowledges that it is (a) aware that United States securities laws prohibit any person who has material, non-public information concerning a company from purchasing and selling securities of such company or from communicating such information to any other person under circumstances in which it is reasonably foreseeable that such person may purchase or sell such securities and (b) that the recipient will neither use, nor cause any third party to use, this investor presentation or any information contained herein in violation of the Securities Exchange Act of 1934, as amended, including, without limitation, Rule 10b-5 thereunder. These forward-looking statements are provided for illustrative purposes only and are not intended to serve as, and must not be relied on by any investor as, a guarantee, an assurance, a prediction or a definitive statement of fact or probability. Actual events and circumstances are difficult or impossible to predict and will differ from assumptions. Many actual events and circumstances are beyond the control of Benson Hill and Star Peak II. These forward-looking statements are subject to a number of risks and uncertainties, including changes in domestic and foreign business, market, financial, political, and legal conditions; the inability of the parties to successfully or timely consummate the proposed Business Combination, including the risk that any required regulatory approvals are not obtained, are delayed or are subject to unanticipated conditions that could adversely affect the combined company or the expected benefits of the proposed Business Combination or that the approval of stockholders is not obtained; failure to realize the anticipated benefits of the proposed Business Combination; risks relating to the uncertainty of the projected financial information with respect to Benson Hill; risks related to the timing of expected business milestones; the effects of competition on Benson Hill’s business; the amount of redemption requests made by Star Peak II’s public stockholders; the ability of Star Peak II or the combined company to issue equity or equity-linked securities in connection with the proposed business combination or in the future; the impact of the global COVID-19 pandemic; and those risk factors discussed in Star Peak II’s registration statement on Form S-1 (Reg. No. 333-251488) under the heading “Risk Factors,” and other documents Star Peak II has, or will, file with the Securities and Exchange Commission (“SEC”). If any of these risks materialize or the underlying assumptions prove incorrect, actual results could differ materially from the results implied by these forward-looking statements. There may be additional risks that neither Star Peak II nor Benson Hill presently know or that they currently believe are immaterial that could also cause actual results to differ from those contained in the forward-looking statements. In addition, forward-looking statements reflect Star Peak II’s and Benson Hill’s expectations, plans or forecasts of future events and views as of the date of this presentation. While Star Peak II and Benson Hill may elect to update these forward-looking statements at some point in the future, Star Peak II and Benson Hill specifically disclaim any obligation to do so. These forward-looking statements should not be relied upon as representing Star Peak II’s and Benson Hill’s assessments as of any date subsequent to the date of this presentation. Accordingly, undue reliance should not be placed upon the forward-looking statements. Neither Star Peak II, Benson Hill, nor any of their respective affiliates have any obligation to update this presentation. Although all information and opinions expressed in this presentation were obtained from sources believed to be reliable and in good faith, no representation or warranty, express or implied, is made as to its accuracy or completeness. This presentation contains preliminary information only, is subject to change at any time and is not, and should not be assumed to be, complete or to constitute all the information necessary to adequately make an informed decision regarding your engagement with Star Peak II and Benson Hill. Forward-Looking Statements This presentation includes “forward-looking statements” within the meaning of the “safe harbor” provisions of the United States Private Securities Litigation Reform Act of 1995. Forward-looking statements may be identified by the use of words such as “estimate,” “plan,” “project,” “forecast,” “intend,” “will,” “expect,” “anticipate,” “believe,” “seek,” “target” or other similar expressions that predict or indicate future events or trends or that are not statements of historical matters. These forward-looking statements include, but are not limited to, statements regarding estimates and forecasts of other financial and performance metrics, projections of market opportunity and anticipated financial impacts of the proposed business combination between Star Peak II and Benson Hill (the “Business Combination”). These statements are based on various assumptions, whether or not identified in this presentation, and on the current expectations of respective management of Benson Hill and Star Peak II and are not predictions of actual performance. |
 |
3 Disclaimer (Cont’d) Use of Projections and Financial Information Trademarks and Trade Names This presentation contains financial forecasts relating to the anticipated future financial performance of Benson Hill, the proposed acquiror and the combined company. For example, projections of future EBITDA and Adjusted EBITDA and other metrics are forward-looking statements. Such financial forecasts constitute forward-looking information, are for illustrative purposes only and should not be relied upon as necessarily being indicative of future results. Actual results may differ materially from the results contemplated by the financial forecasts contained in this presentation, and the inclusion of such information in this presentation should not be regarded as a representation by any person that the results reflected in such forecasts will be achieved. Use of Non-GAAP Financial Measures Star Peak II and Benson Hill own or have rights to various trademarks, service marks and trade names that they use in connection with the operation of their respective businesses. This presentation also contains trademarks, service marks and trade names of third parties, which are the property of their respective owners. The use or display of third parties' trademarks, service marks, trade names or products in this presentation is not intended to, and does not imply, a relationship with Star Peak II or Benson Hill, or an endorsement or sponsorship by or of Star Peak II or Benson Hill. Solely for convenience, the trademarks, service marks and trade names referred to in this presentation may appear without the ®, TM or SM symbols, but such references are not intended to indicate, in any way, that Star Peak II or Benson Hill will not assert, to the fullest extent under applicable law, their rights or the right of the applicable licensor to these trademarks, service marks and trade names. This presentation also includes references to financial measures (including on a forward-looking basis) that are calculated and presented on the basis of methodologies other than in accordance with generally accepted accounting principles in the United States of America (“GAAP”) such as EBITDA and EBITDA margin. Any non-GAAP financial measures used in this presentation are in addition to, and should not be considered superior to, or a substitute for, net income, operating income or any other financial measures derived in accordance with GAAP. Non-GAAP financial measures should not be considered in isolation and are subject to significant inherent limitations. The non-GAAP measures presented herein may not be comparable to similar non-GAAP measures presented by other companies. Benson Hill believes these non-GAAP measures of financial results provide useful information to management and investors regarding certain financial and business trends relating to Benson Hill's financial condition and results of operations. Benson Hill believes that the use of these non-GAAP financial measures provides an additional tool for investors to use in evaluating ongoing operating results and trends in and in comparing Benson Hill's financial measures with other similar companies, many of which present similar non-GAAP financial measures to investors. These non-GAAP financial measures are subject to inherent limitations as they reflect the exercise of judgments by management about which expense and income are excluded or included in determining these non-GAAP financial measures. Additionally, to the extent that forward-looking non-GAAP financial measures are provided, they are presented on a non-GAAP basis without reconciliations of such forward-looking non-GAAP numbers due to the inherent difficulty in forecasting and quantifying certain amounts that are necessary for such reconciliations. Other Disclaimers Neither GS, Credit Suisse nor Barclays has assumed any responsibility for independent verification of any of the information contained herein and GS, Credit Suisse and Barclays have relied on such information being complete and accurate in all material respects. Accordingly, no representation or warranty, express or implied, can be made or is made by GS, Credit Suisse or Barclays as to the accuracy or completeness of any such information. Except where otherwise indicated, this presentation speaks as of the date hereof and is necessarily based upon the information available to GS, Credit Suisse and Barclays and financial, stock market and other conditions and circumstances existing and disclosed to GS, Credit Suisse and Barclays as of the date hereof, all of which are subject to change. Neither GS, Credit Suisse nor Barclays has any obligation to update, bring-down, review or reaffirm this presentation. Under no circumstances should the delivery of this presentation imply that any information or analyses included in this presentation would be the same if made as of any other date. Nothing contained in this presentation is, or shall be relied upon as, a promise or representation as to the past, present or future. |
 |
4 Disclaimer (Cont’d) This presentation provides summary information only and is being delivered solely for informational purposes. The recipient of this presentation acknowledges that: 1. GS, Credit Suisse, Barclays, Star Peak II and Benson Hill do not provide legal, tax or accounting advice of any kind. 2. It is not relying on GS, Credit Suisse, Barclays, Star Peak II or Benson Hill for legal, tax or accounting advice, and that the recipient should receive separate and qualified legal, tax and accounting advice in connection with any transaction or course of conduct. Stockholders will also be able to obtain copies of the preliminary proxy statement/prospectus, the definitive proxy statement/prospectus and other documents filed with the SEC, without charge, once available, at the SEC’s website at www.sec.gov, or by directing a request to: Star Peak Corp II, 1603 Orrington Avenue, 13th Floor, Evanston, IL 60201. Star Peak II and its directors and executive officers may be deemed participants in the solicitation of proxies from Star Peak II’s stockholders with respect to the proposed Business Combination. A list of the names of those directors and executive officers and a description of their interests in Star Peak II is contained in Star Peak II’s final prospectus related to its initial public offering dated January 5, 2021, which was filed with the SEC and is available free of charge at the SEC’s web site at www.sec.gov, or by directing a request to: Star Peak Corp II, 1603 Orrington Avenue, 13th Floor, Evanston, IL 60201. Additional information regarding the interests of such participants will be contained in the proxy statement/prospectus for the proposed Business Combination when available. Benson Hill and its directors and executive officers may also be deemed to be participants in the solicitation of proxies from the stockholders of Star Peak II in connection with the proposed Business Combination. A list of the names of such directors and executive officers and information regarding their interests in the proposed Business Combination will be included in the proxy statement for the proposed Business Combination when available. 3. Nothing contained herein shall be deemed to be a recommendation from GS, Credit Suisse, Barclays, Star Peak II or Benson Hill to any party to enter into any transaction or to take any course of action. 4. This presentation is not intended to provide a basis for evaluating any transaction or other matter. 5. This presentation is confidential and may not be copied by, or disclosed or made available to, any person without the prior written consent of GS, Credit Suisse and Barclays. 6. None of GS, Credit Suisse, Barclays, Star Peak II or Benson Hill shall have any liability, whether direct or indirect, in contract or tort or otherwise, to any person in connection with this presentation. In connection with the Business Combination, Star Peak II intends to file with the SEC a registration statement on Form S-4 containing a preliminary proxy statement and a preliminary prospectus of Star Peak II, and after the registration statement is declared effective, Star Peak II will mail a definitive proxy statement/prospectus relating to the proposed Business Combination to its stockholders. This presentation does not contain all the information that should be considered concerning the proposed Business Combination and is not intended to form the basis of any investment decision or any other decision in respect of the Business Combination. Star Peak II’s stockholders and other interested persons are advised to read, when available, the preliminary proxy statement/prospectus and the amendments thereto and the definitive proxy statement/prospectus and other documents filed in connection with the proposed Business Combination, as these materials will contain important information about Star Peak II, Benson Hill and the Business Combination. When available, the definitive proxy statement/prospectus and other relevant materials for the proposed Business Combination will be mailed to stockholders of Star Peak II as of a record date to be established for voting on the proposed Business Combination. INVESTMENT IN ANY SECURITIES DESCRIBED HEREIN HAS NOT BEEN APPROVED OR DISAPPROVED BY THE SECURITIES AND EXCHANGE COMMISSION OR ANY OTHER REGULATORY AUTHORITY NOR HAS ANY REGULATORY AUTHORITY PASSED UPON OR ENDORSED THE MERITS OF THE OFFERING OR THE ACCURACY OR ADEQUACY OF THE INFORMATION CONTAINED HEREIN. ANY REPRESENTATION TO THE CONTRARY IS A CRIMINAL OFFENSE. THIS PRESENTATION DOES NOT CONSTITUTE AN OFFER OR SOLICITATION OF ANY SECURITIES. STAR PEAK II WILL MAKE ANY OFFER TO SELL SECURITIES ONLY PURSUANT TO A DEFINITIVE SUBSCRIPTION AGREEMENT, AND STAR PEAK II RESERVES THE RIGHT TO WITHDRAW OR AMEND FOR ANY REASON ANY OFFERING AND TO REJECT ANY SUBSCRIPTION AGREEMENT IN WHOLE OR IN PART FOR ANY REASON. |
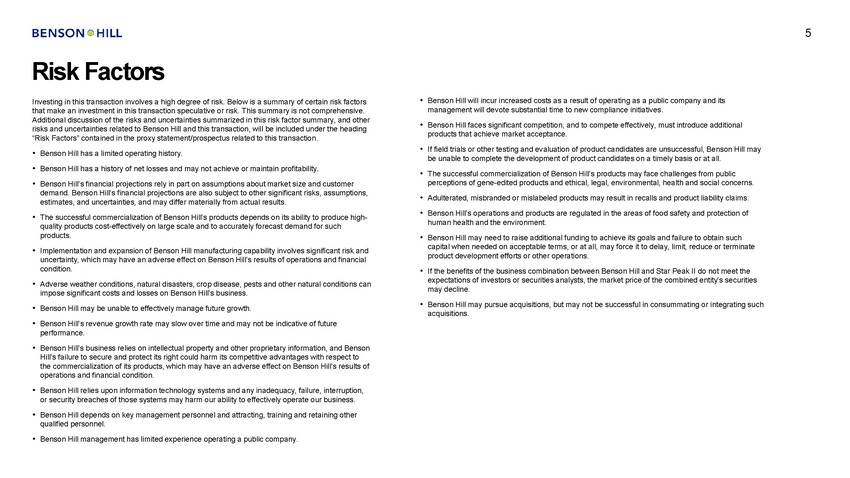 |
5 Risk Factors Investing in this transaction involves a high degree of risk. Below is a summary of certain risk factors that make an investment in this transaction speculative or risk. This summary is not comprehensive. Additional discussion of the risks and uncertainties summarized in this risk factor summary, and other risks and uncertainties related to Benson Hill and this transaction, will be included under the heading “Risk Factors” contained in the proxy statement/prospectus related to this transaction. • Benson Hill will incur increased costs as a result of operating as a public company and its management will devote substantial time to new compliance initiatives. Benson Hill faces significant competition, and to compete effectively, must introduce additional products that achieve market acceptance. If field trials or other testing and evaluation of product candidates are unsuccessful, Benson Hill may be unable to complete the development of product candidates on a timely basis or at all. The successful commercialization of Benson Hill’s products may face challenges from public perceptions of gene-edited products and ethical, legal, environmental, health and social concerns. • • • • • Benson Hill has a limited operating history. Benson Hill has a history of net losses and may not achieve or maintain profitability. • Benson Hill’s financial projections rely in part on assumptions about market size and customer demand. Benson Hill’s financial projections are also subject to other significant risks, assumptions, estimates, and uncertainties, and may differ materially from actual results. The successful commercialization of Benson Hill’s products depends on its ability to produce high-quality products cost-effectively on large scale and to accurately forecast demand for such products. Implementation and expansion of Benson Hill manufacturing capability involves significant risk and uncertainty, which may have an adverse effect on Benson Hill’s results of operations and financial condition. Adverse weather conditions, natural disasters, crop disease, pests and other natural conditions can impose significant costs and losses on Benson Hill’s business. Benson Hill may be unable to effectively manage future growth. Benson Hill’s revenue growth rate may slow over time and may not be indicative of future performance. Benson Hill’s business relies on intellectual property and other proprietary information, and Benson Hill’s failure to secure and protect its right could harm its competitive advantages with respect to the commercialization of its products, which may have an adverse effect on Benson Hill’s results of operations and financial condition. Benson Hill relies upon information technology systems and any inadequacy, failure, interruption, or security breaches of those systems may harm our ability to effectively operate our business. Benson Hill depends on key management personnel and attracting, training and retaining other qualified personnel. Benson Hill management has limited experience operating a public company. • • Adulterated, misbranded or mislabeled products may result in recalls and product liability claims. Benson Hill’s operations and products are regulated in the areas of food safety and protection of human health and the environment. Benson Hill may need to raise additional funding to achieve its goals and failure to obtain such capital when needed on acceptable terms, or at all, may force it to delay, limit, reduce or terminate product development efforts or other operations. If the benefits of the business combination between Benson Hill and Star Peak II do not meet the expectations of investors or securities analysts, the market price of the combined entity’s securities may decline. Benson Hill may pursue acquisitions, but may not be successful in consummating or integrating such acquisitions. • • • • • • • • • • • • |
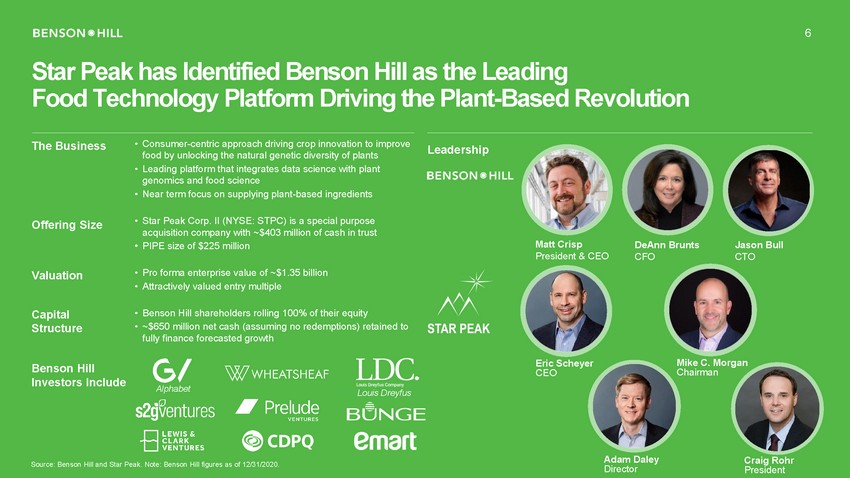 |
6 Star Peak has Identified Benson Hill as the Leading Food Technology Platform Driving the Plant-Based Revolution • Consumer-centric approach driving crop innovation to improve food by unlocking the natural genetic diversity of plants Leading platform that integrates data science with plant genomics and food science Near term focus on supplying plant-based ingredients The Business Leadership • • • Star Peak Corp. II (NYSE: STPC) is a special purpose acquisition company with ~$403 million of cash in trust PIPE size of $225 million Offering Size Matt Crisp President & CEO DeAnn Brunts CFO Jason Bull CTO • • • Pro forma enterprise value of ~$1.35 billion Attractively valued entry multiple Valuation Capital Structure • • Benson Hill shareholders rolling 100% of their equity ~$650 million net cash (assuming no redemptions) retained to fully finance forecasted growth Eric Scheyer CEO Mike C. Morgan Chairman Benson Hill Investors Include Alphabet Adam Daley Director Craig Rohr President Source: Benson Hill and Star Peak. Note: Benson Hill figures as of 12/31/2020. Louis Dreyfus |
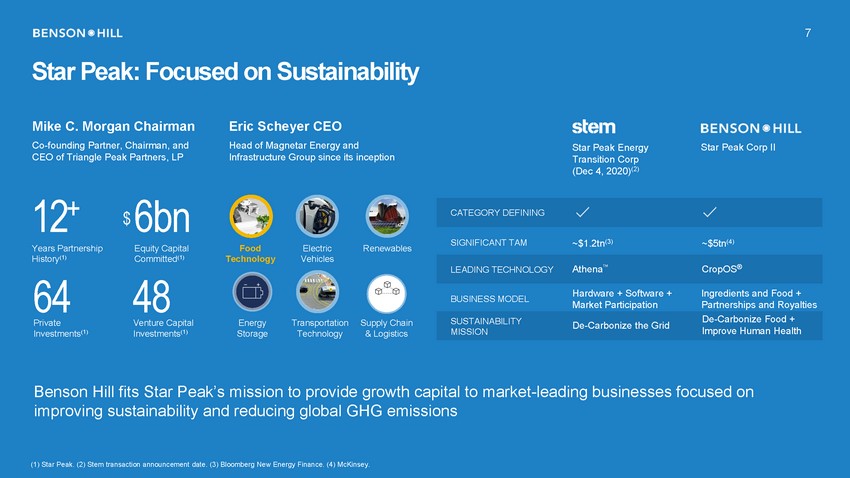 |
7 Star Peak: Focused on Sustainability Mike C. Morgan Chairman Co-founding Partner, Chairman, and CEO of Triangle Peak Partners, LP Eric Scheyer CEO Head of Magnetar Energy and Infrastructure Group since its inception Star Peak Energy Transition Corp (Dec 4, 2020)(2) Star Peak Corp II 12+ Years Partnership History(1) $ 6bn Equity Capital Committed(1) ~$1.2tn(3) ~$5tn(4) SIGNIFICANT TAM Food Technology Electric Vehicles Renewables TM 64 Private Investments(1) 48 Venture Capital Investments(1) Hardware + Software + Market Participation Ingredients and Food + Partnerships and Royalties BUSINESS MODEL Energy Storage Transportation Technology Supply Chain & Logistics Benson Hill fits Star Peak’s mission to provide growth capital to market-leading businesses focused on improving sustainability and reducing global GHG emissions (1) Star Peak. (2) Stem transaction announcement date. (3) Bloomberg New Energy Finance. (4) McKinsey. SUSTAINABILITYDe-Carbonize the GridDe-Carbonize Food + MISSIONImprove Human Health LEADING TECHNOLOGYAthenaCropOS® CATEGORY DEFINING |
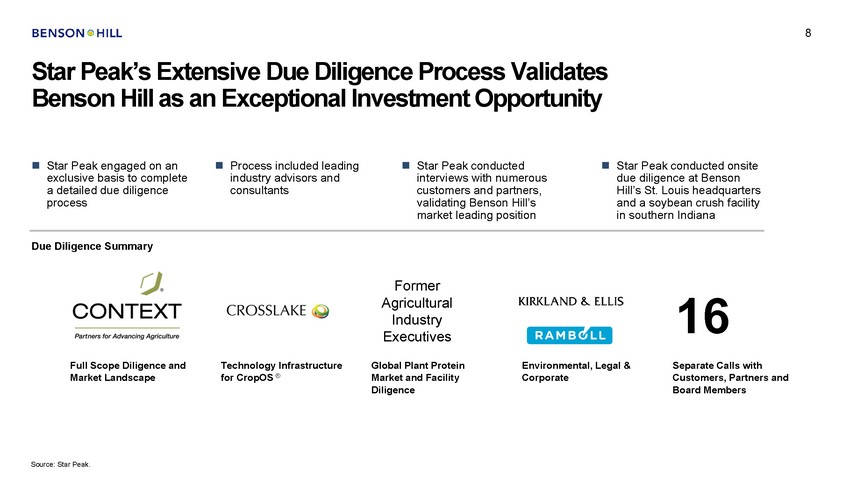 |
8 Star Peak’s Extensive Due Diligence Process Validates Benson Hill as an Exceptional Investment Opportunity Star Peak engaged on an exclusive basis to complete a detailed due diligence process Process included leading industry advisors and consultants Star Peak conducted interviews with numerous customers and partners, validating Benson Hill’s market leading position Star Peak conducted onsite due diligence at Benson Hill’s St. Louis headquarters and a soybean crush facility in southern Indiana Due Diligence Summary Former Agricultural Industry Executives 16 Separate Calls with Customers, Partners and Board Members Full Scope Diligence and Market Landscape Technology Infrastructure for CropOS ® Global Plant Protein Market and Facility Diligence Environmental, Legal & Corporate Source: Star Peak. |
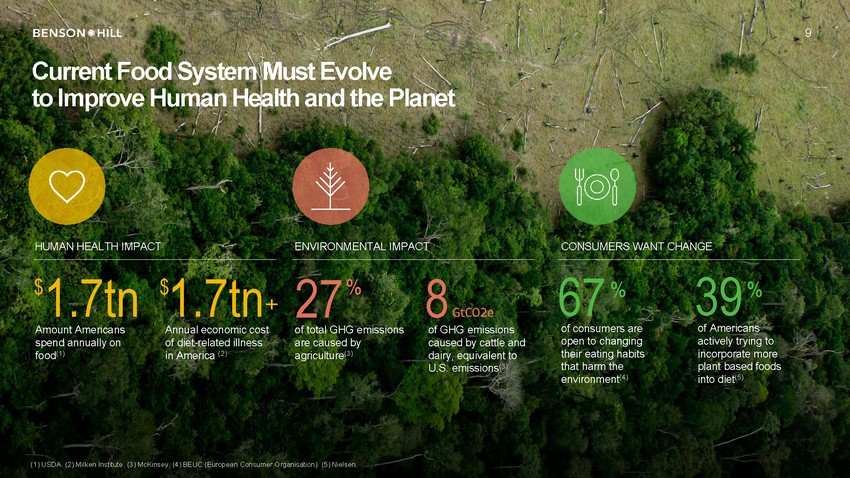 |
9 Current Food System Must Evolve to Improve Human Health and the Planet HUMAN HEALTH IMPACT ENVIRONMENTAL IMPACT CONSUMERS WANT CHANGE 67 39 1.7tn 1.7tn+ 27 8 GtCO2e of GHG emissions caused by cattle and dairy, equivalent to U.S. emissions(3) $ $ % % % of consumers are open to changing their eating habits that harm the environment(4) of Americans actively trying to incorporate more plant based foods into diet(5) Amount Americans spend annually on food(1) Annual economic cost of diet-related illness in America (2) of total GHG emissions are caused by agriculture(3) (1) USDA. (2) Milken Institute. (3) McKinsey. (4) BEUC (European Consumer Organisation). (5) Nielsen. |
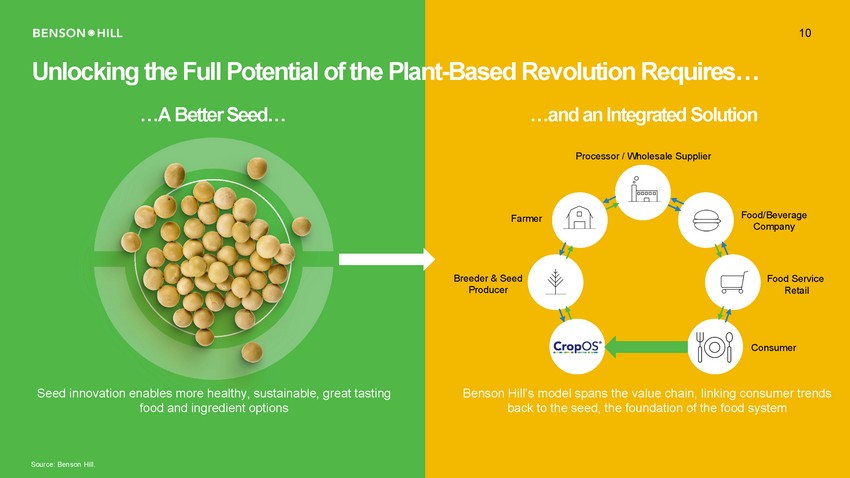 |
10 Unlocking the Full Potential of the Pla …A Better Seed… t-Based Revolution Requires… …and an Integrated Solution Processor / Wholesale Supplier Food/Beverage Company Farmer Breeder & Seed Producer Food Service Retail Consumer Seed innovation enables more healthy, sustainable, great tasting food and ingredient options Benson Hill’s model spans the value chain, linking consumer trends back to the seed, the foundation of the food system Source: Benson Hill. |
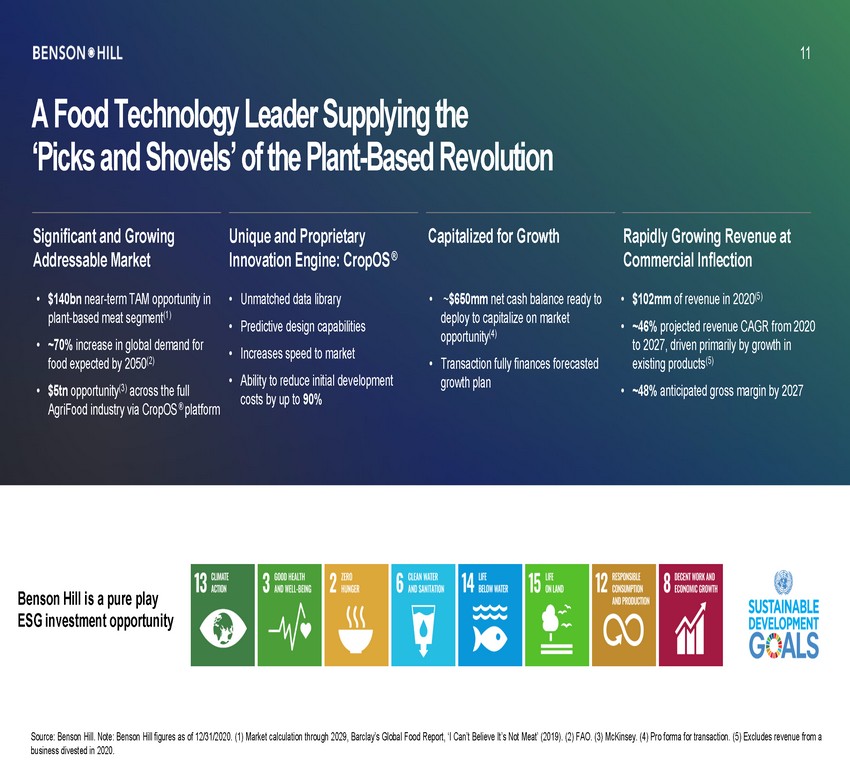 |
11 A Food Technology Leader Supplying the ‘Picks and Shovels’ of the Plant-Based Revolution Significant and Growing Addressable Market Unique and Proprietary Innovation Engine: CropOS ® Capitalized for Growth Rapidly Growing Revenue at Commercial Inflection $102mm of revenue in 2020(5) ~46% projected revenue CAGR from 2020 to 2027, driven primarily by growth in existing products(5) ~48% anticipated gross margin by 2027 • $140bn near-term TAM opportunity in plant-based meat segment(1) ~70% increase in global demand for food expected by 2050(2) $5tn opportunity(3) across the full AgriFood industry via CropOS ® platform • • • • Unmatched data library Predictive design capabilities Increases speed to market Ability to reduce initial development costs by up to 90% • ~$650mm net cash balance ready to deploy to capitalize on market opportunity(4) Transaction fully finances forecasted growth plan • • • • • • Benson Hill is a pure play ESG investment opportunity Source: Benson Hill. Note: Benson Hill figures as of 12/31/2020. (1) Market calculation through 2029, Barclay’s Global Food Report, ‘I Can’t Believe It’s Not Meat’ (2019). (2) FAO. (3) McKinsey. (4) Pro forma for transaction. (5) Excludes revenue from a business divested in 2020. |
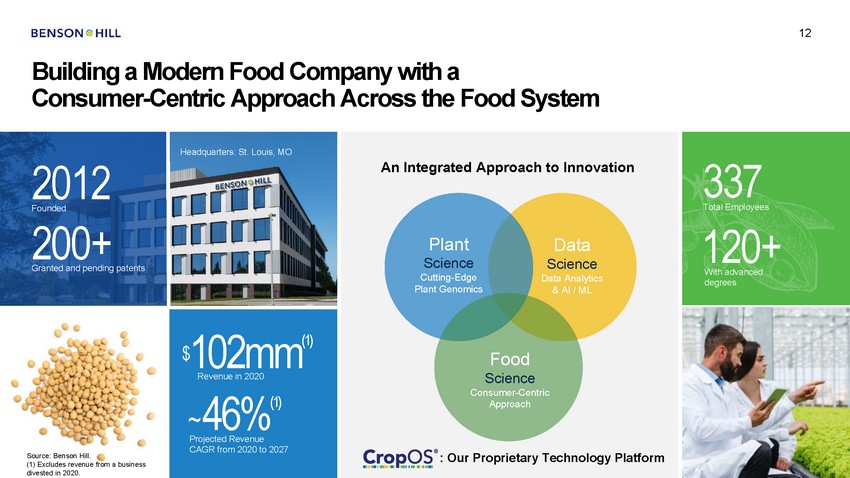 |
12 Building a Modern Food Company with a Consumer-Centric Approach Across the Food System Headquarters: St. Louis, MO 337 An Integrated Approach to Innovation 2012 Total Employees Founded 200+ 120+ Plant Science Cutting-Edge Plant Genomics Data Science Data Analytics & AI / ML Granted and pending patents With advanced degrees $102mm(1) Food Science Consumer-Centric Approach Revenue in 2020 ~46%(1) Projected Revenue CAGR from 2020 to 2027 : Our Proprietary Technology Platform Source: Benson Hill. (1) Excludes revenue from a business divested in 2020. |
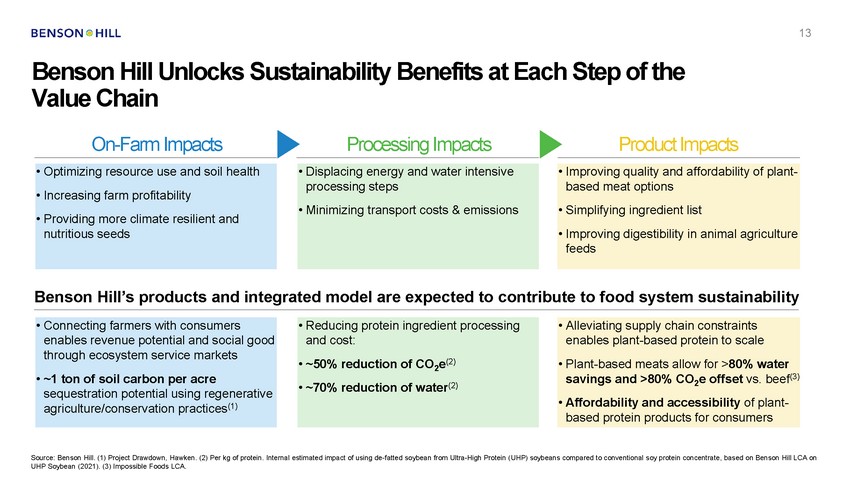 |
13 Benson Hill Unlocks Sustainability Benefits at Value Chain Each Step of the On-Farm Impacts Processing Impacts Product Impacts Benson Hill’s products and integrated model are expected to contribute to food system sustainability savings and >80% CO2e offset vs. beef(3) based protein products for consumers Source: Benson Hill. (1) Project Drawdown, Hawken. (2) Per kg of protein. Internal estimated impact of using de-fatted soybean from Ultra-High Protein (UHP) soybeans compared to conventional soy protein concentrate, based on Benson Hill LCA on UHP Soybean (2021). (3) Impossible Foods LCA. • Alleviating supply chain constraints enables plant-based protein to scale • Plant-based meats allow for >80% water • Affordability and accessibility of plant-• Reducing protein ingredient processing and cost: • ~50% reduction of CO2e(2) • ~70% reduction of water(2) • Connecting farmers with consumers enables revenue potential and social good through ecosystem service markets • ~1 ton of soil carbon per acre sequestration potential using regenerative agriculture/conservation practices(1) • Improving quality and affordability of plant-based meat options • Simplifying ingredient list • Improving digestibility in animal agriculture feeds • Displacing energy and water intensive processing steps • Minimizing transport costs & emissions • Optimizing resource use and soil health • Increasing farm profitability • Providing more climate resilient and nutritious seeds |
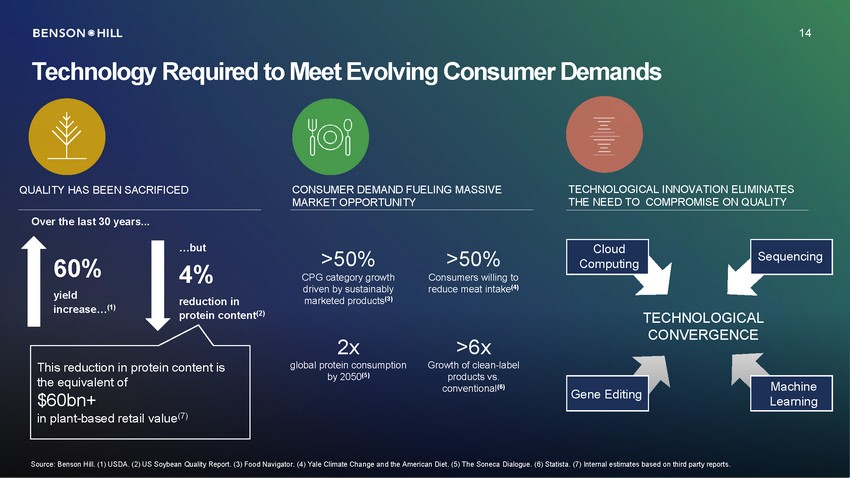 |
14 Technology Required to Meet Evolving Consumer Demands TECHNOLOGICAL INNOVATION ELIMINATES THE NEED TO COMPROMISE ON QUALITY QUALITY HAS BEEN SACRIFICED CONSUMER DEMAND FUELING MASSIVE MARKET OPPORTUNITY Over the last 30 years... …but 4% reduction in protein content(2) >50% CPG category growth driven by sustainably marketed products(3) >50% Consumers willing to reduce meat intake(4) 60% yield increase…(1) TECHNOLOGICAL CONVERGENCE 2x global protein consumption by 2050(5) >6x Growth of clean-label products vs. conventional(6) This reduction in protein content is the equivalent of $60bn+ in plant-based retail value(7) Source: Benson Hill. (1) USDA. (2) US Soybean Quality Report. (3) Food Navigator. (4) Yale Climate Change and the American Diet. (5) The Soneca Dialogue. (6) Statista. (7) Internal estimates based on third party reports. 14 Machine Learning Gene Editing Cloud Computing Sequencing |
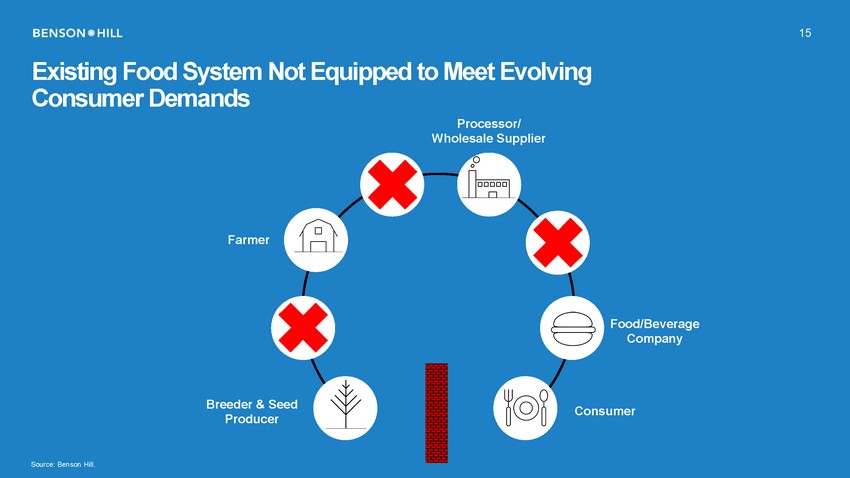 |
15 Existing Food System Not Equipped to Meet Evolving Consumer Demands Processor/ Wholesale Supplier Farmer Food/Beverage Company Breeder & Seed Producer Consumer Source: Benson Hill. |
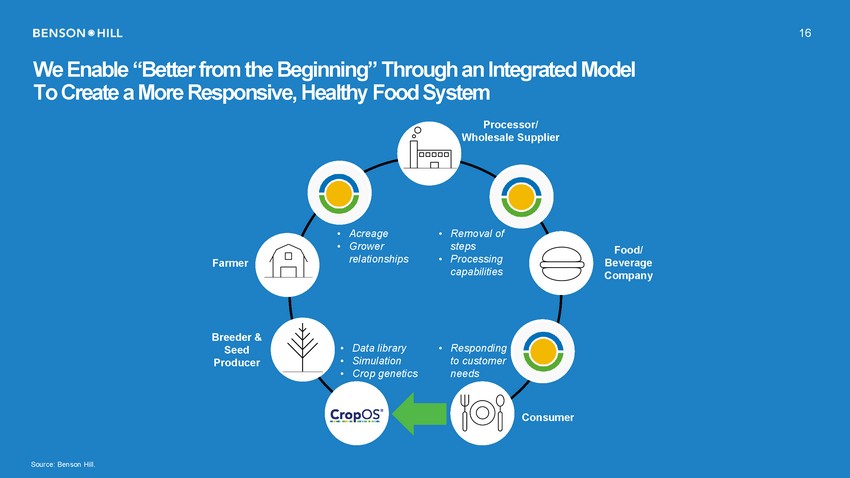 |
16 We Enable “Better from the Beginning” Through an Integrated Model To Create a More Responsive, Healthy Food System Processor/ Wholesale Supplier • • Acreage Grower relationships • Removal of steps Processing capabilities Food/ Beverage Company • Farmer Breeder & Seed Producer • • • Data library Simulation Crop genetics • Responding to customer needs Consumer Source: Benson Hill. |
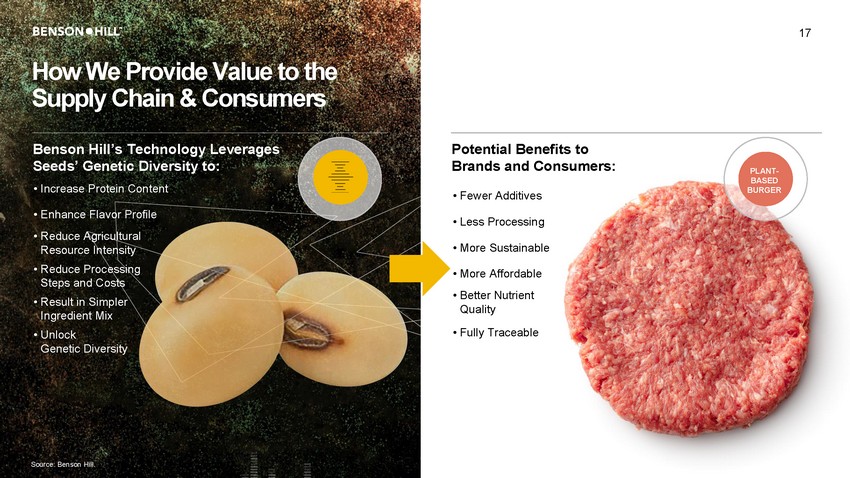 |
17 How We Provide Value to the Supply Chain & Consumers Benson Hill’s Technology Leverages Seeds’ Genetic Diversity to: • Increase Protein Content Potential Benefits to Brands and Consumers: PLANT-BASED BURGER • Fewer Additives • Enhance Flavor Profile • Reduce Agricultural Resource Intensity • Reduce Processing Steps and Costs • Result in Simpler Ingredient Mix • Unlock Genetic Diversity • Less Processing • More Sustainable • More Affordable • Better Nutrient Quality • Fully Traceable Source: Benson Hill. |
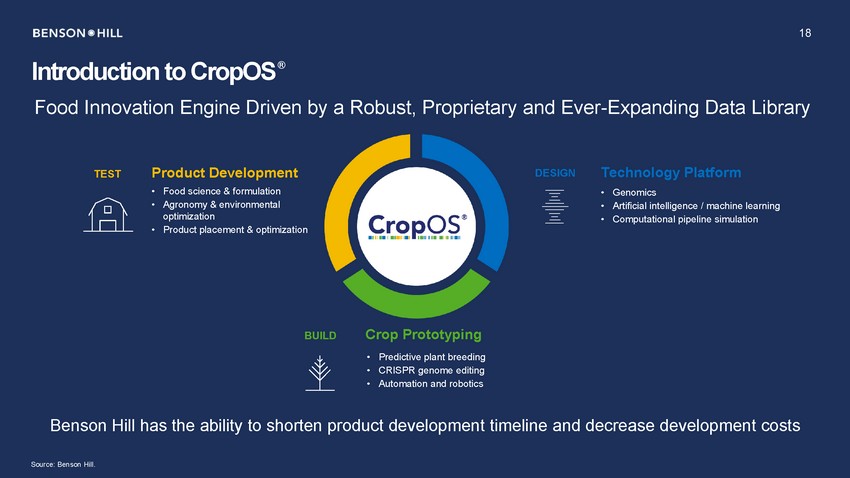 |
18 Introduction to CropOS® Food Innovation Engine Driven by a Robust, Proprietary and Ever-Expanding Data Library Technology Platform Product Development DESIGN TEST • • Food science & formulation Agronomy & environmental optimization Product placement & optimization • • • Genomics Artificial intelligence / machine learning Computational pipeline simulation • Crop Prototyping BUILD • • • Predictive plant breeding CRISPR genome editing Automation and robotics Benson Hill has the ability to shorten product development timeline and decrease development costs Source: Benson Hill. |
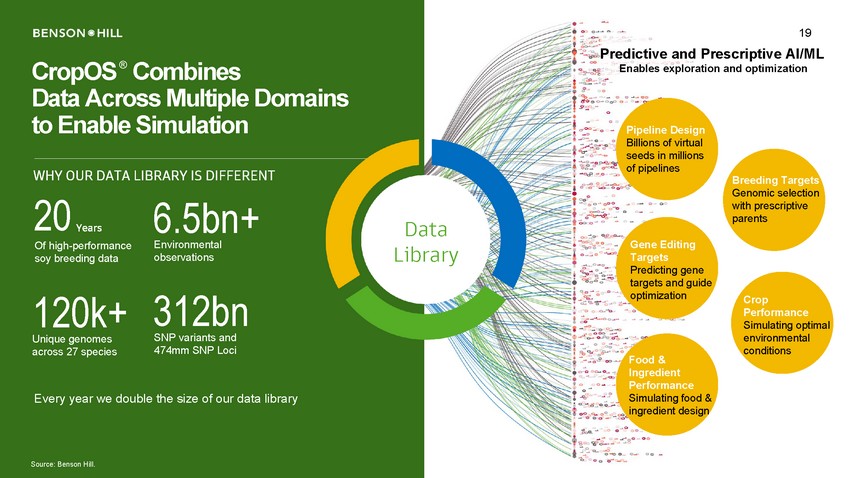 |
19 Predictive and Prescriptive AI/ML CropOS® Combines Data Across Multiple Domains to Enable Simulation Enables exploration and optimization Pipeline Design Billions of virtual seeds in millions of pipelines WHY OUR DATA LIBRARY IS DIFFERENT Breeding Targets Genomic selection with prescriptive parents 20 Years Of high-performance soy breeding data 6.5bn+ Environmental observations Data Library Gene Editing Targets Predicting gene targets and guide optimization 312bn SNP variants and 474mm SNP Loci 120k+ Unique genomes across 27 species Crop Performance Simulating optimal environmental conditions Food & Ingredient Performance Simulating food & ingredient design Every year we double the size of our data library Source: Benson Hill. |
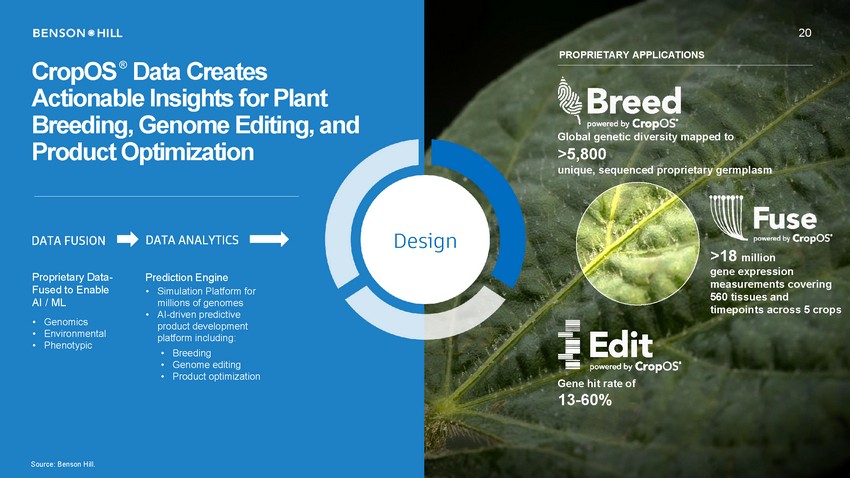 |
20 PROPRIETARY APPLICATIONS CropOS® Data Creates Actionable Insights for Plant Breeding, Genome Editing, and Product Optimization Global genetic diversity mapped to >5,800 unique, sequenced proprietary germplasm Design DATA ANALYTICS DATA FUSION >18 million gene expression measurements covering 560 tissues and timepoints across 5 crops Proprietary Data-Fused to Enable AI / ML Prediction Engine • Simulation Platform for millions of genomes AI-driven predictive product development platform including: • • • • Genomics Environmental Phenotypic • • • Breeding Genome editing Product optimization Gene hit rate of 13-60% Source: Benson Hill. |
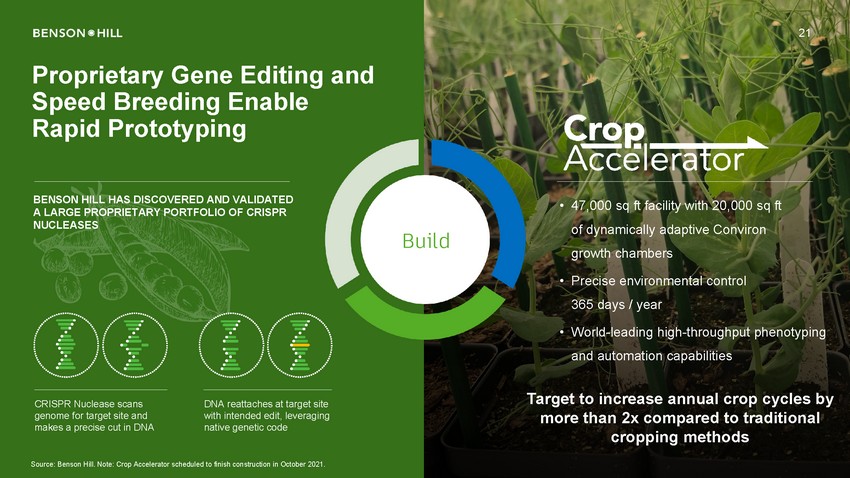 |
21 Proprietary Gene Editing Speed Breeding Enable Rapid Prototyping and BENSON HILL HAS DISCOVERED AND VALIDATED A LARGE PROPRIETARY PORTFOLIO OF CRISPR NUCLEASES • 47,000 sq ft facility with 20,000 sq ft of dynamically adaptive Conviron growth chambers Build • Precise environmental control 365 days / year • World-leading high-throughput phenotyping and automation capabilities Target to increase annual crop cycles by more than 2x compared to traditional cropping methods CRISPR Nuclease scans genome for target site and makes a precise cut in DNA DNA reattaches at target site with intended edit, leveraging native genetic code Source: Benson Hill. Note: Crop Accelerator scheduled to finish construction in October 2021. |
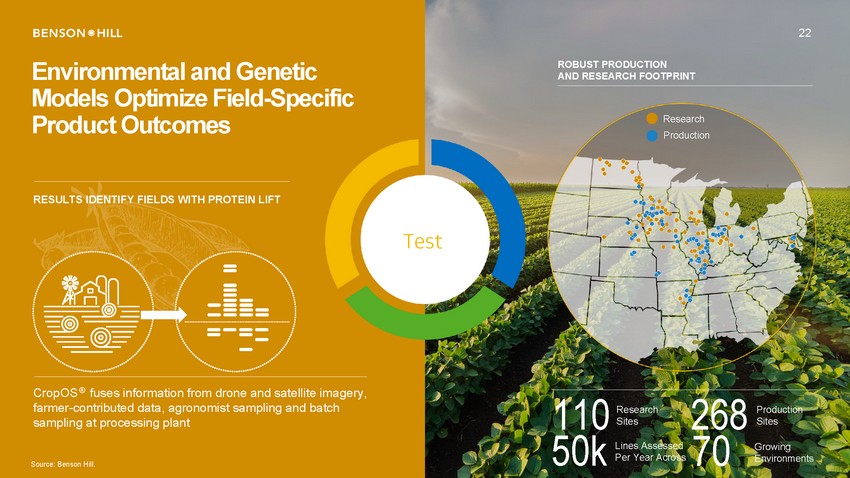 |
22 Environmental and Genetic Models Optimize Field-Specific Product Outcomes ROBUST PRODUCTION AND RESEARCH FOOTPRINT Research Production RESULTS IDENTIFY FIELDS WITH PROTEIN LIFT Test CropOS ® fuses information from drone and satellite imagery, farmer-contributed data, agronomist sampling and batch sampling at processing plant 110 50k 268 70 Research Sites Production Sites Lines Assessed Per Year Across Growing Environments Source: Benson Hill. |
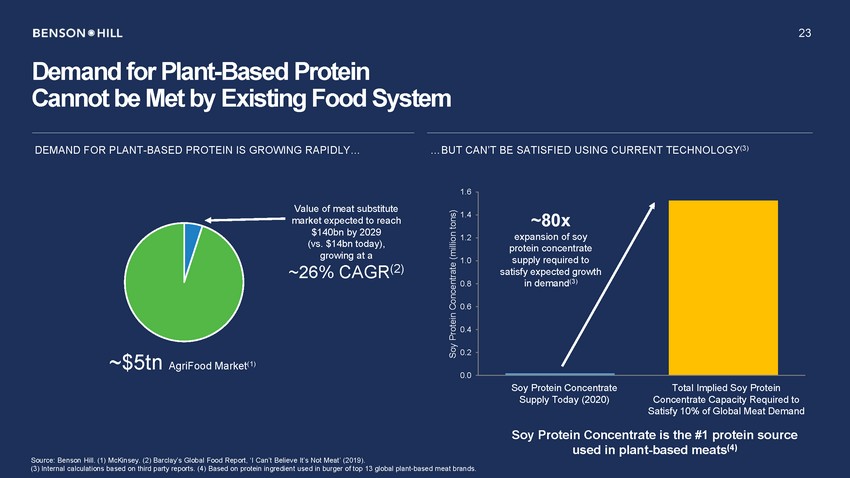 |
23 Demand for Plant-Based Protein Cannot be Met by Existing Food System DEMAND FOR PLANT-BASED PROTEIN IS GROWING RAPIDLY… …BUT CAN’T BE SATISFIED USING CURRENT TECHNOLOGY(3) 1.6 Value of meat substitute market expected to reach $140bn by 2029 (vs. $14bn today), growing at a 1.4 1.2 1.0 ~26% CAGR(2) 0.8 0.6 0.4 0.2 ~$5tn AgriFood Market(1) 0.0 Soy Protein Concentrate Supply Today (2020) Total Implied Soy Protein Concentrate Capacity Required to Satisfy 10% of Global Meat Demand Soy Protein Concentrate is the #1 protein source used in plant-based meats(4) Source: Benson Hill. (1) McKinsey. (2) Barclay’s Global Food Report, ‘I Can’t Believe It’s Not Meat’ (2019). (3) Internal calculations based on third party reports. (4) Based on protein ingredient used in burger of top 13 global plant-based meat brands. Soy Protein Concentrate (million tons) ~80x expansion of soy protein concentrate supply required to satisfy expected growth in demand(3) |
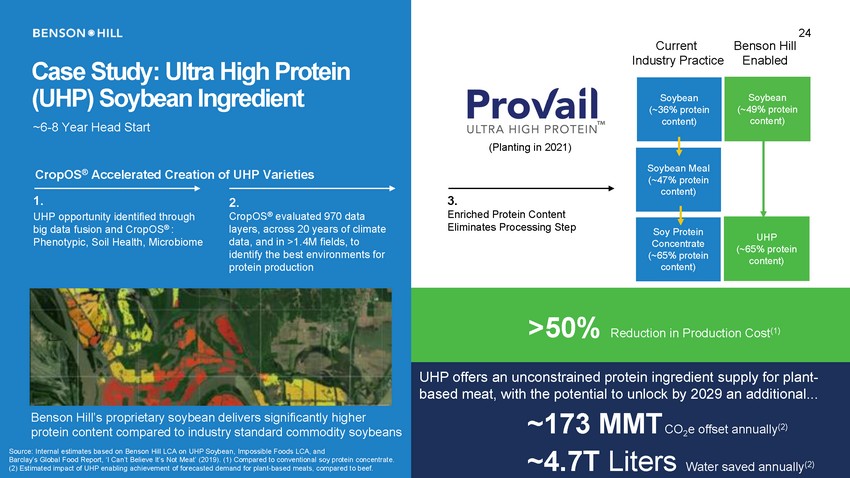 |
24 Current Industry Practice Benson Hill Enabled Case Study: Ultra High Protein (UHP) Soybean Ingredient ~6-8 Year Head Start (Planting in 2021) CropOS® Accelerated Creation of UHP Varieties 1. UHP opportunity identified through big data fusion and CropOS® : Phenotypic, Soil Health, Microbiome 3. Enriched Protein Content Eliminates Processing Step 2. CropOS® evaluated 970 data layers, across 20 years of climate data, and in >1.4M fields, to identify the best environments for protein production >50% Reduction in Production Cost(1) UHP offers an unconstrained protein ingredient supply for plant-based meat, with the potential to unlock by 2029 an additional... ~173 MMTCO2e offset annually(2) ~4.7T Liters Water saved annually(2) Benson Hill’s proprietary soybean delivers significantly higher protein content compared to industry standard commodity soybeans Source: Internal estimates based on Benson Hill LCA on UHP Soybean, Impossible Foods LCA, and Barclay’s Global Food Report, ‘I Can’t Believe It’s Not Meat’ (2019). (1) Compared to conventional soy protein concentrate. (2) Estimated impact of UHP enabling achievement of forecasted demand for plant-based meats, compared to beef. Soy Protein Concentrate (~65% protein content) UHP (~65% protein content) Soybean Meal (~47% protein content) Soybean (~49% protein content) Soybean (~36% protein content) |
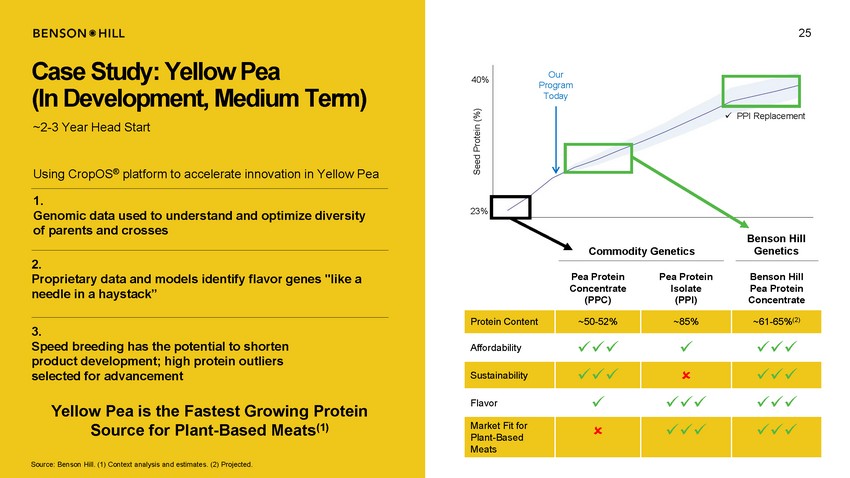 |
25 Case Study: Yellow Pea (In Development, Medium Term) ~2-3 Year Head Start Our Program Today 40% x PPI Replacement Using CropOS® platform to accelerate innovation in Yellow Pea 1. Genomic data used to understand and optimize diversity of parents and crosses 23% Benson Hill Genetics Commodity Genetics 2. Proprietary data and models identify flavor genes "like a needle in a haystack” 3. Speed breeding has the potential to shorten product development; high protein outliers selected for advancement Yellow Pea is the Fastest Growing Protein Source for Plant-Based Meats(1) Source: Benson Hill. (1) Context analysis and estimates. (2) Projected. Seed Protein (%) Pea Protein Concentrate (PPC) Pea Protein Isolate (PPI) Benson Hill Pea Protein Concentrate Protein Content ~50-52% ~85% ~61-65%(2) Affordability xxx x xxx Sustainability xxx xxx Flavor x xxx xxx Market Fit for Plant-Based Meats xxx xxx |
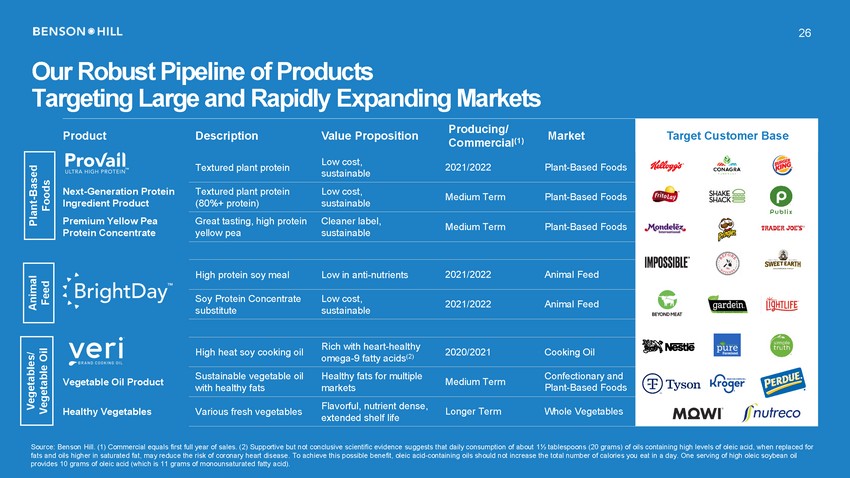 |
26 Our Robust Pipeline of Products Targeting Large and Rapidly Expanding Markets Commercial(1) sustainable Medium Term Plant-Based Foods (80%+ protein) sustainable Medium Term Plant-Based Foods yellow pea sustainable 2021/2022 Animal Feed substitute sustainable 2020/2021 Cooking Oil omega-9 fatty acids(2) Medium Term with healthy fats markets Plant-Based Foods extended shelf life Source: Benson Hill. (1) Commercial equals first full year of sales. (2) Supportive but not conclusive scientific evidence suggests that daily consumption of about 1½ tablespoons (20 grams) of oils containing high levels of oleic acid, when replaced for fats and oils higher in saturated fat, may reduce the risk of coronary heart disease. To achieve this possible benefit, oleic acid-containing oils should not increase the total number of calories you eat in a day. One serving of high oleic soybean oil provides 10 grams of oleic acid (which is 11 grams of monounsaturated fatty acid). Vegetable Oil Vegetables/ Animal Feed Plant-Based Foods Product Next-Generation Protein Ingredient Product Premium Yellow Pea Protein Concentrate Vegetable Oil Product Healthy Vegetables DescriptionValue PropositionProducing/Market Textured plant proteinLow cost,2021/2022Plant-Based Foods Target Customer Base Textured plant proteinLow cost, Great tasting, high proteinCleaner label, High protein soy mealLow in anti-nutrients2021/2022Animal Feed Soy Protein ConcentrateLow cost, High heat soy cooking oilRich with heart-healthy Sustainable vegetable oilHealthy fats for multipleConfectionary and Various fresh vegetablesFlavorful, nutrient dense,Longer TermWhole Vegetables |
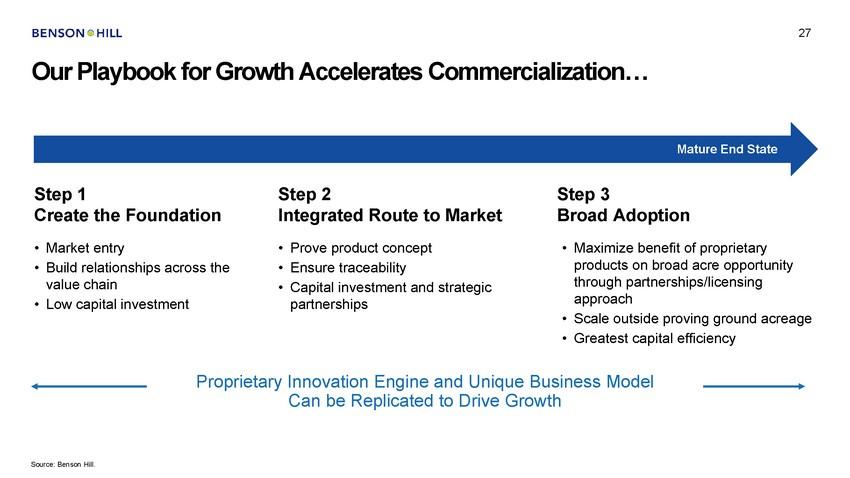 |
27 Our Playbook for Growth Accelerates Commercialization… Mature End State Step 1 Create the Foundation Step 2 Integrated Route to Step 3 Broad Adoption Market • • Market entry Build relationships across the value chain Low capital investment • • • Prove product concept Ensure traceability Capital investment and strategic partnerships • Maximize benefit of proprietary products on broad acre opportunity through partnerships/licensing approach Scale outside proving ground acreage Greatest capital efficiency • • • Proprietary Innovation Engine and Unique Business Model Can be Replicated to Drive Growth Source: Benson Hill. |
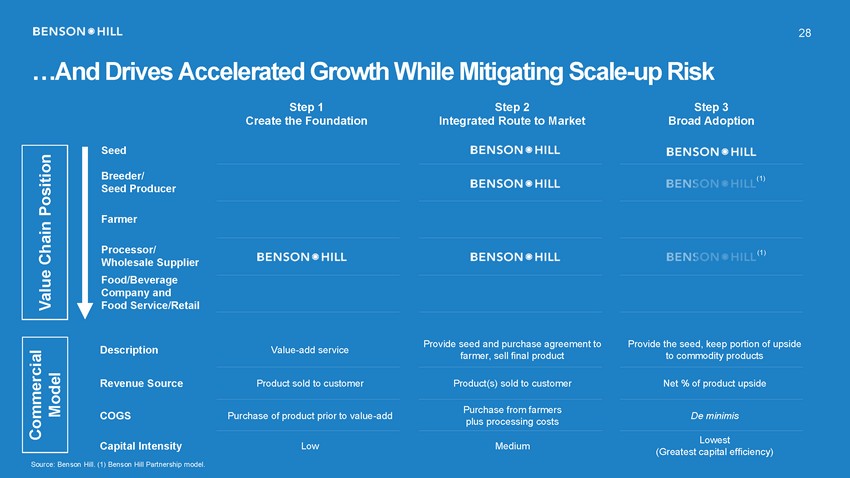 |
28 …And Drives Accelerated Growth While Mitigating Scale-up Risk Step 1 Create the Foundation Step 2 Integrated Route to Market Step 3 Broad Adoption Seed Breeder/ Seed Producer (1) Farmer Processor/ Wholesale Supplier Food/Beverage Company and Food Service/Retail (1) Provide seed and purchase agreement to farmer, sell final product Provide the seed, keep portion of upside to commodity products Description Value-add service Revenue Source Product sold to customer Product(s) sold to customer Net % of product upside Purchase from farmers plus processing costs COGS Purchase of product prior to value-add De minimis Lowest (Greatest capital efficiency) Capital Intensity Low Medium Source: Benson Hill. (1) Benson Hill Partnership model. Model Commercial Value Chain Position |
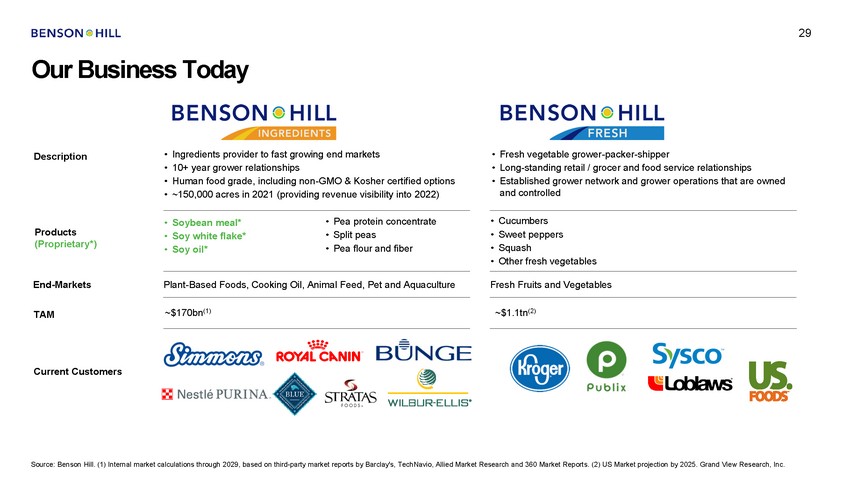 |
29 Our Business Today • • • • Ingredients provider to fast growing end markets 10+ year grower relationships Human food grade, including non-GMO & Kosher certified options ~150,000 acres in 2021 (providing revenue visibility into 2022) • • • Fresh vegetable grower-packer-shipper Long-standing retail / grocer and food service relationships Established grower network and grower operations that are owned and controlled Description • • • • Cucumbers Sweet peppers Squash Other fresh vegetables • • • Pea protein concentrate Split peas Pea flour and fiber • • • Soybean meal* Soy white flake* Soy oil* Products (Proprietary*) End-Markets Plant-Based Foods, Cooking Oil, Animal Feed, Pet and Aquaculture Fresh Fruits and Vegetables ~$170bn(1) ~$1.1tn(2) TAM Current Customers Source: Benson Hill. (1) Internal market calculations through 2029, based on third-party market reports by Barclay's, TechNavio, Allied Market Research and 360 Market Reports. (2) US Market projection by 2025. Grand View Research, Inc. |
 |
30 Executive Leadership Team with Diverse Business and Technical Backgrounds Across the Food System Matt Crisp President & CEO Serial AgriFood entrepreneur and former life sciences venture capital partner DeAnn Brunts Chief Financial Officer Experienced public company board member, CFO and corporate development leader Natalie DiNicola Chief of Staff 20+ years in the AgriFood industry with experience in business strategy, development and sustainability Chris Wilkins Chief Operating Officer 25+ years in the food industry as GM and in marketing and corporate development Jason Bull Chief Technology Officer 20+ years of experience unlocking synergies between genomics and data science Yevgeny Fundler Chief Legal Officer Adam Javan Chief Strategy Officer 25+ years of experience in business analytics and technology innovation Kelly Fischer Chief People Officer 14 years in HR with expertise in project leadership, talent strategy, and change management 25 years of experience as a strategic leader and legal counsel delivering business-focused solutions Source: Benson Hill. |
 |
31 Public-Market Ready Board of Directors Dan Jacobi Chairman Deanie Elsner Director David Lee Director Linda Whitley-Taylor Director Andy Wheeler Director Stephan Dolezalek Director Matt Crisp Director & CEO Craig Rohr Director DeAnn Brunts Director & CFO Source: Benson Hill. Note: Additional Star Peak nominee to be added in addition to Craig Rohr. Alphabet |
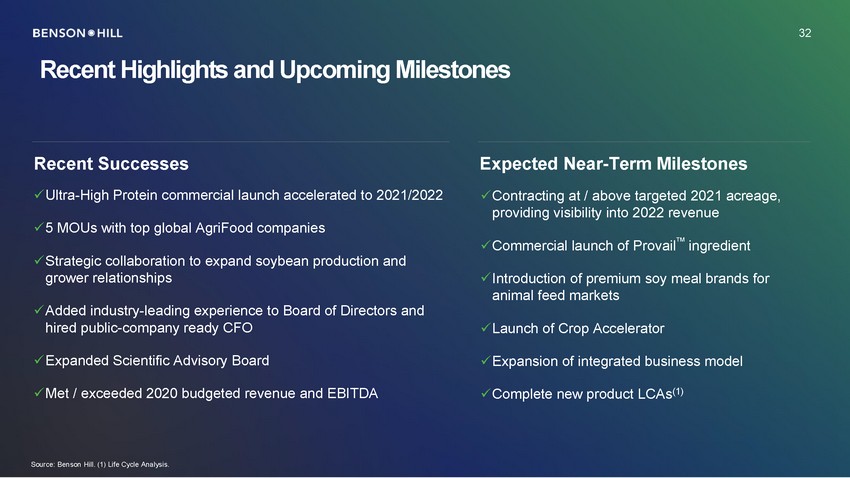 |
32 Recent Highlights and Upcoming Milestones Recent Successes xUltra-High Protein commercial launch accelerated to 2021/2022 Expected Near-Term Milestones xContracting at / above targeted 2021 acreage, providing visibility into 2022 revenue x5 MOUs with top global AgriFood companies TM xCommercial launch of Provailingredient xStrategic collaboration to expand soybean production and grower relationships xIntroduction of premium soy meal brands for animal feed markets xAdded industry-leading experience to Board of Directors and hired public-company ready CFO xLaunch of Crop Accelerator xExpanded Scientific Advisory Board xExpansion of integrated business model xMet / exceeded 2020 budgeted revenue and EBITDA xComplete new product LCAs(1) Source: Benson Hill. (1) Life Cycle Analysis. 32 |
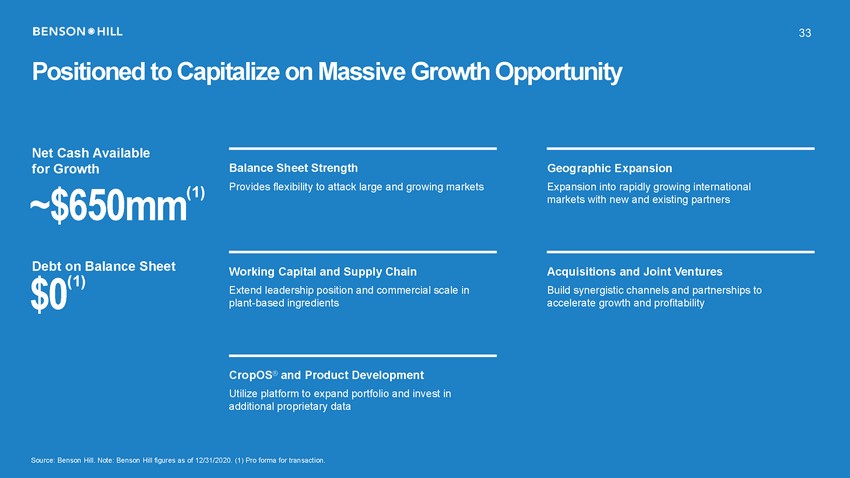 |
33 Positioned to Capitalize on Massive Growth Opportunity Net Cash Available for Growth ~$650mm(1) Debt on Balance Sheet Balance Sheet Strength Provides flexibility to attack large and growing markets Geographic Expansion Expansion into rapidly growing international markets with new and existing partners Working Capital and Supply Chain Extend leadership position and commercial scale in plant-based ingredients Acquisitions and Joint Ventures Build synergistic channels and partnerships to accelerate growth and profitability $0 (1) CropOS® and Product Development Utilize platform to expand portfolio and invest in additional proprietary data Source: Benson Hill. Note: Benson Hill figures as of 12/31/2020. (1) Pro forma for transaction. |
 |
34 Financial Forecast Section |
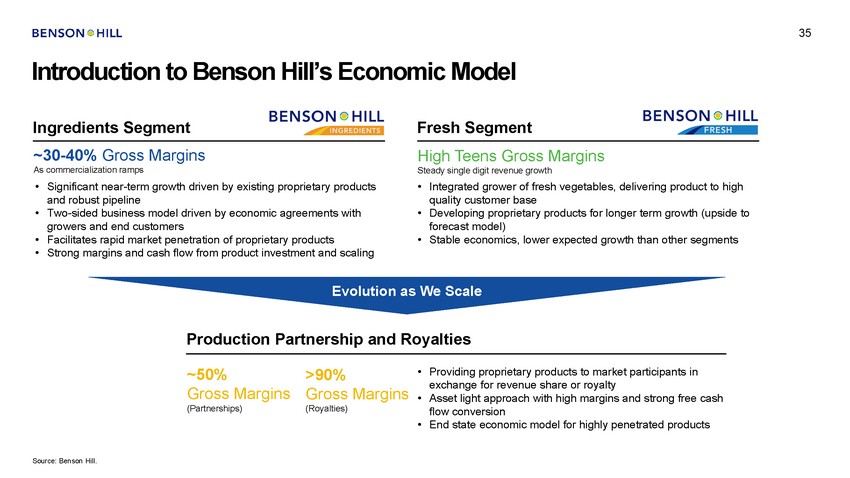 |
35 Introduction to Benson Hill’s Economic Model Ingredients Segment Fresh Segment ~30-40% Gross Margins As commercialization ramps High Teens Gross Margins Steady single digit revenue growth • Significant near-term growth driven by existing proprietary products and robust pipeline Two-sided business model driven by economic agreements with growers and end customers Facilitates rapid market penetration of proprietary products Strong margins and cash flow from product investment and scaling • Integrated grower of fresh vegetables, delivering product to high quality customer base Developing proprietary products for longer term growth (upside to forecast model) Stable economics, lower expected growth than other segments • • • • • Evolution as We Scale Production Partnership and Royalties • Providing proprietary products to market participants in exchange for revenue share or royalty Asset light approach with high margins and strong free cash flow conversion End state economic model for highly penetrated products ~50% Gross Margins (Partnerships) >90% Gross (Royalties) Margins • • Source: Benson Hill. |
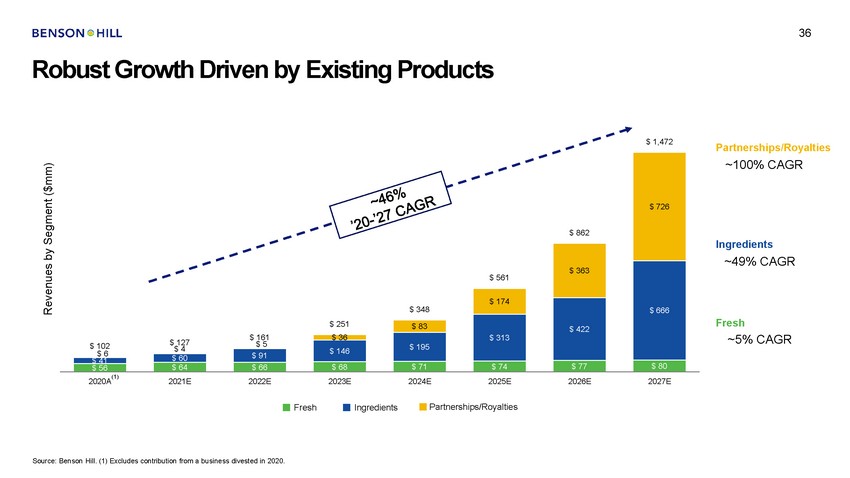 |
36 Robust Growth Driven by Existing Products $ 1,472 Partnerships/Royalties ~100% CAGR Ingredients ~49% CAGR Fresh ~5% CAGR $ 36 $ 127 $ 4 $ 5 $ $ 6 102 (1) 2020A 2021E 2022E 2023E 2024E 2025E 2026E 2027E FreshIngredientsPartnerships/Royalties Partnerships/Royalties Fresh Ingredients Source: Benson Hill. (1) Excludes contribution from a business divested in 2020. Revenues by Segment ($mm) $ 862 $ 726 $ 561 $ 363 $ 666 $ 348 $ 174 $ 422 $ 313 $ 251 $ 83 $ 161 $ 195 $ 146 $ 91 $ 60 $ 41 $ 71 $ 68 $ 66 $ 64 $ 74 $ 77 $ 80 $ 56 |
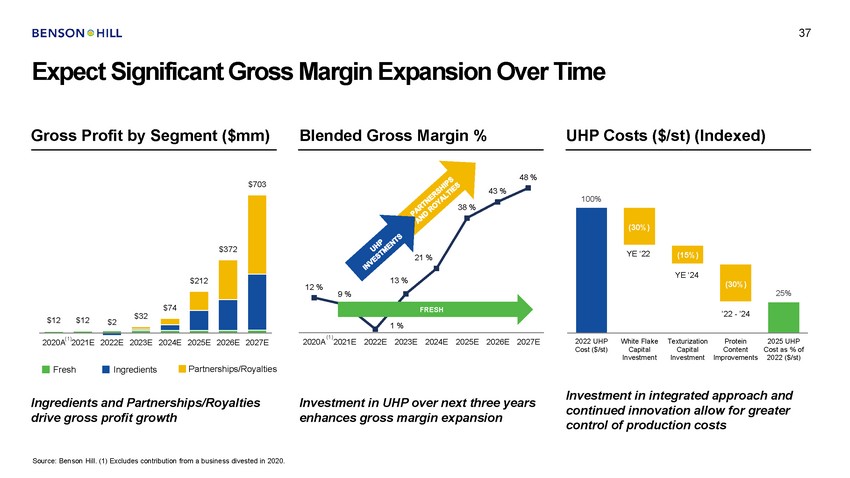 |
37 Expect Significant Gross Margin Expansion Over Time Gross Profit by Segment ($mm) Blended Gross Margin % UHP Costs ($/st) (Indexed) 48 % $703 43 % 100% 38 % 21 % 13 % 12 % 9 % FRESH $32 $12 $12 $2 1 % (1) 2020A 2021E 2022E 2023E 2024E 2025E 2020A(1)2021E 2026E 2027E 2022 UHP Cost ($/st) White Flake Capital Investment Texturization Capital Investment Protein Content Improvements 2025 UHP Cost as % of 2022 ($/st) 2022E 2023E 2024E 2025E 2026E 2027E FreshFresh InInggrereddieinetnstsPartnePrsahritpnse/Rrsohyiaplstie/Rs oyalties Investment in integrated approach and continued innovation allow for greater control of production costs Ingredients and Partnerships/Royalties drive gross profit growth Investment in UHP over next three years enhances gross margin expansion Source: Benson Hill. (1) Excludes contribution from a business divested in 2020. YE ‘22 YE ‘24 25% ’22 - ’24 (30%) (15%) (30%) $372 $212 $74 |
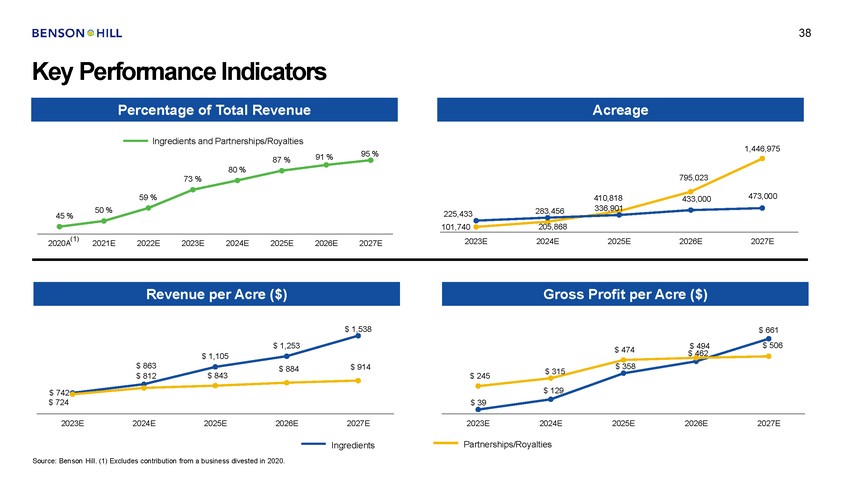 |
38 Key Performance Indicators Ingredients and Partnerships/Royalties 1,446,975 95 % 91 % 87 % 80 % 795,023 73 % 473,000 59 % 410,818 336,901 433,000 50 % 283,456 205,868 225,433 101,740 45 % (1) 2023E 2024E 2025E 2026E 2027E 2020A 2021E 2022E 2023E 2024E 2025E 2026E 2027E $ 1,538 $ 661 $ 506 $ 1,253 $ 494 $ 462 $ 474 $ 1,105 $ 863 $ 812 $ 358 $ 914 $ 884 $ 315 $ 843 $ 245 $ 129 $ 742 $ 724 $ 39 2023E 2024E 2025E 2026E 2027E 2023E 2024E 2025E 2026E 2027E Partnerships/Royalties Ingredients Source: Benson Hill. (1) Excludes contribution from a business divested in 2020. Gross Profit per Acre ($) Revenue per Acre ($) Acreage Percentage of Total Revenue |
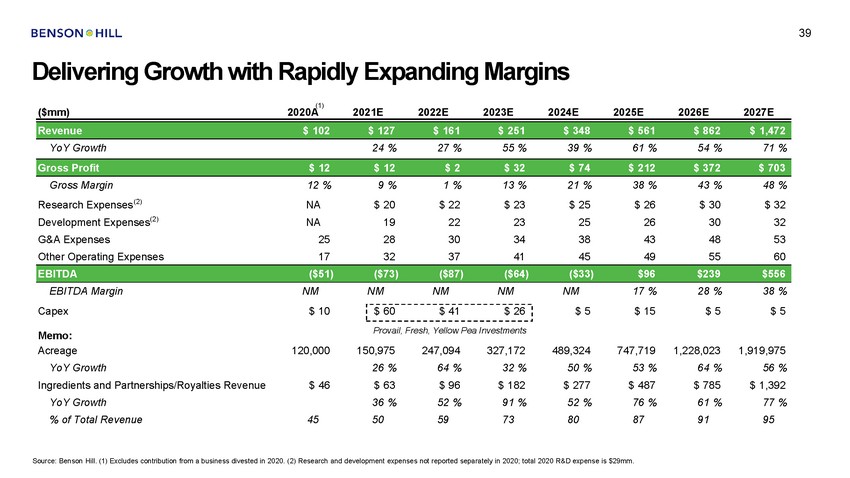 |
39 Delivering Growth with Rapidly Expanding Margins (1) ($mm) 2020A 2021E 2022E 2023E 2024E 2025E 2026E 2027E YoY Growth 24 % 27 % 55 % 39 % 61 % 54 % 71 % Gross Margin Research Expenses(2) Development Expenses(2) G&A Expenses Other Operating Expenses 12 % NA NA 25 17 9 % $ 20 19 28 32 1 % $ 22 22 30 37 13 % $ 23 23 34 41 21 % $ 25 25 38 45 38 % $ 26 26 43 49 43 % $ 30 30 48 55 48 % $ 32 32 53 60 EBITDA Margin Capex NM $ 10 NM NM NM NM $ 5 17 % $ 15 28 % $ 5 38 % $ 5 Provail, Fresh, Yellow Pea Investments Memo: Acreage YoY Growth Ingredients and Partnerships/Royalties Revenue YoY Growth % of Total Revenue 120,000 150,975 26 % $ 63 36 % 50 247,094 64 % $ 96 52 % 59 327,172 32 % $ 182 91 % 73 489,324 50 % $ 277 52 % 80 747,719 53 % $ 487 76 % 87 1,228,023 64 % $ 785 61 % 91 1,919,975 56 % $ 1,392 77 % 95 $ 46 45 Source: Benson Hill. (1) Excludes contribution from a business divested in 2020. (2) Research and development expenses not reported separately in 2020; total 2020 R&D expense is $29mm. $ 60$ 41$ 26 EBITDA($51)($73)($87)($64)($33)$96$239$556 Gross Profit$ 12$ 12$ 2$ 32$ 74$ 212$ 372$ 703 Revenue$ 102$ 127$ 161$ 251$ 348$ 561$ 862$ 1,472 |
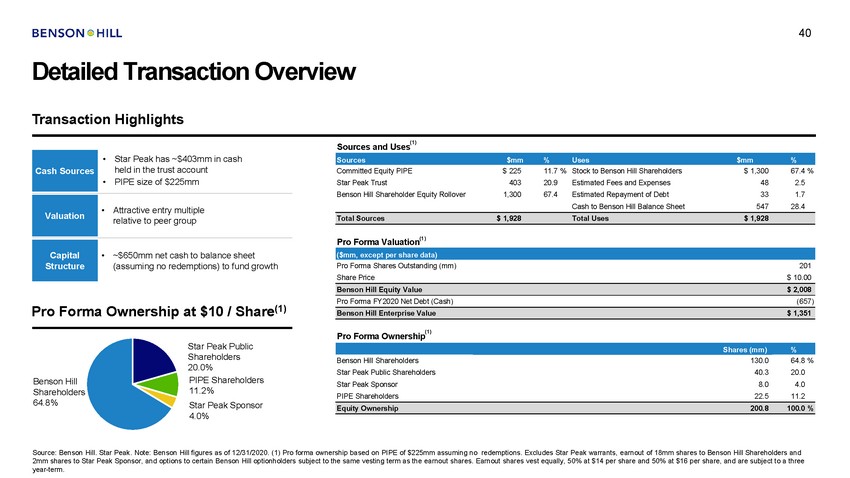 |
40 Detailed Transaction Overview Transaction Highlights (1) Sources and Uses • Star Peak has ~$403mm in cash held in the trust account PIPE size of $225mm Committed Equity PIPE Star Peak Trust Benson Hill Shareholder Equity Rollover $ 225 403 1,300 11.7 % 20.9 67.4 Stock to Benson Hill Shareholders Estimated Fees and Expenses Estimated Repayment of Debt Cash to Benson Hill Balance Sheet $ 1,300 48 33 547 67.4 % 2.5 1.7 28.4 • • Attractive entry multiple relative to peer group Pro Forma Valuation(1) • ~$650mm net cash to balance sheet (assuming no redemptions) to fund growth Pro Forma Shares Outstanding (mm) Share Price 201 $ 10.00 Pro Forma FY2020 Net Debt (Cash) (657) Pro Forma Ownership at $10 / Share(1) (1) Pro Forma Ownership Star Peak Public Shareholders 20.0% PIPE Shareholders 11.2% Star Peak Sponsor 4.0% Benson Hill Shareholders Star Peak Public Shareholders Star Peak Sponsor PIPE Shareholders 130.0 40.3 8.0 22.5 64.8 % 20.0 4.0 11.2 Benson Hill Shareholders 64.8% Source: Benson Hill. Star Peak. Note: Benson Hill figures as of 12/31/2020. (1) Pro forma ownership based on PIPE of $225mm assuming no redemptions. Excludes Star Peak warrants, earnout of 18mm shares to Benson Hill Shareholders and 2mm shares to Star Peak Sponsor, and options to certain Benson Hill optionholders subject to the same vesting term as the earnout shares. Earnout shares vest equally, 50% at $14 per share and 50% at $16 per share, and are subject to a three year-term. Equity Ownership 200.8 100.0 % Shares (mm)% Benson Hill Enterprise Value $ 1,351 Benson Hill Equity Value $ 2,008 ($mm, except per share data) Capital Structure Total Sources $ 1,928 Total Uses $ 1,928 Valuation Sources $mm % Uses $mm % Cash Sources |
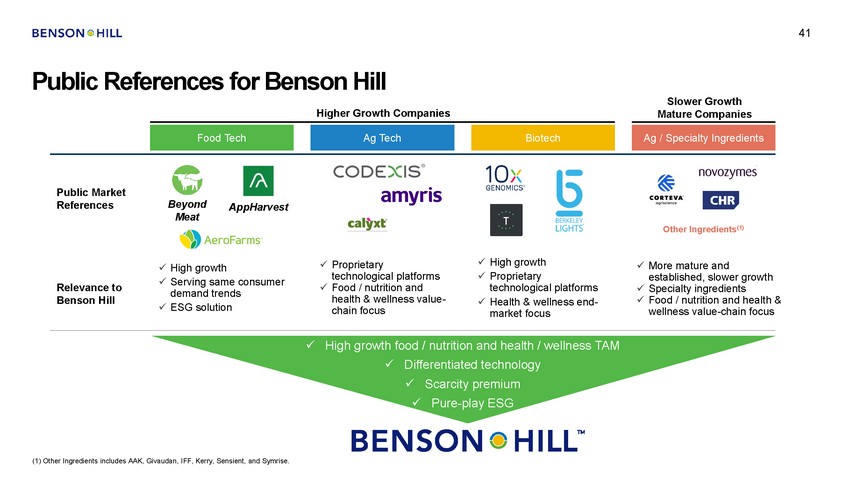 |
41 Public References for Benson Hill Higher Growth Companies Slower Growth Mature Companies Public Market References Beyond Meat AppHarvest Other Ingredients(1) x High growth x Proprietary technological platforms x Health & wellness end-market focus x Proprietary technological platforms x Food / nutrition and health & wellness value-chain focus x More mature and established, slower growth x Specialty ingredients x Food / nutrition and health & wellness value-chain focus x High growth x Serving same consumer demand trends x ESG solution Relevance to Benson Hill xHigh growth food / nutrition and health / wellness TAM xDifferentiated technology xScarcity premium xPure-play ESG (1) Other Ingredients includes AAK, Givaudan, IFF, Kerry, Sensient, and Symrise. Ag Tech Food Tech Biotech Ag / Specialty Ingredients |
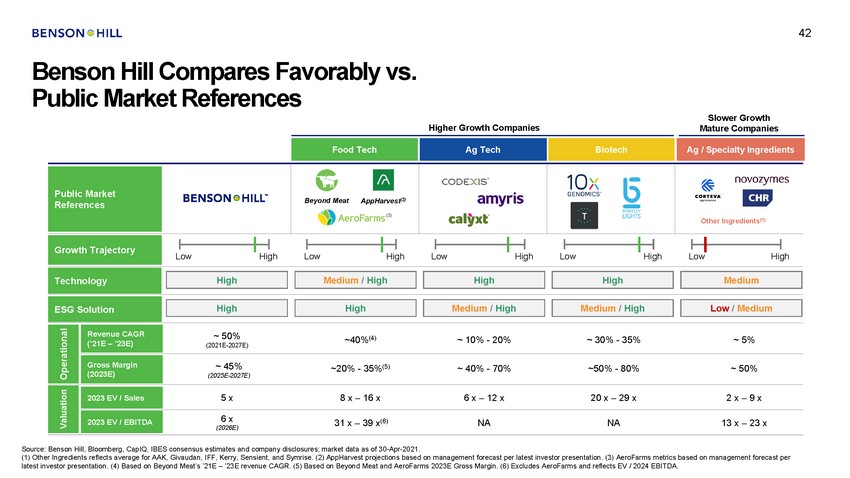 |
42 Benson Hill Compares Favorably vs. Public Market References Slower Growth Mature Companies Higher Growth Companies References (2021E-2027E) (2025E-2027E) (2026E) Source: Benson Hill, Bloomberg, CapIQ, IBES consensus estimates and company disclosures; market data as of 30-Apr-2021. (1) Other Ingredients reflects average for AAK, Givaudan, IFF, Kerry, Sensient, and Symrise. (2) AppHarvest projections based on management forecast per latest investor presentation. (3) AeroFarms metrics based on management forecast per latest investor presentation. (4) Based on Beyond Meat’s ’21E – ’23E revenue CAGR. (5) Based on Beyond Meat and AeroFarms 2023E Gross Margin. (6) Excludes AeroFarms and reflects EV / 2024 EBITDA. ValuationOperational Food Tech Ag Tech Biotech Ag / Specialty Ingredients Beyond MeatAppHarvest(2) (3) Other Ingredients(1) Public Market GrroowwthtThraTjercatojeryctory LowHighLowHighLowHighLowHighLowHigh Tecchnhonlooglyogy ESGGFoSootplruinttion Revenue CAGR (’21E – ’23E) ~ 50%~40%(4) ~ 10% - 20%~ 30% - 35%~ 5% Gross Margin (2023E) ~ 45%~20% - 35%(5) ~ 40% - 70%~50% - 80%~ 50% 2022022E3VE/VSa/ lSesales 5 x8 x – 16 x6 x – 12 x20 x – 29 x2 x – 9 x 2022022E3VE/VEB/ EITBDIATDA 6 x31 x – 39 x(6) NANA13 x – 23 x Medium / High High Medium / High Low / Medium High High Medium / High High Medium High |
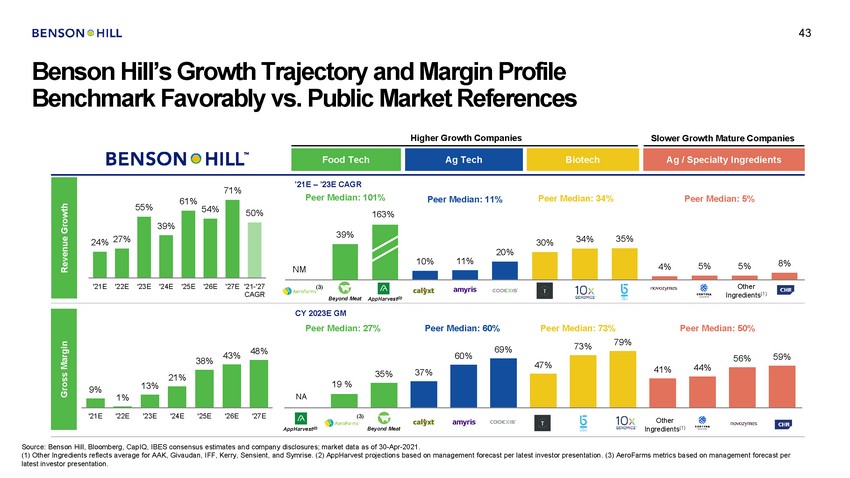 |
43 Benson Hill’s Growth Trajectory and Margin Profile Benchmark Favorably vs. Public Market References Higher Growth Companies Slower Growth Mature Companies ’21E – ’23E CAGR Peer Median: 101% 163% 71% Peer Median: 34% Peer Median: 11% Peer Median: 5% 55% 54% 20% 11% 10% '21E '22E '23E '24E '25E '26E '27E '21-'27 CAGR Other Ingredients(1) (3) Beyond Meat AppHarvest(2) CY 2023E GM Peer Median: 27% Peer Median: 60% Peer Median: 73% Peer Median: 50% 79% 73% 69% 48% 43% 59% 56% 38% 13% 9% 1% '21E '22E '23E '24E '25E '26E '27E (3) Other Ingredients(1) AppHarvest(2) Beyond Meat Source: Benson Hill, Bloomberg, CapIQ, IBES consensus estimates and company disclosures; market data as of 30-Apr-2021. (1) Other Ingredients reflects average for AAK, Givaudan, IFF, Kerry, Sensient, and Symrise. (2) AppHarvest projections based on management forecast per latest investor presentation. (3) AeroFarms metrics based on management forecast per latest investor presentation. Gross Margin Revenue Growth 21% 60% 47% 35%37% 19 % N0A% 41%44% 39% 30%34%35% N0M% 4%5%5%8% 61% 50% 24% 27% 39% Ag Tech Food Tech Biotech Ag / Specialty Ingredients |
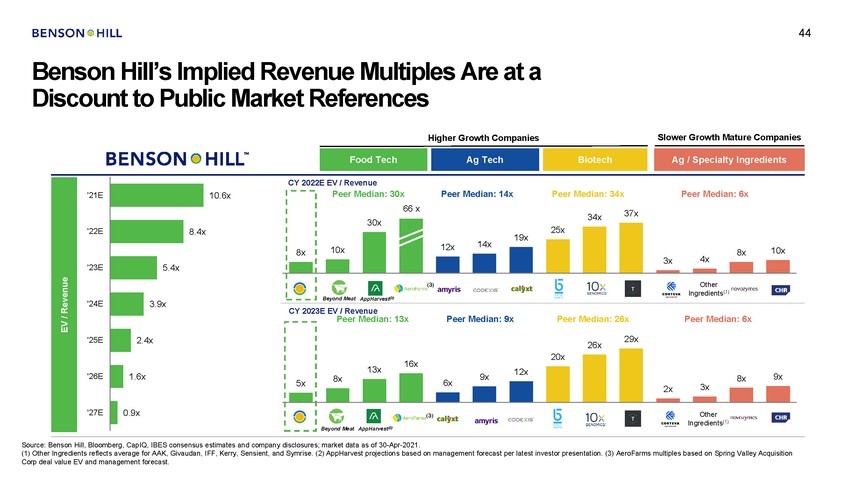 |
44 Benson Hill’s Implied Revenue Multiples Are at a Discount to Public Market References Higher Growth Companies Slower Growth Mature Companies CY 2022E EV / Revenue '21E 10.6x 34x '22E 8.4x 19x 14x 12x 4x 3x '23E Other Ingredients(1) Beyond Meat AppHarvest(2) '24E CY 2023E EV / Revenue Peer Median: 13x Peer Median: 9x Peer Median: 26x Peer Median: 6x '25E 16x 13x 12x '26E 9x 8x 6x 3x 2x '27E Beyond Meat AppHarvest(2) Source: Benson Hill, Bloomberg, CapIQ, IBES consensus estimates and company disclosures; market data as of 30-Apr-2021. (1) Other Ingredients reflects average for AAK, Givaudan, IFF, Kerry, Sensient, and Symrise. (2) AppHarvest projections based on management forecast per latest investor presentation. (3) AeroFarms multiples based on Spring Valley Acquisition Corp deal value EV and management forecast. EV / Revenue 5x 26x29x 9x 20x 8x (3) Other Ingredients(1) 8x Peer Median: 30xPeer Median: 14xPeer Median: 34xPeer Median: 6x 6460xx37x 30x 8x10x 25x 10x (3) 5.4x 3.9x 2.4x 1.6x 0.9x Ag Tech Food Tech Biotech Ag / Specialty Ingredients |
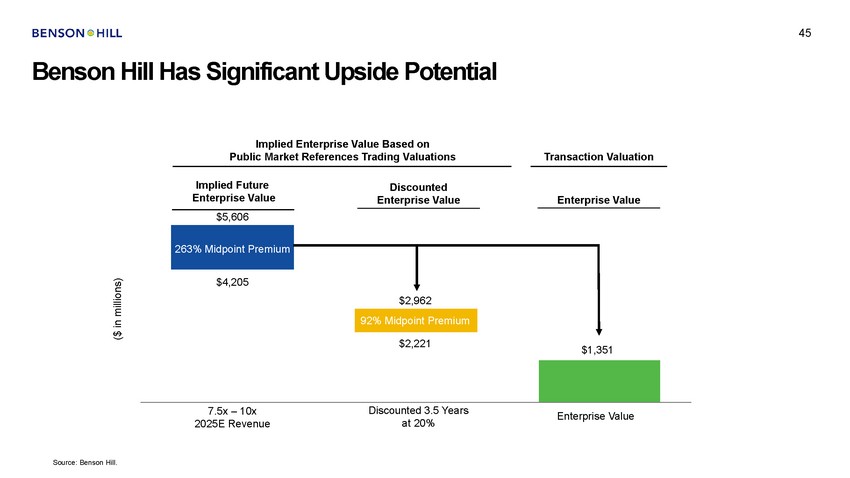 |
45 Benson Hill Has Significant Upside Potential Implied Enterprise Value Based on Public Market References Trading Valuations Transaction Valuation Implied Future Enterprise Value Discounted Enterprise Value Enterprise Value $$55,,66066 $4,,220055 $$22,,9962 $$22,,2221 $$1,13,35511 DiDsciosucnoteudn3t.e5 dPe3ri.o5dsYaet a20rs% at 20% 7.5x - 170.x52x0–251E0Rxevenue 2025E Revenue EntEenrteprrpirsisee Valuluee Source: Benson Hill. ($ in millions) 92% Midpoint Premium 263% Midpoint Premium |
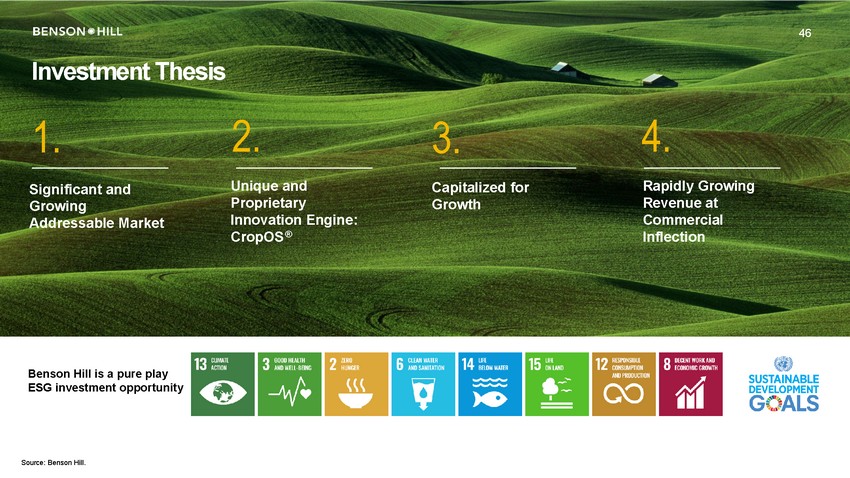 |
46 Investment Thesis 2. Unique and Proprietary Innovation Engine: CropOS ® 4. Rapidly Growing Revenue at Commercial Inflection 1. Significant and Growing Addressable Market 3. Capitalized for Growth Benson Hill is a pure play ESG investment opportunity Source: Benson Hill. |
 |
47 Appendix |
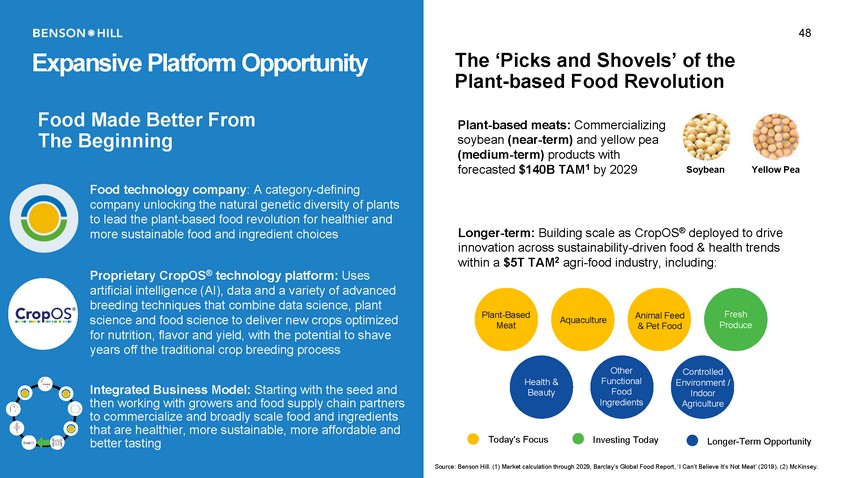 |
Expansive Platform Opportunity Food Made Better From The Beginning Food technology company: A category-defining company unlocking the natural genetic diversity of plants to lead the plant-based food revolution for healthier and more sustainable food and ingredient choices Proprietary CropOS® technology platform: Uses artificial intelligence (AI), data and a variety of advanced breeding techniques that combine data science, plant science and food science to deliver new crops optimized for nutrition, flavor and yield, with the potential to shave years off the traditional crop breeding process Meat Produce & Pet Food Integrated Business Model: Starting with the seed and then working with growers and food supply chain partners to commercialize and broadly scale food and ingredients that are healthier, more sustainable, more affordable and better tasting 48 The ‘Picks and Shovels’ of the Plant-based Food Revolution Plant-based meats: Commercializing soybean (near-term) and yellow pea (medium-term) products with forecasted $140B TAM1 by 2029SoybeanYellow Pea Longer-term: Building scale as CropOS® deployed to drive innovation across sustainability-driven food & health trends within a $5T TAM2 agri-food industry, including: Plant-BasedAquacultureAnimal FeedFresh OtherControlled Health &FunctionalEnvironment / Beauty Food Indoor IngredientsAgriculture Today's FocusInvesting TodayLonger-Term Opportunity Source: Benson Hill. (1) Market calculation through 2029, Barclay’s Global Food Report, ‘I Can’t Believe It’s Not Meat’ (2019). (2) McKinsey. |
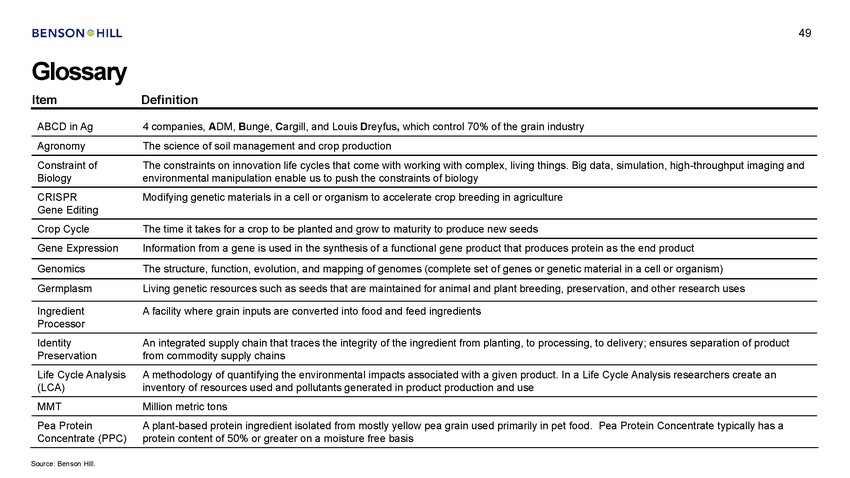 |
49 Glossary Item Definition Source: Benson Hill. ABCD in Ag4 companies, ADM, Bunge, Cargill, and Louis Dreyfus, which control 70% of the grain industry AgronomyThe science of soil management and crop production Constraint ofThe constraints on innovation life cycles that come with working with complex, living things. Big data, simulation, high-throughput imaging and Biologyenvironmental manipulation enable us to push the constraints of biology CRISPRModifying genetic materials in a cell or organism to accelerate crop breeding in agriculture Gene Editing Crop CycleThe time it takes for a crop to be planted and grow to maturity to produce new seeds Gene ExpressionInformation from a gene is used in the synthesis of a functional gene product that produces protein as the end product GenomicsThe structure, function, evolution, and mapping of genomes (complete set of genes or genetic material in a cell or organism) GermplasmLiving genetic resources such as seeds that are maintained for animal and plant breeding, preservation, and other research uses IngredientA facility where grain inputs are converted into food and feed ingredients Processor IdentityAn integrated supply chain that traces the integrity of the ingredient from planting, to processing, to delivery; ensures separation of product Preservationfrom commodity supply chains Life Cycle AnalysisA methodology of quantifying the environmental impacts associated with a given product. In a Life Cycle Analysis researchers create an (LCA)inventory of resources used and pollutants generated in product production and use MMTMillion metric tons Pea ProteinA plant-based protein ingredient isolated from mostly yellow pea grain used primarily in pet food. Pea Protein Concentrate typically has a Concentrate (PPC)protein content of 50% or greater on a moisture free basis |
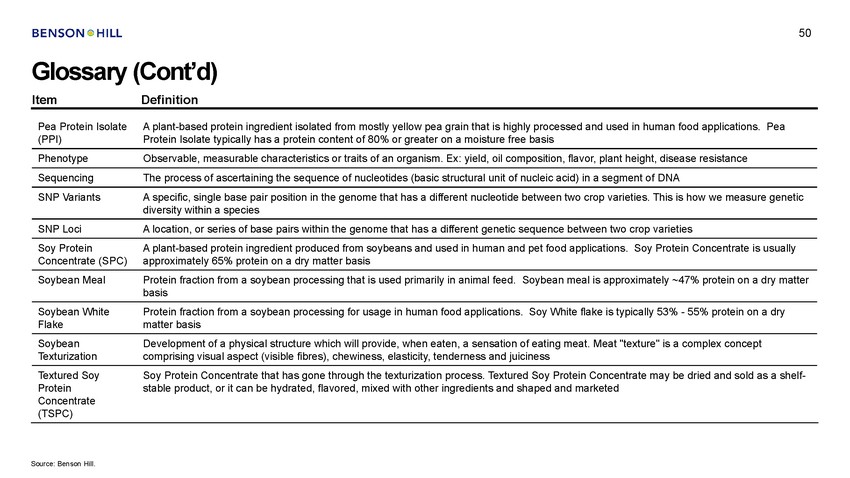 |
50 Glossary (Cont’d) Item Definition Source: Benson Hill. Pea Protein IsolateA plant-based protein ingredient isolated from mostly yellow pea grain that is highly processed and used in human food applications. Pea (PPI)Protein Isolate typically has a protein content of 80% or greater on a moisture free basis PhenotypeObservable, measurable characteristics or traits of an organism. Ex: yield, oil composition, flavor, plant height, disease resistance SequencingThe process of ascertaining the sequence of nucleotides (basic structural unit of nucleic acid) in a segment of DNA SNP VariantsA specific, single base pair position in the genome that has a different nucleotide between two crop varieties. This is how we measure genetic diversity within a species SNP LociA location, or series of base pairs within the genome that has a different genetic sequence between two crop varieties Soy ProteinA plant-based protein ingredient produced from soybeans and used in human and pet food applications. Soy Protein Concentrate is usually Concentrate (SPC)approximately 65% protein on a dry matter basis Soybean MealProtein fraction from a soybean processing that is used primarily in animal feed. Soybean meal is approximately ~47% protein on a dry matter basis Soybean WhiteProtein fraction from a soybean processing for usage in human food applications. Soy White flake is typically 53% - 55% protein on a dry Flakematter basis SoybeanDevelopment of a physical structure which will provide, when eaten, a sensation of eating meat. Meat "texture" is a complex concept Texturizationcomprising visual aspect (visible fibres), chewiness, elasticity, tenderness and juiciness Textured SoySoy Protein Concentrate that has gone through the texturization process. Textured Soy Protein Concentrate may be dried and sold as a shelf-Proteinstable product, or it can be hydrated, flavored, mixed with other ingredients and shaped and marketed Concentrate (TSPC) |
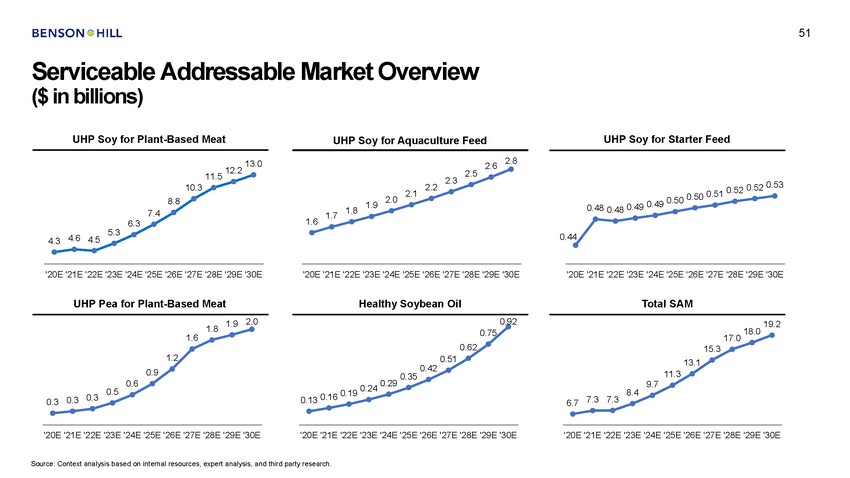 |
51 Serviceable Addressable Market Overview ($ in billions) UHP Soy for Plant-Based Meat UHP Soy for Starter Feed UHP Soy for Aquaculture Feed 2.8 13.0 2.6 12.2 2.5 11.5 2.3 0.53 10.3 2.2 0.51 0.52 0.52 2.1 0.49 0.50 0.50 2.0 8.8 1.9 0.48 0.48 0.49 1.8 7.4 1.7 1.6 6.3 5.3 0.44 4.6 4.5 4.3 '20E '21E '22E '23E '24E '25E '26E '27E '28E '29E '30E '20E '21E '22E '23E '24E '25E '26E '27E '28E '29E '30E '20E '21E '22E '23E '24E '25E '26E '27E '28E '29E '30E UHP Pea for Plant-Based Meat Healthy Soybean Oil Total SAM 2.0 0.92 1.9 19.2 1.8 18.0 17.0 0.75 1.6 0.62 15.3 1.2 0.51 13.1 0.42 0.35 0.9 11.3 0.29 0.6 9.7 0.19 0.24 0.5 8.4 0.13 0.16 0.3 7.3 7.3 0.3 0.3 6.7 '20E '21E '22E '23E '24E '25E '26E '27E '28E '29E '30E '20E '21E '22E '23E '24E '25E '26E '27E '28E '29E '30E '20E '21E '22E '23E '24E '25E '26E '27E '28E '29E '30E Source: Context analysis based on internal resources, expert analysis, and third party research. |
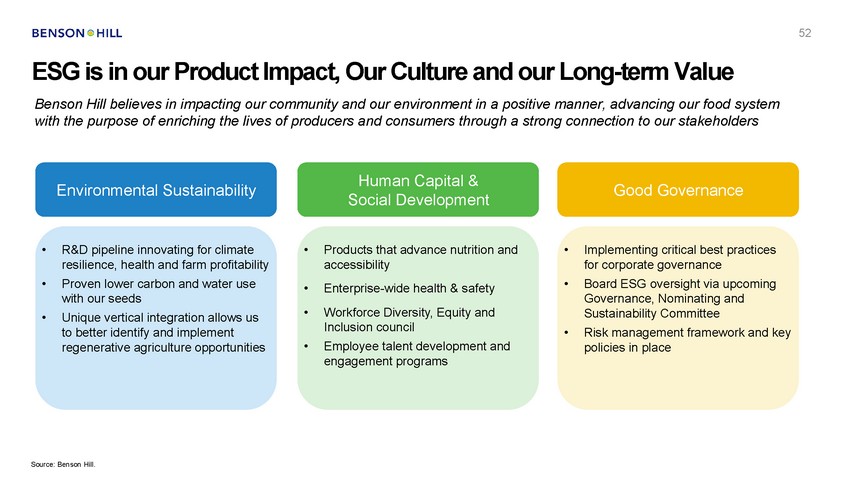 |
52 ESG is in our Product Impact, Our Culture and our Long-term Value Benson Hill believes in impacting our community and our environment in a positive manner, advancing our food system with the purpose of enriching the lives of producers and consumers through a strong connection to our stakeholders Human Capital & Social Development Environmental Sustainability Good Governance • R&D pipeline innovating for climate resilience, health and farm profitability Proven lower carbon and water use with our seeds Unique vertical integration allows us to better identify and implement regenerative agriculture opportunities • Products that advance nutrition and accessibility Enterprise-wide health & safety Workforce Diversity, Equity and Inclusion council Employee talent development and engagement programs • Implementing critical best practices for corporate governance Board ESG oversight via upcoming Governance, Nominating and Sustainability Committee Risk management framework and key policies in place • • • • • • • Source: Benson Hill. |
 |
53 Supported by Best-in-Class Scientific Experts Scientific Advisory Board Todd Mockler Co-Founder and Chair, SAB Plant System Biology and Bioinformatics Julia Bailey-Serres SAB Member Chase Beisel SAB Member Plant Cell Biology CRISPR Gene Editing Rex Bernardo SAB Member Asaph Cousins SAB Member Gary Fogel SAB Member Agronomy and Plant Genetics Photosynthesis Machine Learning Jon Lightner SAB Member Mark Matlock SAB Member Joyce Van Eck SAB Member Agricultural Biotechnology Food Ingredients Plant Biotechnology Source: Benson Hill. |
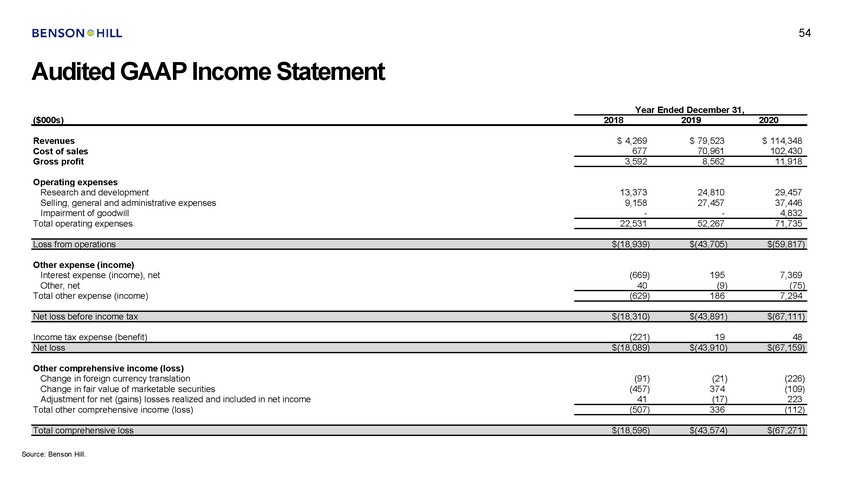 |
54 Audited GAAP Income Statement Year Ended December 31, ($000s) 2018 2019 2020 Revenues Cost of sales Gross profit $ 4,269 677 $ 79,523 70,961 $ 114,348 102,430 3,592 8,562 11,918 Operating expenses Research and development Selling, general and administrative expenses Impairment of goodwill Total operating expenses 13,373 9,158 - 24,810 27,457 - 29,457 37,446 4,832 22,531 52,267 71,735 Other expense (income) Interest expense (income), net Other, net Total other expense (income) (669) 40 195 (9) 7,369 (75) (629) 186 7,294 Income tax expense (benefit) (221) 19 48 Other comprehensive income (loss) Change in foreign currency translation Change in fair value of marketable securities Adjustment for net (gains) losses realized and included in net income Total other comprehensive income (loss) (91) (457) 41 (21) 374 (17) (226) (109) 223 (507) 336 (112) Source: Benson Hill. Total comprehensive loss$(18,596)$(43,574)$(67,271) Net loss$(18,089)$(43,910)$(67,159) Net loss before income tax$(18,310)$(43,891)$(67,111) Loss from operations$(18,939)$(43,705)$(59,817) |
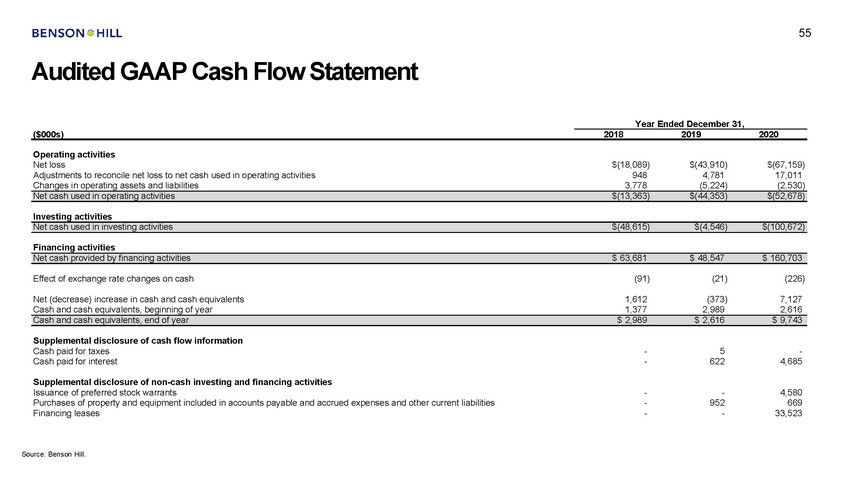 |
55 Audited GAAP Cash Flow Statement Year Ended December 31, ($000s) 2018 2019 2020 Operating activities Net loss Adjustments to reconcile net loss to net cash used in operating activities Changes in operating assets and liabilities $(18,089) 948 3,778 $(43,910) 4,781 (5,224) $(67,159) 17,011 (2,530) Investing activities Financing activities Effect of exchange rate changes on cash (91) (21) (226) Net (decrease) increase in cash and cash equivalents Cash and cash equivalents, beginning of year 1,612 1,377 (373) 2,989 7,127 2,616 Supplemental disclosure of cash flow information Cash paid for taxes Cash paid for interest - - 5 622 - 4,685 Supplemental disclosure of non-cash investing and financing activities Issuance of preferred stock warrants Purchases of property and equipment included in accounts payable and accrued expenses and other current liabilities Financing leases - - - - 952 - 4,580 669 33,523 Source: Benson Hill. Cash and cash equivalents, end of year$ 2,989$ 2,616$ 9,743 Net cash provided by financing activities$ 63,681$ 48,547$ 160,703 Net cash used in investing activities$(48,615)$(4,546)$(100,672) Net cash used in operating activities$(13,363)$(44,353)$(52,678) |
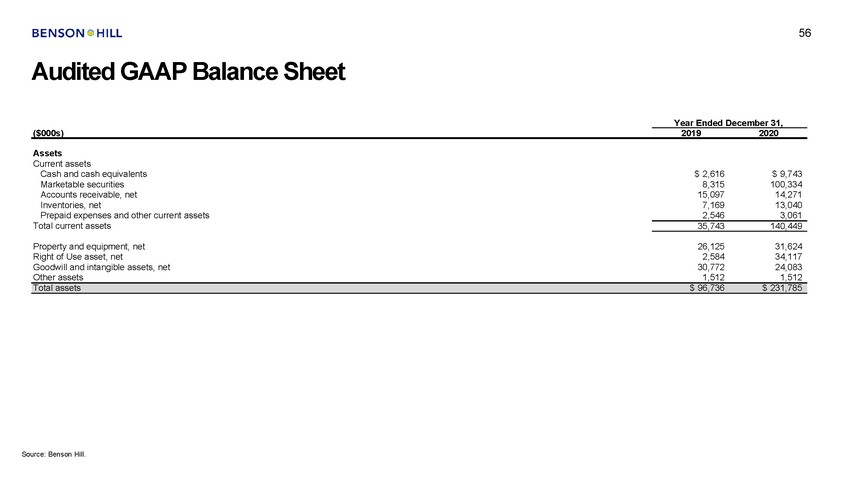 |
56 Audited GAAP Balance Sheet Year Ended December 31, ($000s) 2019 2020 Assets Current assets Cash and cash equivalents Marketable securities Accounts receivable, net Inventories, net Prepaid expenses and other current assets Total current assets $ 2,616 8,315 15,097 7,169 2,546 $ 9,743 100,334 14,271 13,040 3,061 35,743 140,449 Property and equipment, net Right of Use asset, net Goodwill and intangible assets, net Other assets 26,125 2,584 30,772 1,512 31,624 34,117 24,083 1,512 Source: Benson Hill. Total assets$ 96,736$ 231,785 |
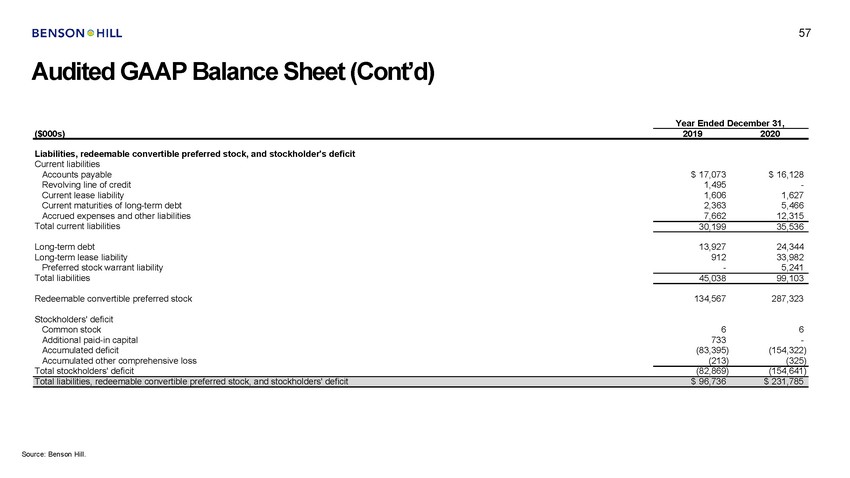 |
57 Audited GAAP Balance Sheet (Cont’d) Year Ended December 31, ($000s) 2019 2020 Liabilities, redeemable convertible preferred stock, and stockholder's deficit Current liabilities Accounts payable Revolving line of credit Current lease liability Current maturities of long-term debt Accrued expenses and other liabilities Total current liabilities $ 17,073 1,495 1,606 2,363 7,662 $ 16,128 - 1,627 5,466 12,315 30,199 35,536 Long-term debt Long-term lease liability Preferred stock warrant liability Total liabilities 13,927 912 - 24,344 33,982 5,241 45,038 99,103 Redeemable convertible preferred stock 134,567 287,323 Stockholders' deficit Common stock Additional paid-in capital Accumulated deficit Accumulated other comprehensive loss Total stockholders' deficit 6 733 (83,395) (213) 6 - (154,322) (325) (82,869) (154,641) Source: Benson Hill. Total liabilities, redeemable convertible preferred stock, and stockholders' deficit$ 96,736$ 231,785 |