Attached files
| file | filename |
|---|---|
| 8-K - 8-K - SAUL CENTERS, INC. | bfs-20210507.htm |
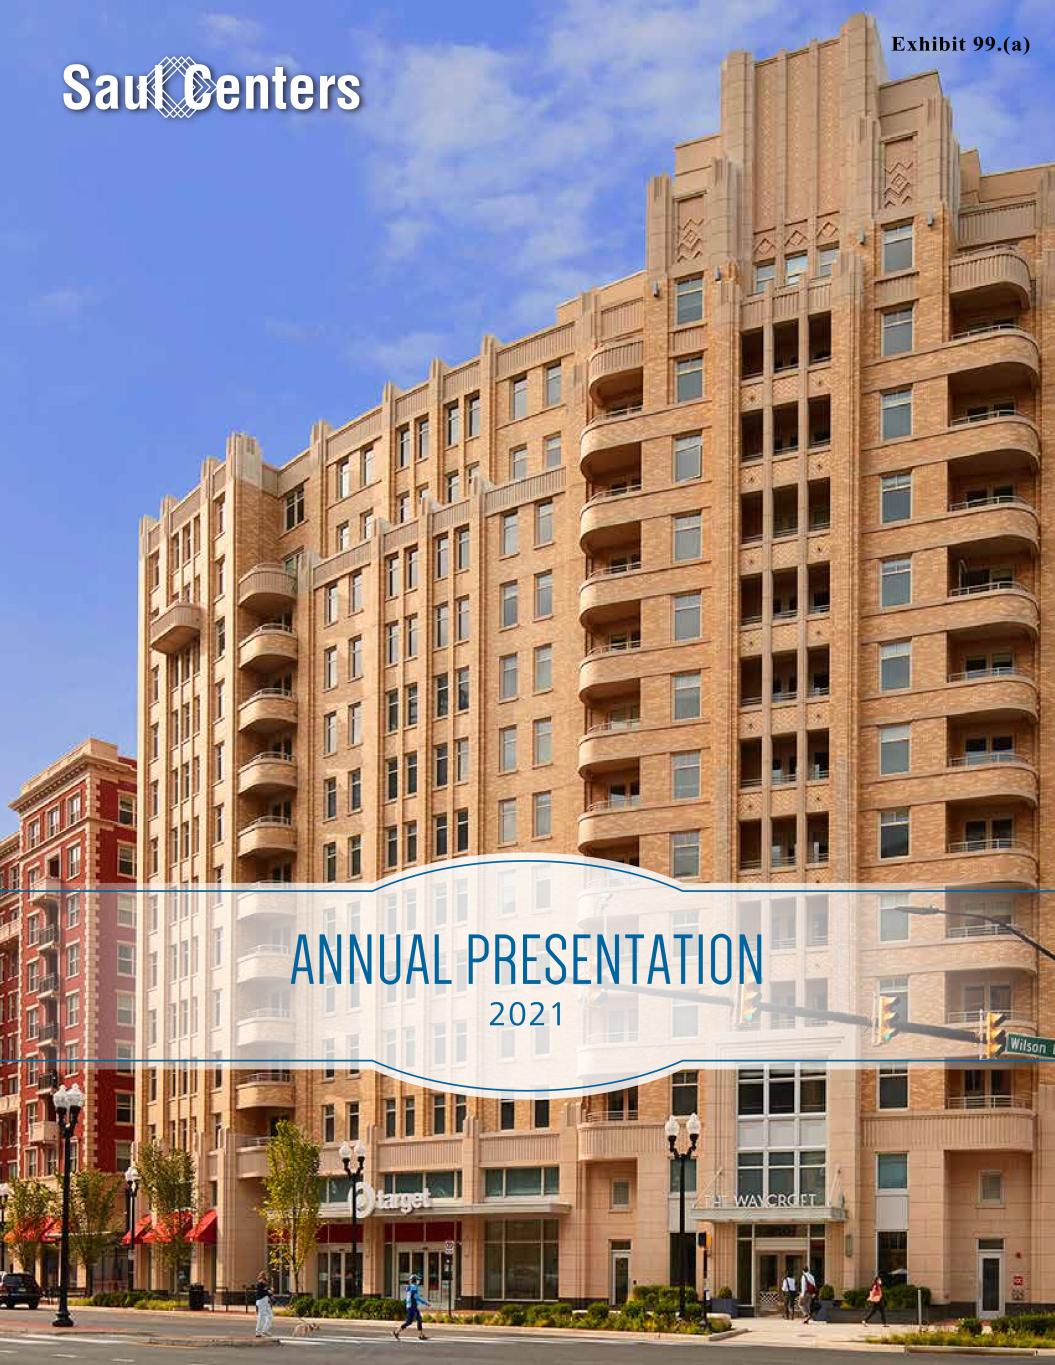
ANNUAL PRESENTATION 2021 Exhibit 99.(a)
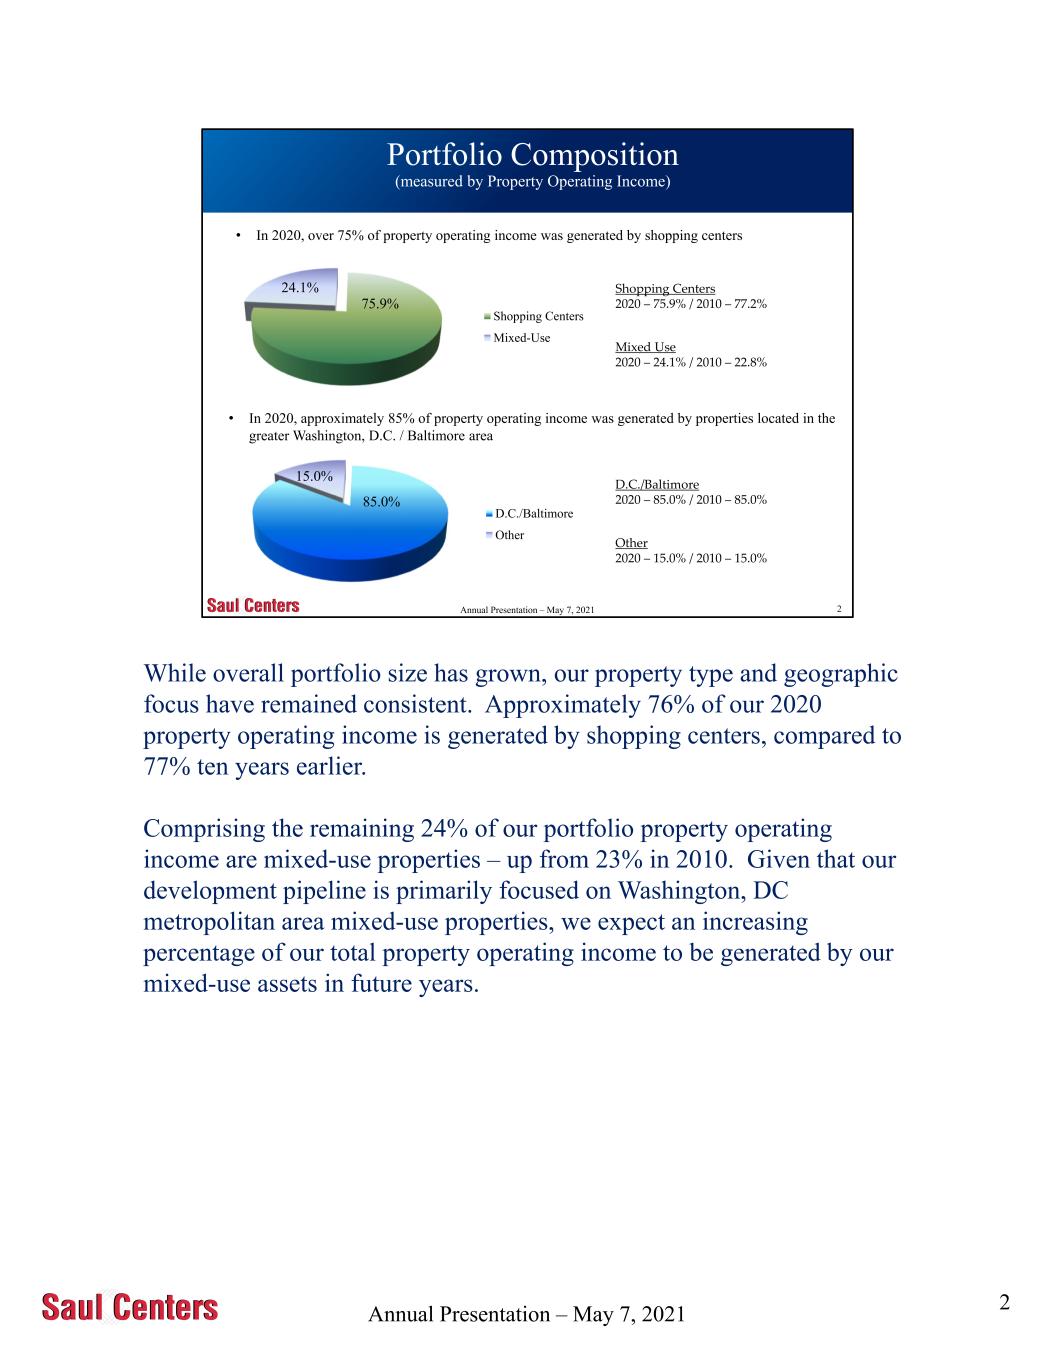
Annual Presentation – May 7, 2021 2 Portfolio Composition (measured by Property Operating Income) Annual Presentation – May 7, 2021 • In 2020, over 75% of property operating income was generated by shopping centers • In 2020, approximately 85% of property operating income was generated by properties located in the greater Washington, D.C. / Baltimore area D.C./Baltimore 2020 – 85.0% / 2010 – 85.0% Other 2020 – 15.0% / 2010 – 15.0% Shopping Centers 2020 – 75.9% / 2010 – 77.2% Mixed Use 2020 – 24.1% / 2010 – 22.8% 75.9% 24.1% Shopping Centers Mixed-Use 85.0% 15.0% D.C./Baltimore Other Annu l Presentation – May 7, 2021 While overall portfolio size has grown, our property type and geographic focus have remained consistent. Approximately 76% of our 2020 property operating income is generated by shopping centers, compared to 77% ten years earlier. Comprising the remaining 24% of our portfolio property operating income are mixed-use properties – up from 23% in 2010. Given that our development pipeline is primarily focused on Washington, DC metropolitan area mixed-use properties, we expect an increasing percentage of our total property operating income to be generated by our mixed-use assets in future years. 2
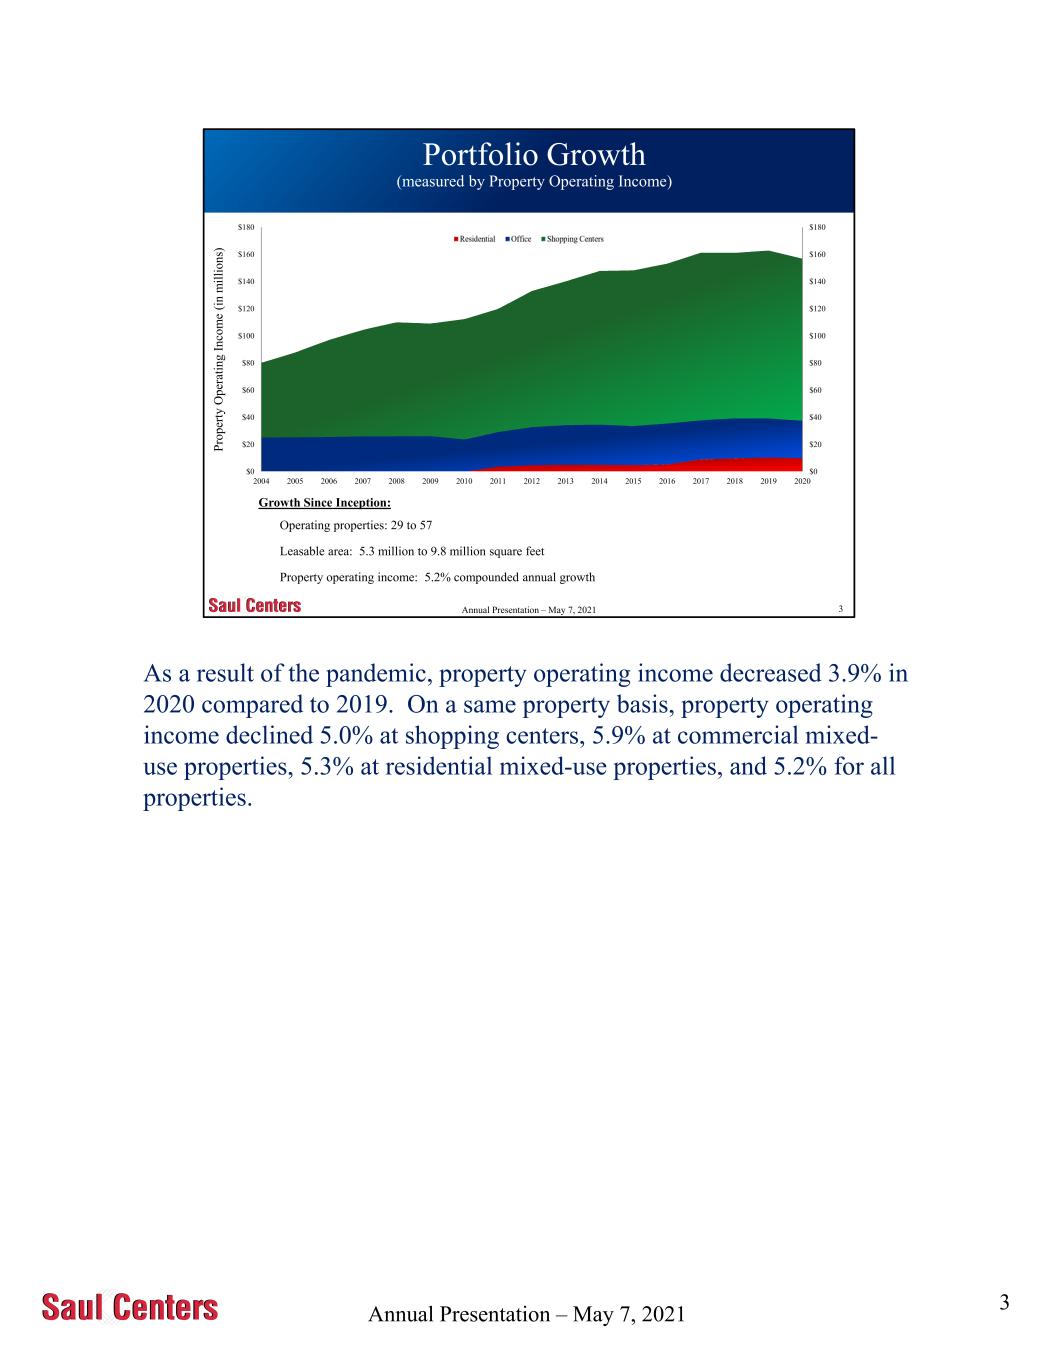
Annual Presentation – May 7, 2021 3 Portfolio Growth (measured by Property Operating Income) 5/10/2021 P ro p er ty O p er at in g I n co m e (i n m il li o n s) Operating properties: 29 to 57 Leasable area: 5.3 million to 9.8 million square feet Property operating income: 5.2% compounded annual growth $0 $20 $40 $60 $80 $100 $120 $140 $160 $180 $0 $20 $40 $60 $80 $100 $120 $140 $160 $180 2004 2005 2006 2007 2008 2009 2010 2011 2012 2013 2014 2015 2016 2017 2018 2019 2020 Growth Since Inception: Annual Presentation – May 7, 2021 As a result of the pandemic, property operating income decreased 3.9% in 2020 compared to 2019. On a same property basis, property operating income declined 5.0% at shopping centers, 5.9% at commercial mixed- use properties, 5.3% at residential mixed-use properties, and 5.2% for all properties. 3
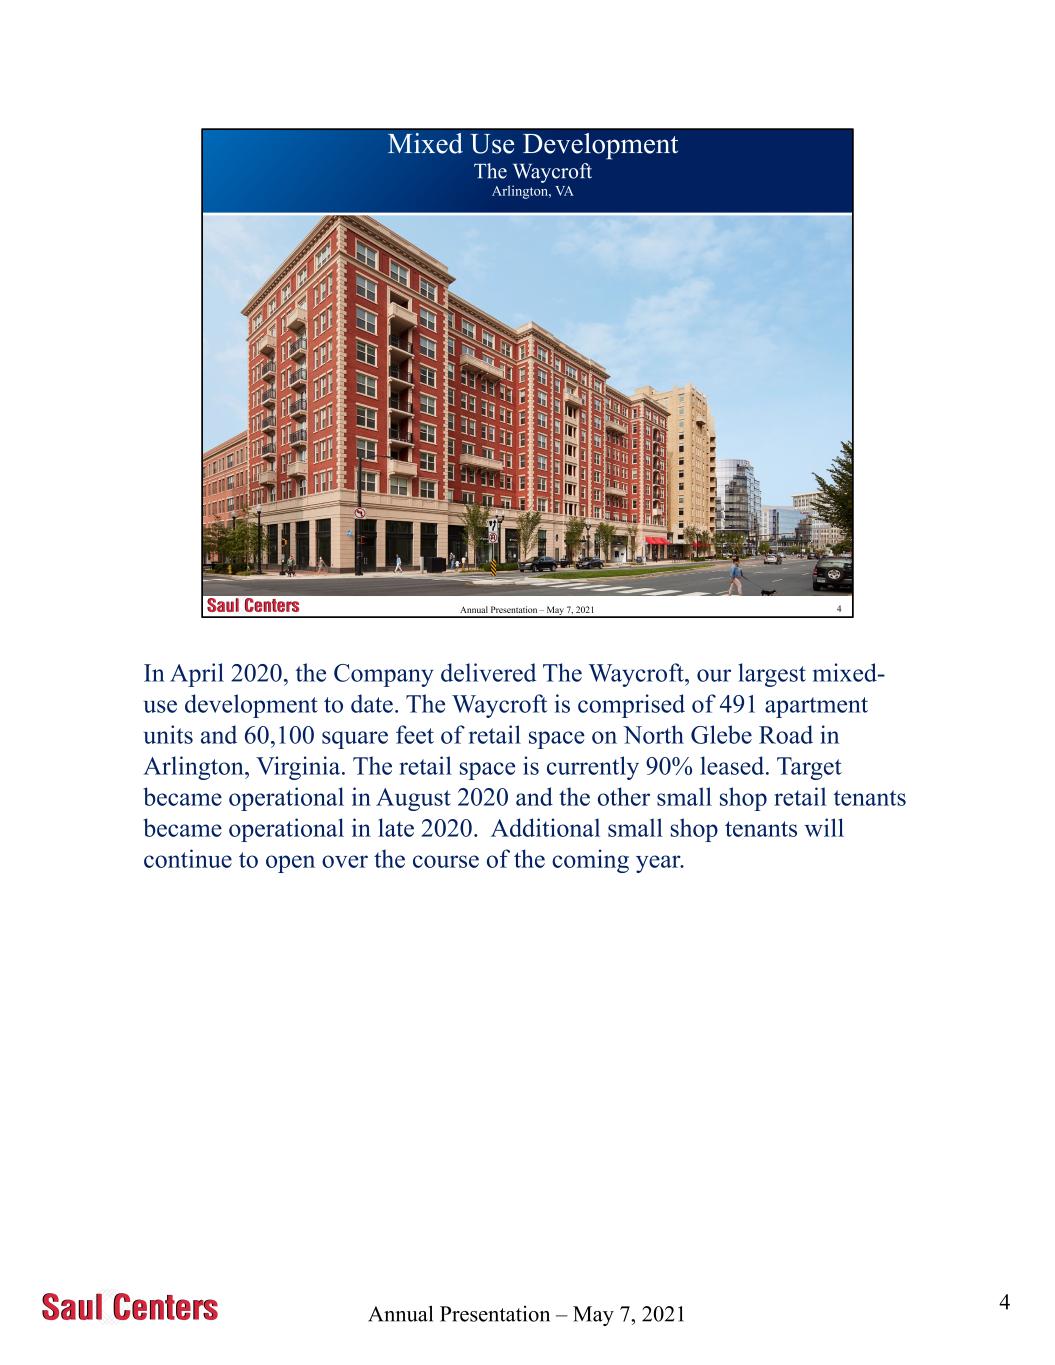
Annual Presentation – May 7, 2021 4 Mixed-Use Development 750 N. Glebe Road Arlington, Virginia Mixed Use Development The Waycroft Arlington, VA Annual Presentation – May 7, 2021 In April 2020, the Company delivered The Waycroft, our largest mixed- use development to date. The Waycroft is comprised of 491 apartment units and 60,100 square feet of retail space on North Glebe Road in Arlington, Virginia. The retail space is currently 90% leased. Target became operational in August 2020 and the other small shop retail tenants became operational in late 2020. Additional small shop tenants will continue to open over the course of the coming year. 4
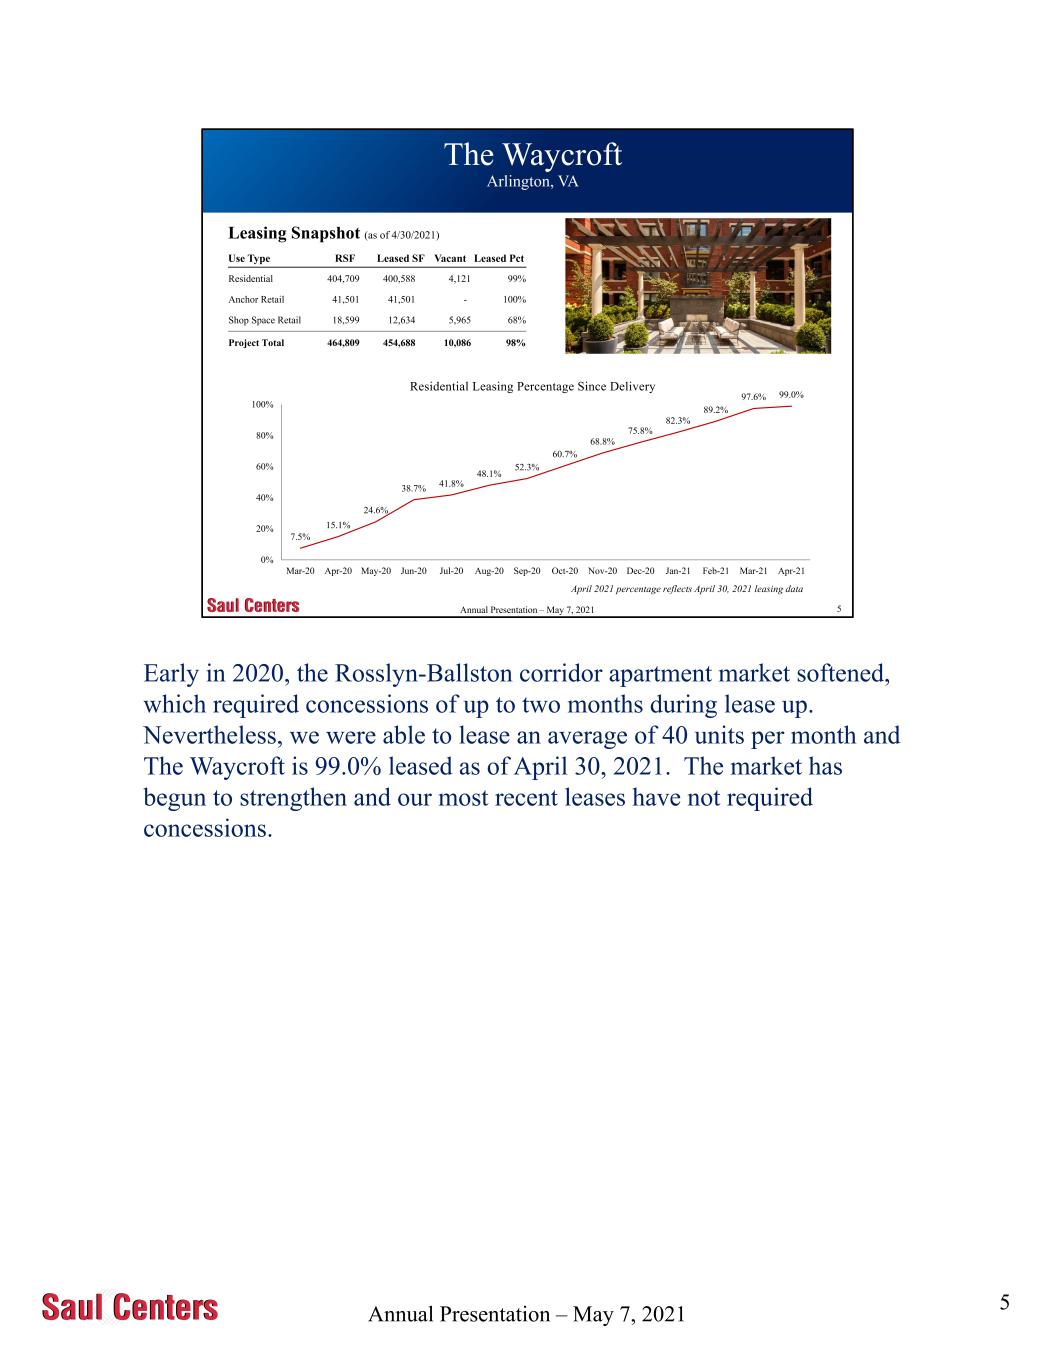
Annual Presentation – May 7, 2021 5 The Waycroft Arlington, VA 5/10/2021 Use Type RSF Leased SF Vacant Leased Pct Residential 404,709 400,588 4,121 99% Anchor Retail 41,501 41,501 - 100% Shop Space Retail 18,599 12,634 5,965 68% Project Total 464,809 454,688 10,086 98% Leasing Snapshot (as of 4/30/2021) 7.5% 15.1% 24.6% 38.7% 41.8% 48.1% 52.3% 60.7% 68.8% 75.8% 82.3% 89.2% 97.6% 99.0% 0% 20% 40% 60% 80% 100% Mar-20 Apr-20 May-20 Jun-20 Jul-20 Aug-20 Sep-20 Oct-20 Nov-20 Dec-20 Jan-21 Feb-21 Mar-21 Apr-21 Residential Leasing Percentage Since Delivery April 2021 percentage reflects April 30, 2021 leasing data Annual Presentation – May 7, 2021 Early in 2020, the Rosslyn-Ballston corridor apartment market softened, which required concessions of up to two months during lease up. Nevertheless, we were able to lease an average of 40 units per month and The Waycroft is 99.0% leased as of April 30, 2021. The market has begun to strengthen and our most recent leases have not required concessions. 5
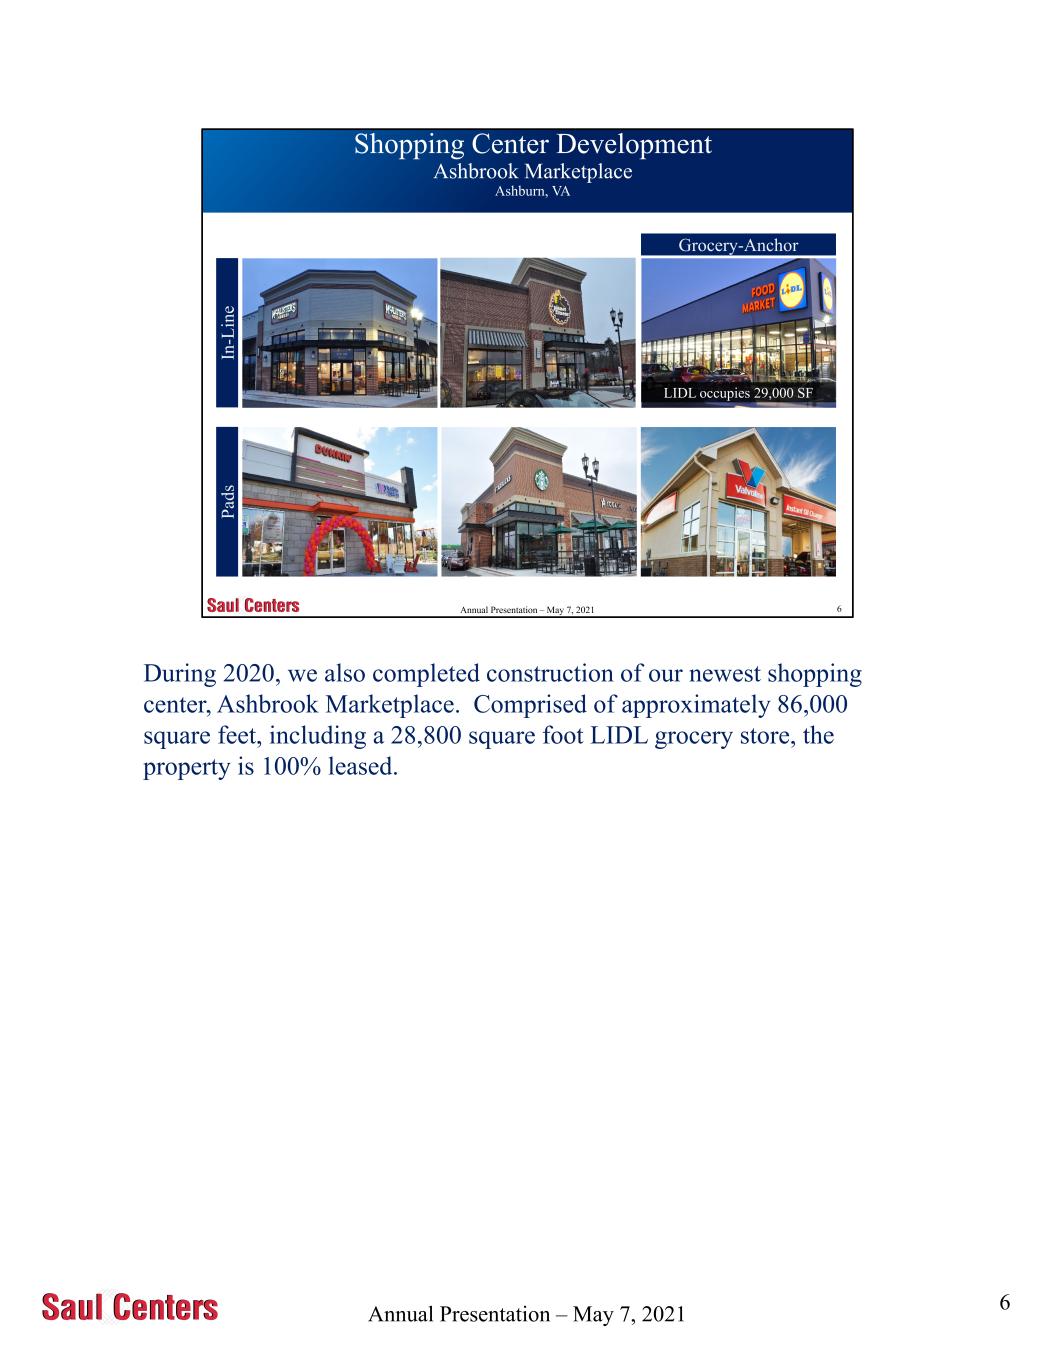
Annual Presentation – May 7, 2021 6 Shopping Center Development Ashbrook Marketplace Ashburn, VA 5/10/2021 LIDL occupies 29,000 SF In -L in e P ad s Grocery-Anchor Annual Presentation – May 7, 2021 During 2020, we also completed construction of our newest shopping center, Ashbrook Marketplace. Comprised of approximately 86,000 square feet, including a 28,800 square foot LIDL grocery store, the property is 100% leased. 6
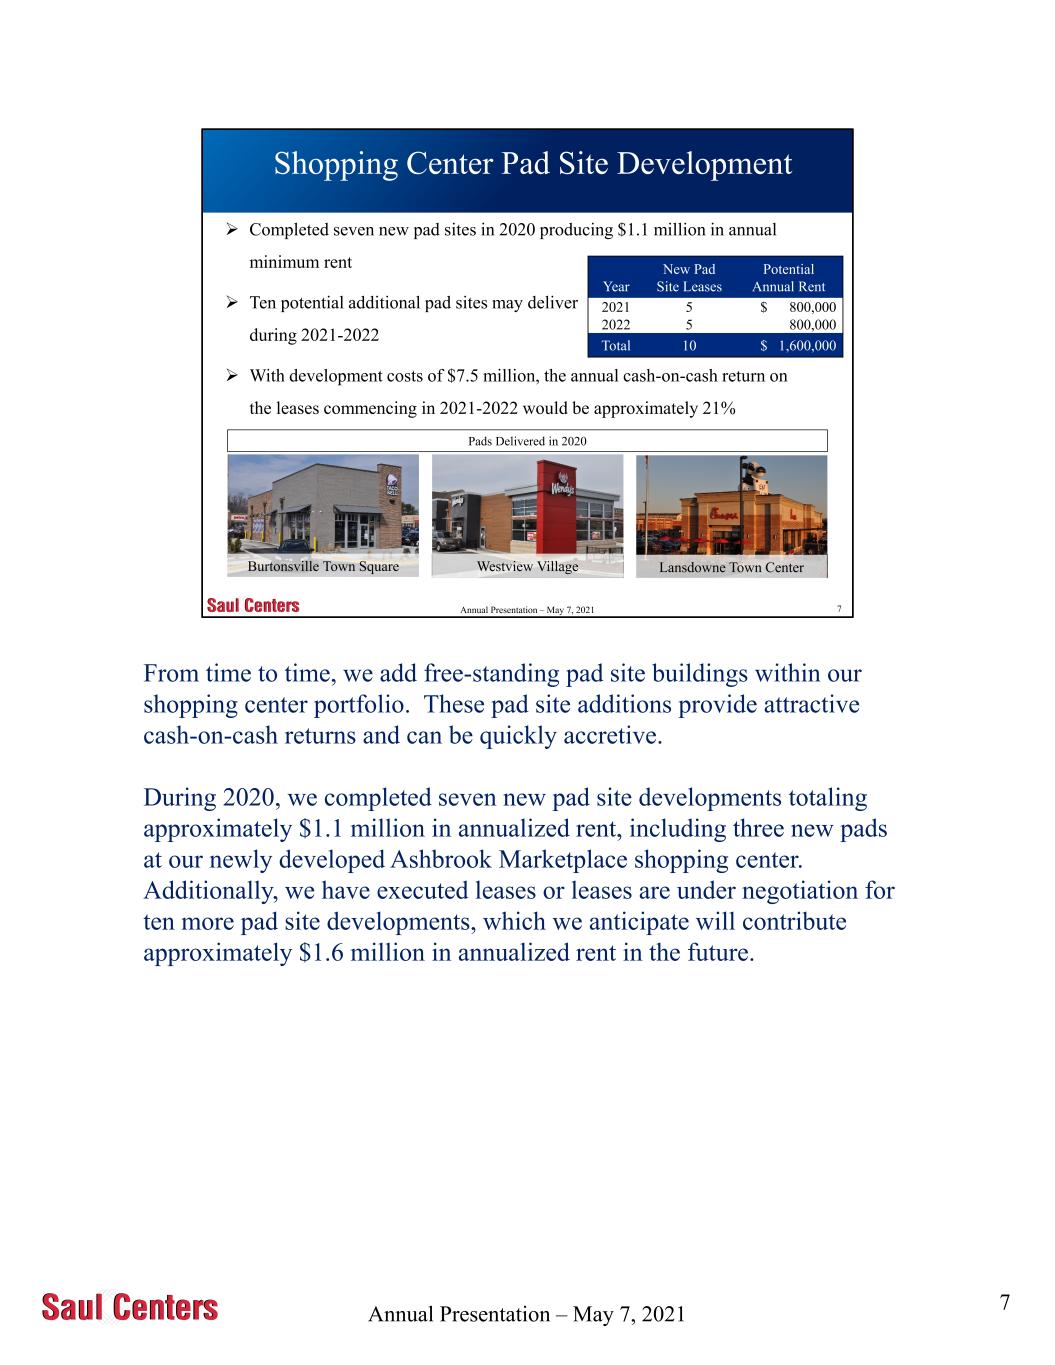
Annual Presentation – May 7, 2021 7 Shopping Center Pad Site Development 5/10/2021 Completed seven new pad sites in 2020 producing $1.1 million in annual minimum rent Westview VillageBurtonsville Town Square Lansdowne Town Center Year New Pad Site Leases Potential Annual Rent 2021 5 $ 800,000 2022 5 800,000 Total 10 $ 1,600,000 Ten potential additional pad sites may deliver during 2021-2022 With development costs of $7.5 million, the annual cash-on-cash return on the leases commencing in 2021-2022 would be approximately 21% Pads Delivered in 2020 Annual Presentation – May 7, 2021 From time to time, we add free-standing pad site buildings within our shopping center portfolio. These pad site additions provide attractive cash-on-cash returns and can be quickly accretive. During 2020, we completed seven new pad site developments totaling approximately $1.1 million in annualized rent, including three new pads at our newly developed Ashbrook Marketplace shopping center. Additionally, we have executed leases or leases are under negotiation for ten more pad site developments, which we anticipate will contribute approximately $1.6 million in annualized rent in the future. 7
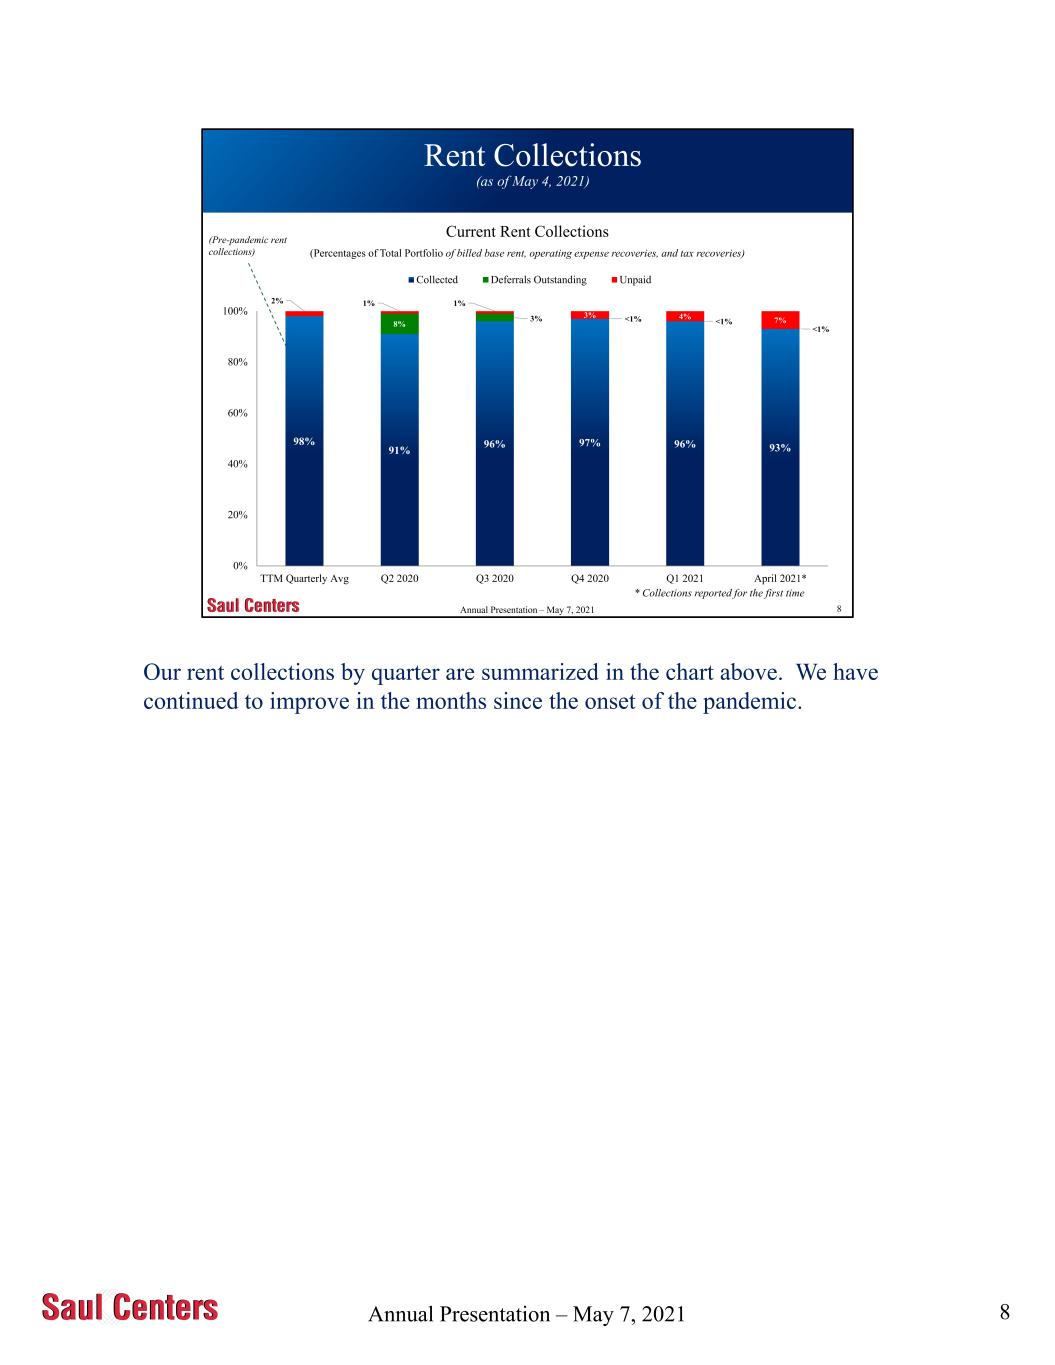
Annual Presentation – May 7, 2021 8 98% 91% 96% 97% 96% 93% 8% 3% <1% <1% <1% 2% 1% 1% 3% 4% 7% 0% 20% 40% 60% 80% 100% TTM Quarterly Avg Q2 2020 Q3 2020 Q4 2020 Q1 2021 April 2021* Current Rent Collections (Percentages of Total Portfolio of billed base rent, operating expense recoveries, and tax recoveries) Collected Deferrals Outstanding Unpaid (Pre-pandemic rent collections) * Collections reported for the first time Annual Presentation – May 7, 2021 Rent Collections (as of May 4, 2021) Our rent collections by quarter are summarized in the chart above. We have continued to improve in the months since the onset of the pandemic. 8
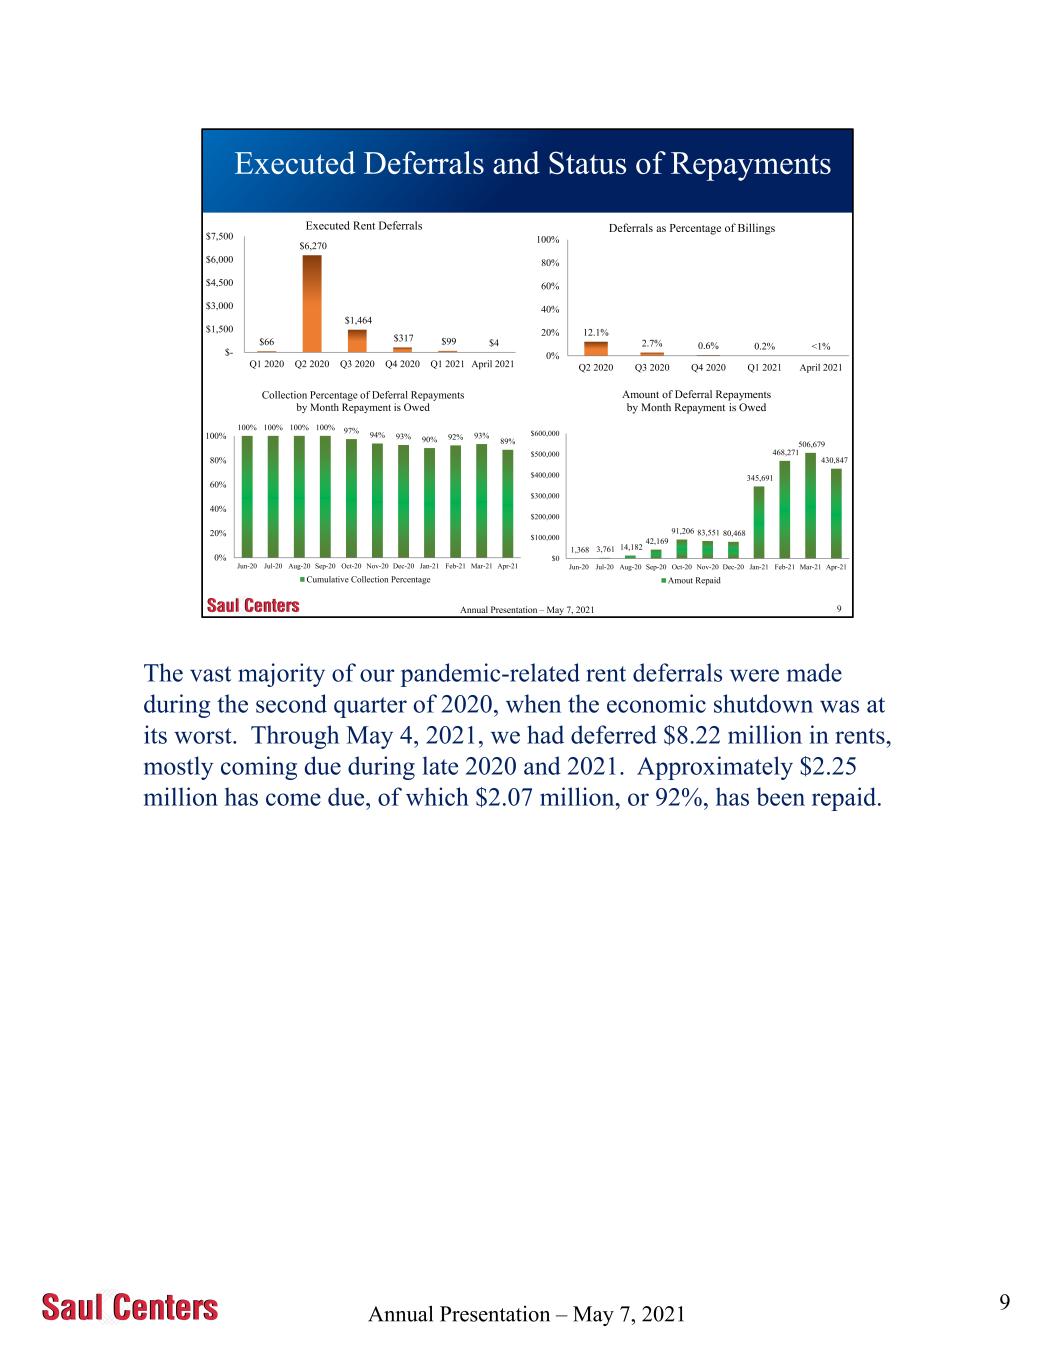
Annual Presentation – May 7, 2021 9 Executed Deferrals and Status of Repayments 5/10/2021 $66 $6,270 $1,464 $317 $99 $4 $- $1,500 $3,000 $4,500 $6,000 $7,500 Q1 2020 Q2 2020 Q3 2020 Q4 2020 Q1 2021 April 2021 Executed Rent Deferrals Annual Presentation – May 7, 2021 12.1% 2.7% 0.6% 0.2% <1% 0% 20% 40% 60% 80% 100% Q2 2020 Q3 2020 Q4 2020 Q1 2021 April 2021 Deferrals as Percentage of Billings 100% 100% 100% 100% 97% 94% 93% 90% 92% 93% 89% 0% 20% 40% 60% 80% 100% Jun-20 Jul-20 Aug-20 Sep-20 Oct-20 Nov-20 Dec-20 Jan-21 Feb-21 Mar-21 Apr-21 Collection Percentage of Deferral Repayments by Month Repayment is Owed Cumulative Collection Percentage 1,368 3,761 14,182 42,169 91,206 83,551 80,468 345,691 468,271 506,679 430,847 $0 $100,000 $200,000 $300,000 $400,000 $500,000 $600,000 Jun-20 Jul-20 Aug-20 Sep-20 Oct-20 Nov-20 Dec-20 Jan-21 Feb-21 Mar-21 Apr-21 Amount of Deferral Repayments by Month Repayment is Owed Amout Repaid The vast majority of our pandemic-related rent deferrals were made during the second quarter of 2020, when the economic shutdown was at its worst. Through May 4, 2021, we had deferred $8.22 million in rents, mostly coming due during late 2020 and 2021. Approximately $2.25 million has come due, of which $2.07 million, or 92%, has been repaid. 9
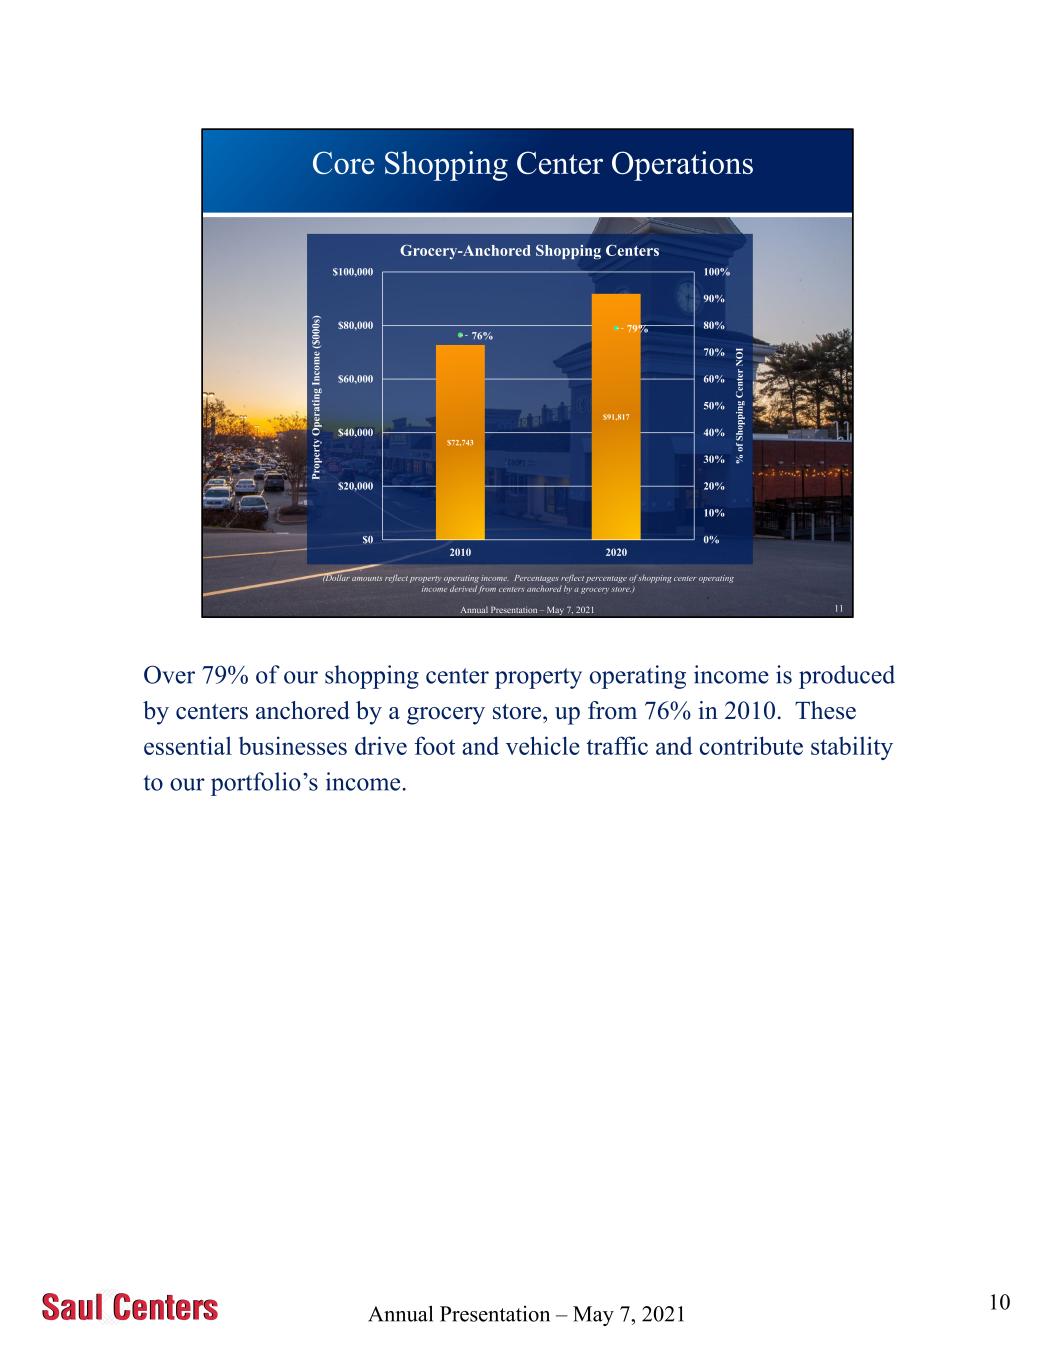
Annual Presentation – May 7, 2021 10 Core Shopping Center Operations $72,743 $91,817 76% 79% 0% 10% 20% 30% 40% 50% 60% 70% 80% 90% 100% $0 $20,000 $40,000 $60,000 $80,000 $100,000 2010 2020 % o f S h op p in g C en te r N O I P ro p er ty O p er a ti n g I n co m e ($ 0 0 0 s) Grocery-Anchored Shopping Centers 1 (Dollar amounts reflect property operating income. Percentages reflect percentage of shopping center operating income derived from centers anchored by a grocery store.) Annual Presentation – May 7, 2021 Over 79% of our shopping center property operating income is produced by centers anchored by a grocery store, up from 76% in 2010. These essential businesses drive foot and vehicle traffic and contribute stability to our portfolio’s income. 10
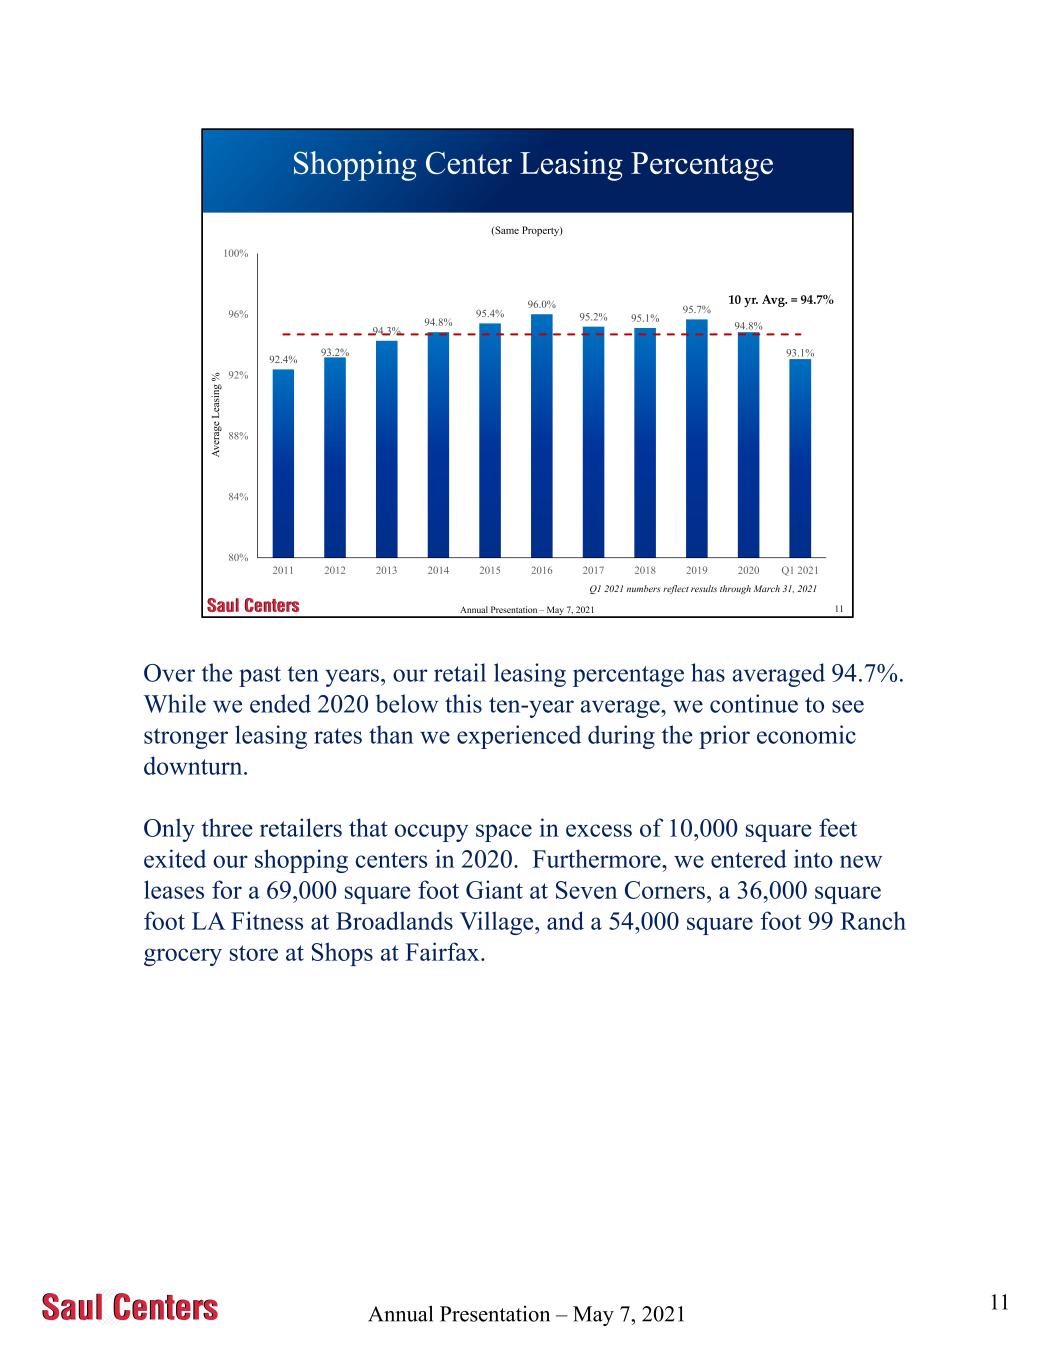
Annual Presentation – May 7, 2021 11 92.4% 93.2% 94.3% 94.8% 95.4% 96.0% 95.2% 95.1% 95.7% 94.8% 93.1% 80% 84% 88% 92% 96% 100% 2011 2012 2013 2014 2015 2016 2017 2018 2019 2020 Q1 2021 Shopping Center Leasing Percentage 5/10/2021 A v er ag e L ea si n g % 10 yr. Avg. = 94.7% (Same Property) Q1 2021 numbers reflect results through March 31, 2021 Annual Presentation – May 7, 2021 Over the past ten years, our retail leasing percentage has averaged 94.7%. While we ended 2020 below this ten-year average, we continue to see stronger leasing rates than we experienced during the prior economic downturn. Only three retailers that occupy space in excess of 10,000 square feet exited our shopping centers in 2020. Furthermore, we entered into new leases for a 69,000 square foot Giant at Seven Corners, a 36,000 square foot LA Fitness at Broadlands Village, and a 54,000 square foot 99 Ranch grocery store at Shops at Fairfax. 11
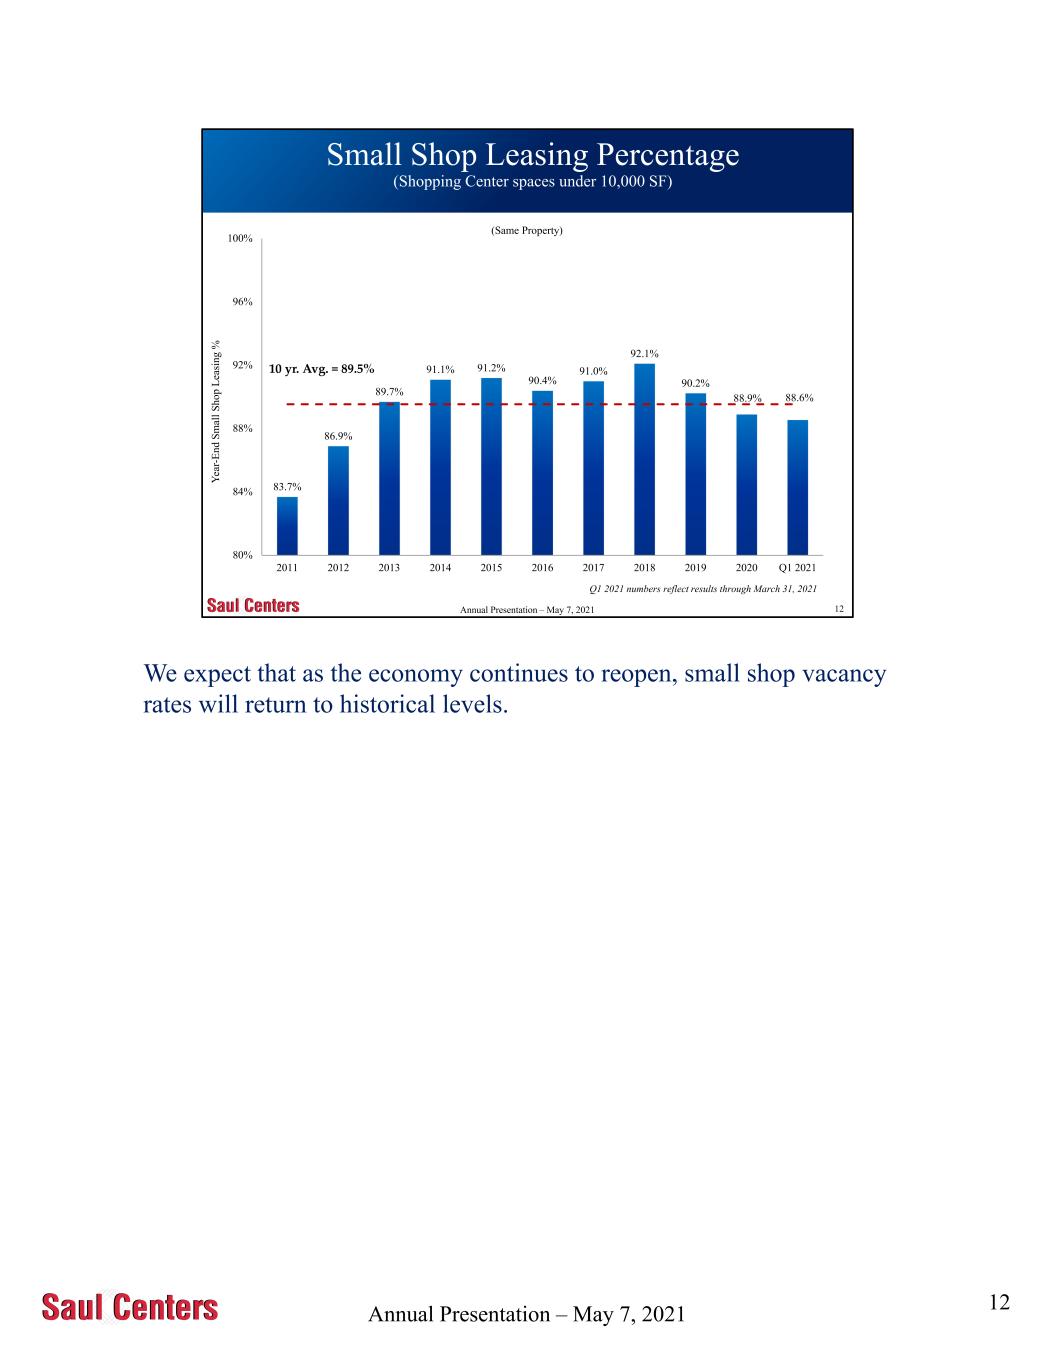
Annual Presentation – May 7, 2021 12 Small Shop Leasing Percentage (Shopping Center spaces under 10,000 SF) 5/10/2021 83.7% 86.9% 89.7% 91.1% 91.2% 90.4% 91.0% 92.1% 90.2% 88.9% 88.6% 80% 84% 88% 92% 96% 100% 2011 2012 2013 2014 2015 2016 2017 2018 2019 2020 Q1 2021 Y ea r- E n d S m al l S h o p L ea si n g % 10 yr. Avg. = 89.5% (Same Property) Q1 2021 numbers reflect results through March 31, 2021 Annual Presentation – May 7, 2021 We expect that as the economy continues to reopen, small shop vacancy rates will return to historical levels. 12
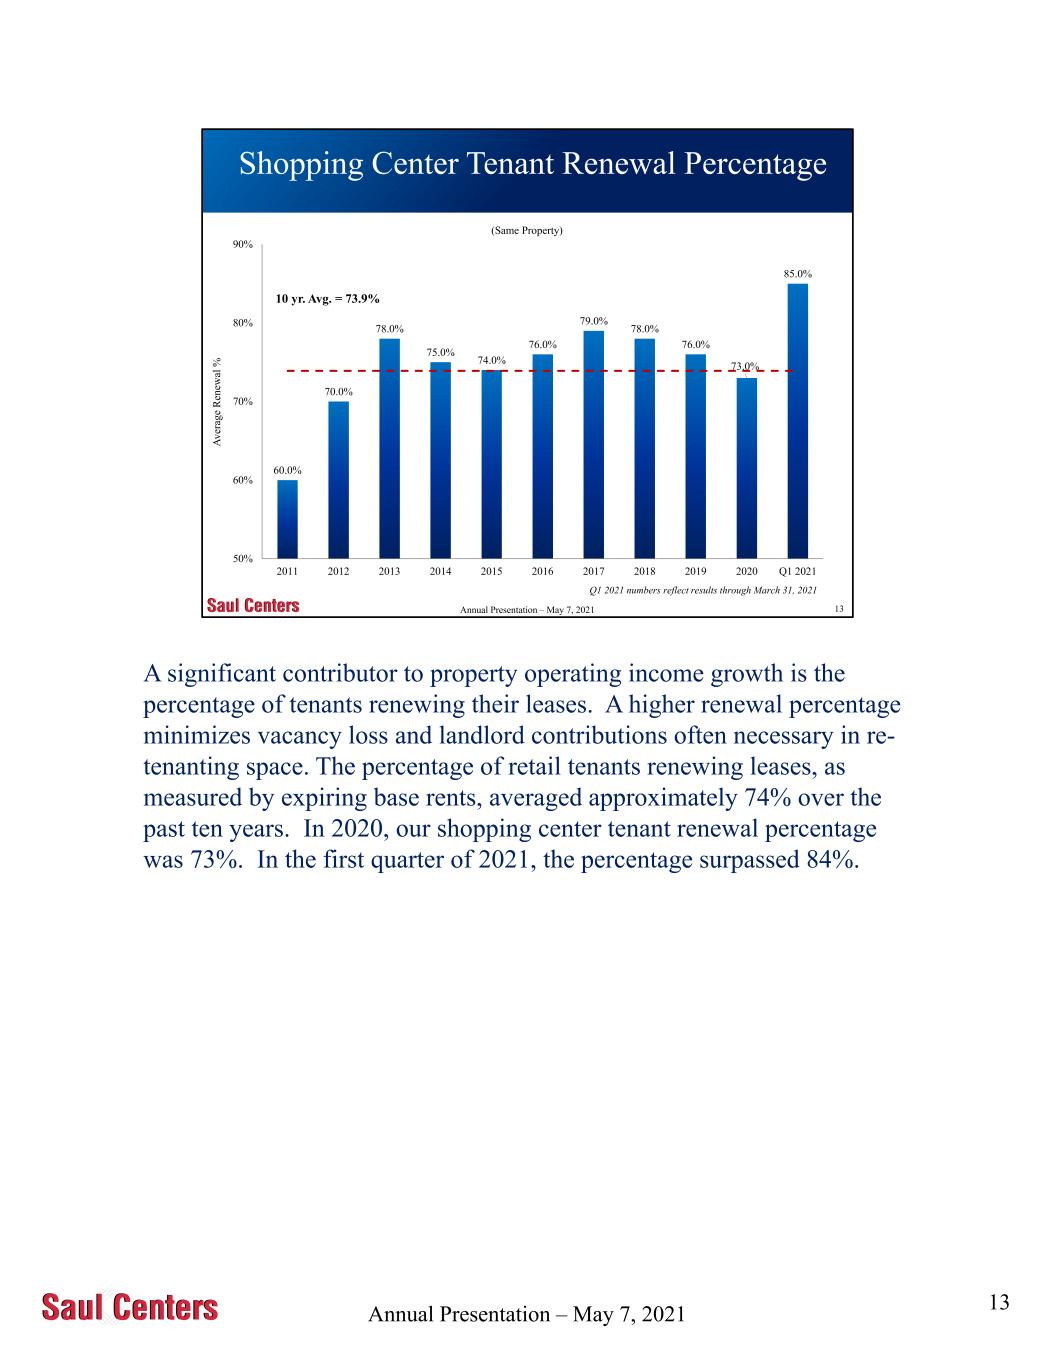
Annual Presentation – May 7, 2021 13 60.0% 70.0% 78.0% 75.0% 74.0% 76.0% 79.0% 78.0% 76.0% 73.0% 85.0% 50% 60% 70% 80% 90% 2011 2012 2013 2014 2015 2016 2017 2018 2019 2020 Q1 2021 Shopping Center Tenant Renewal Percentage 5/10/2021 10 yr. Avg. = 73.9% (Same Property) A v er ag e R en ew al % Q1 2021 numbers reflect results through March 31, 2021 Annual Presentation – May 7, 2021 A significant contributor to property operating income growth is the percentage of tenants renewing their leases. A higher renewal percentage minimizes vacancy loss and landlord contributions often necessary in re- tenanting space. The percentage of retail tenants renewing leases, as measured by expiring base rents, averaged approximately 74% over the past ten years. In 2020, our shopping center tenant renewal percentage was 73%. In the first quarter of 2021, the percentage surpassed 84%. 13
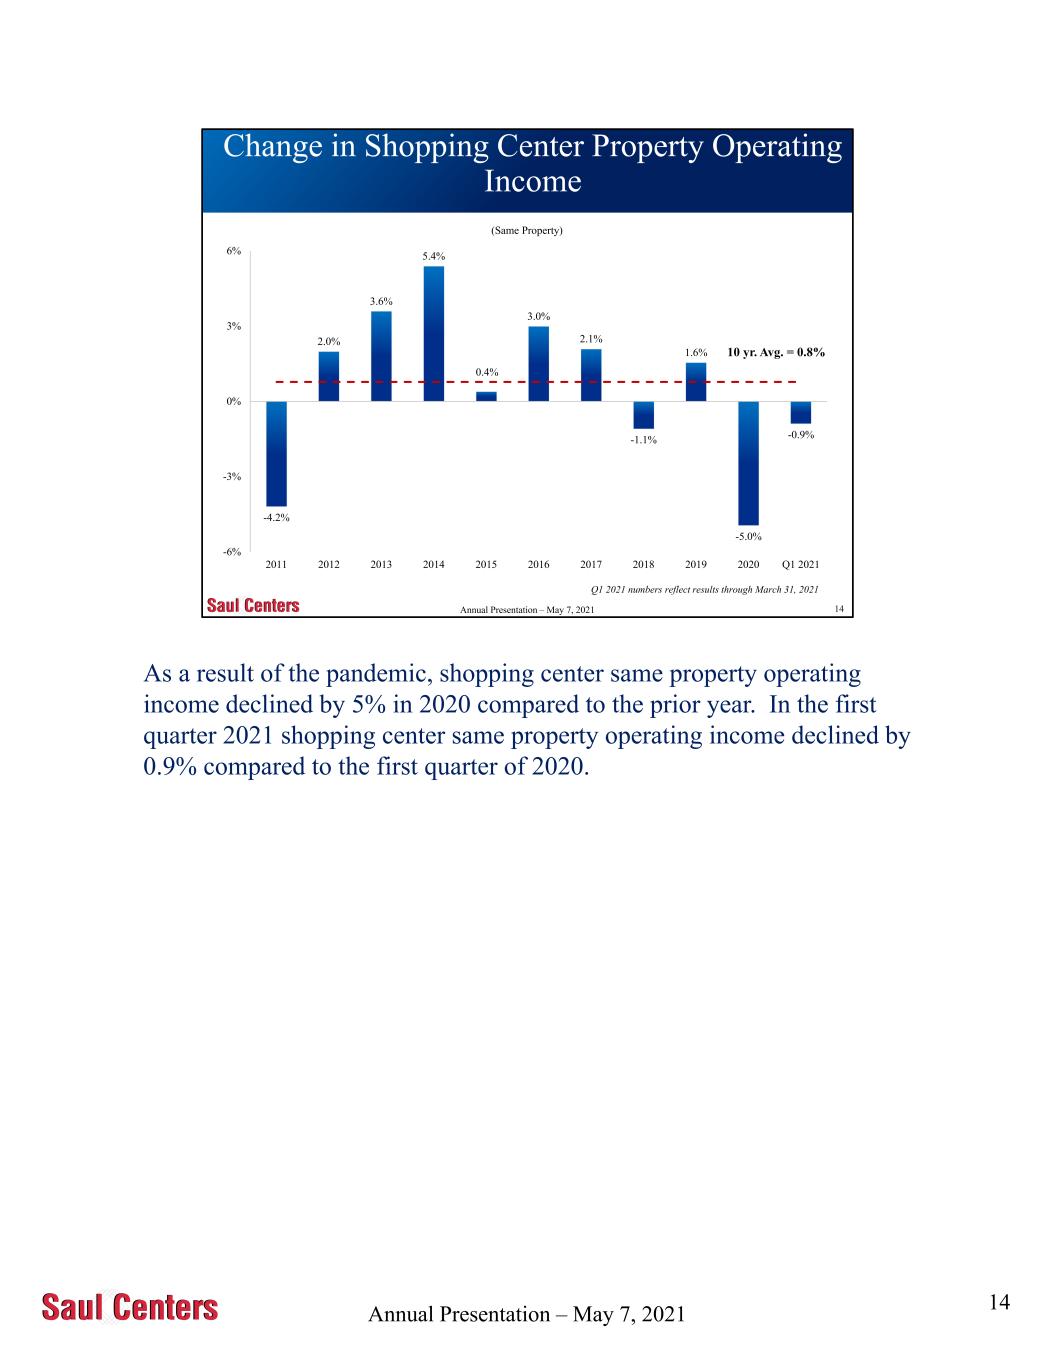
Annual Presentation – May 7, 2021 14 Change in Shopping Center Property Operating Income 5/10/2021 -4.2% 2.0% 3.6% 5.4% 0.4% 3.0% 2.1% -1.1% 1.6% -5.0% -0.9% -6% -3% 0% 3% 6% 2011 2012 2013 2014 2015 2016 2017 2018 2019 2020 Q1 2021 10 yr. Avg. = 0.8% (Same Property) Q1 2021 numbers reflect results through March 31, 2021 Annual Presentation – May 7, 2021 As a result of the pandemic, shopping center same property operating income declined by 5% in 2020 compared to the prior year. In the first quarter 2021 shopping center same property operating income declined by 0.9% compared to the first quarter of 2020. 14
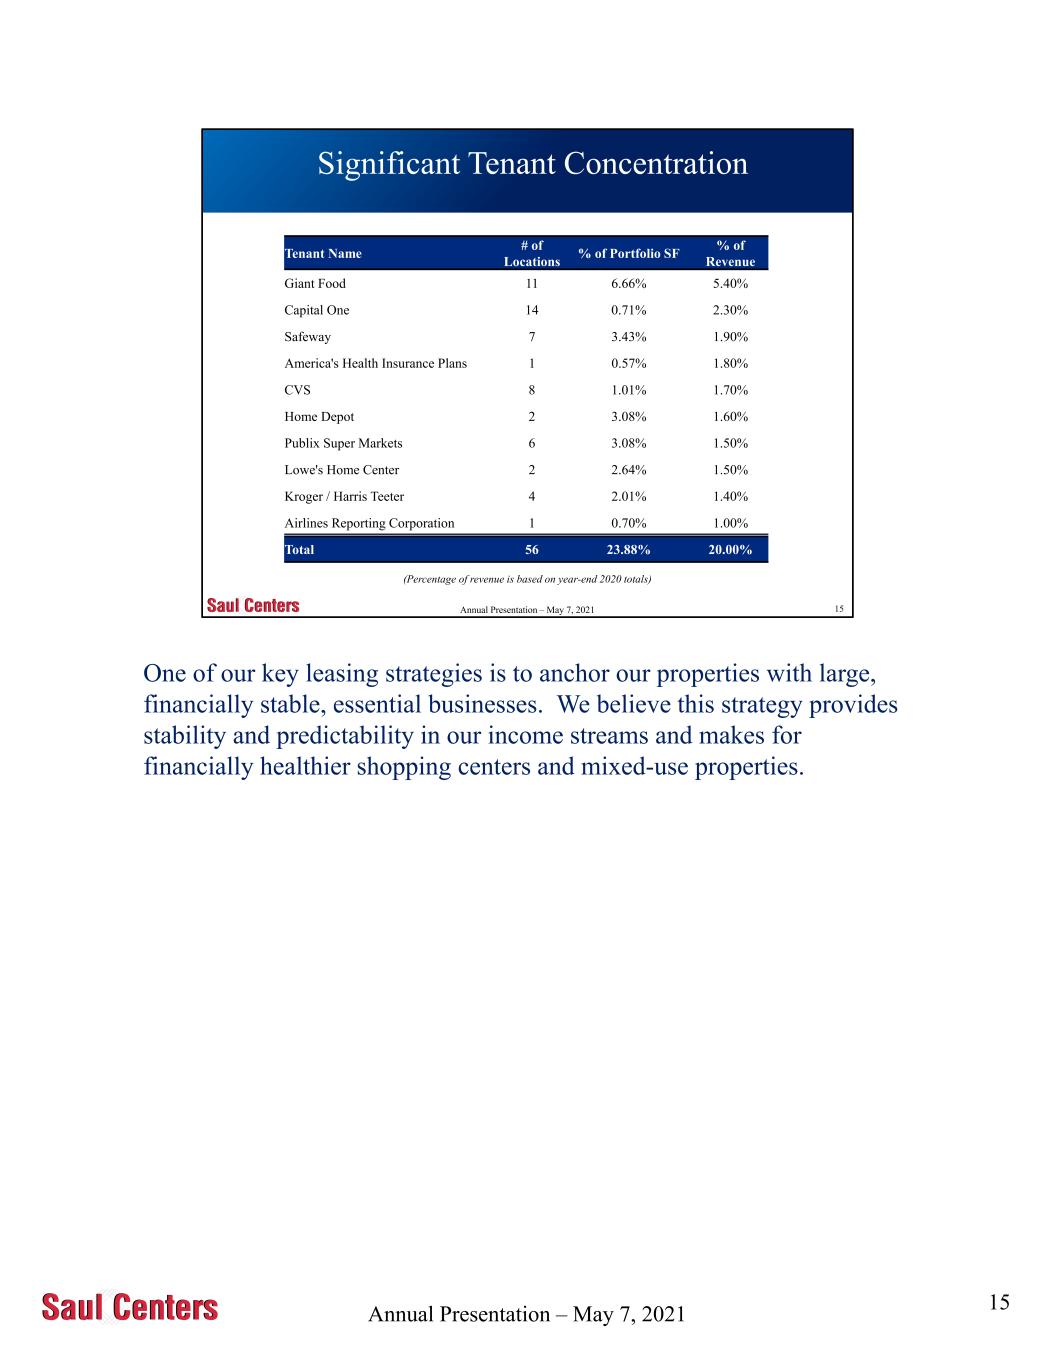
Annual Presentation – May 7, 2021 15 Significant Tenant Concentration 5/10/2021 Tenant Name # of Locations % of Portfolio SF % of Revenue Giant Food 11 6.66% 5.40% Capital One 14 0.71% 2.30% Safeway 7 3.43% 1.90% America's Health Insurance Plans 1 0.57% 1.80% CVS 8 1.01% 1.70% Home Depot 2 3.08% 1.60% Publix Super Markets 6 3.08% 1.50% Lowe's Home Center 2 2.64% 1.50% Kroger / Harris Teeter 4 2.01% 1.40% Airlines Reporting Corporation 1 0.70% 1.00% Total 56 23.88% 20.00% (Percentage of revenue is based on year-end 2020 totals) Annual Presentation – May 7, 2021 One of our key leasing strategies is to anchor our properties with large, financially stable, essential businesses. We believe this strategy provides stability and predictability in our income streams and makes for financially healthier shopping centers and mixed-use properties. 15
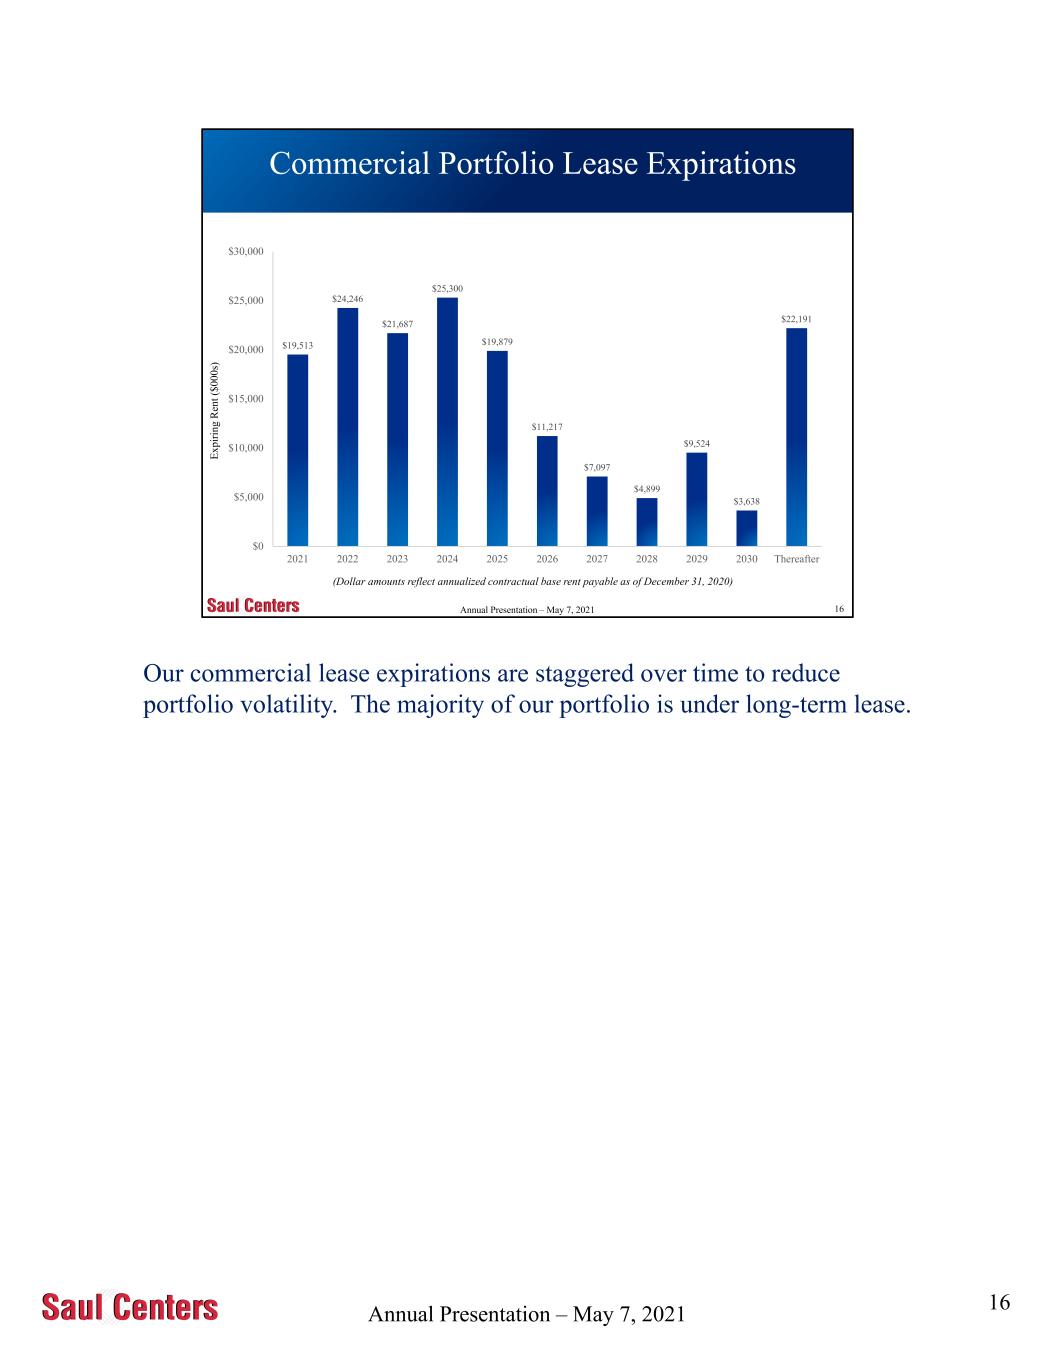
Annual Presentation – May 7, 2021 16 Commercial Portfolio Lease Expirations 5/10/2021 $19,513 $24,246 $21,687 $25,300 $19,879 $11,217 $7,097 $4,899 $9,524 $3,638 $22,191 $0 $5,000 $10,000 $15,000 $20,000 $25,000 $30,000 2021 2022 2023 2024 2025 2026 2027 2028 2029 2030 Thereafter E x p ir in g R en t ($ 0 0 0 s) (Dollar amounts reflect annualized contractual base rent payable as of December 31, 2020) Annual Presentation – May 7, 2021 Our commercial lease expirations are staggered over time to reduce portfolio volatility. The majority of our portfolio is under long-term lease. 16
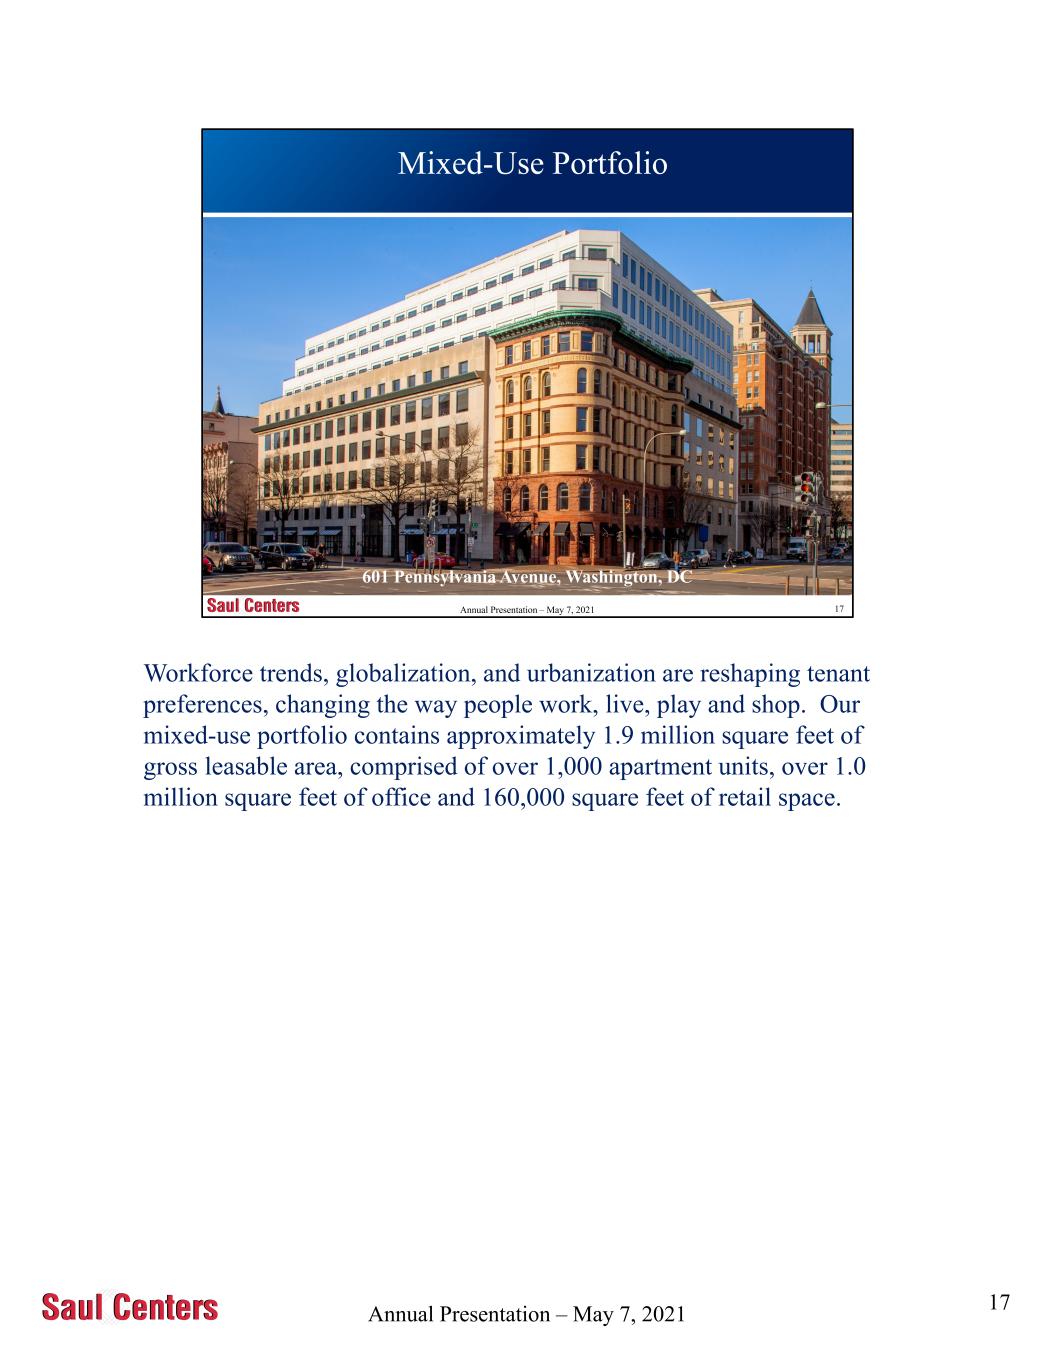
Annual Presentation – May 7, 2021 17 Mixed-Use Portfolio 5/10/2021 601 Pennsylvania Avenue, Washington, DC Annual Presentation – May 7, 2021 Workforce trends, globalization, and urbanization are reshaping tenant preferences, changing the way people work, live, play and shop. Our mixed-use portfolio contains approximately 1.9 million square feet of gross leasable area, comprised of over 1,000 apartment units, over 1.0 million square feet of office and 160,000 square feet of retail space. 17
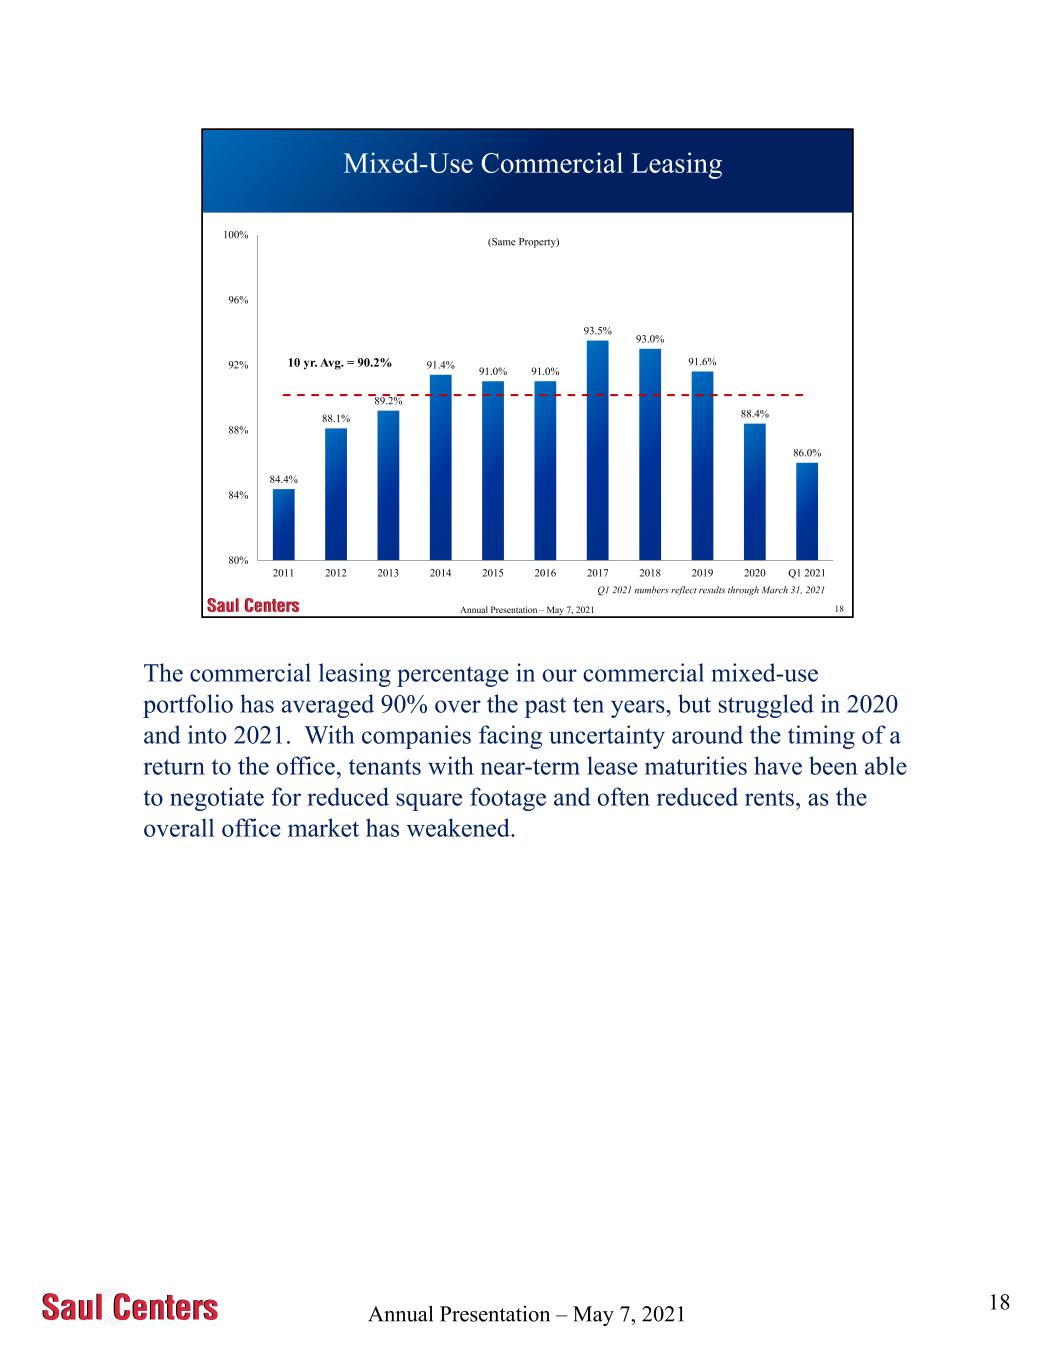
Annual Presentation – May 7, 2021 18 Mixed-Use Commercial Leasing 5/10/2021 10 yr. Avg. = 90.2% (Same Property) Q1 2021 numbers reflect results through March 31, 2021 84.4% 88.1% 89.2% 91.4% 91.0% 91.0% 93.5% 93.0% 91.6% 88.4% 86.0% 80% 84% 88% 92% 96% 100% 2011 2012 2013 2014 2015 2016 2017 2018 2019 2020 Q1 2021 Annual Presentation – May 7, 2021 The commercial leasing percentage in our commercial mixed-use portfolio has averaged 90% over the past ten years, but struggled in 2020 and into 2021. With companies facing uncertainty around the timing of a return to the office, tenants with near-term lease maturities have been able to negotiate for reduced square footage and often reduced rents, as the overall office market has weakened. 18
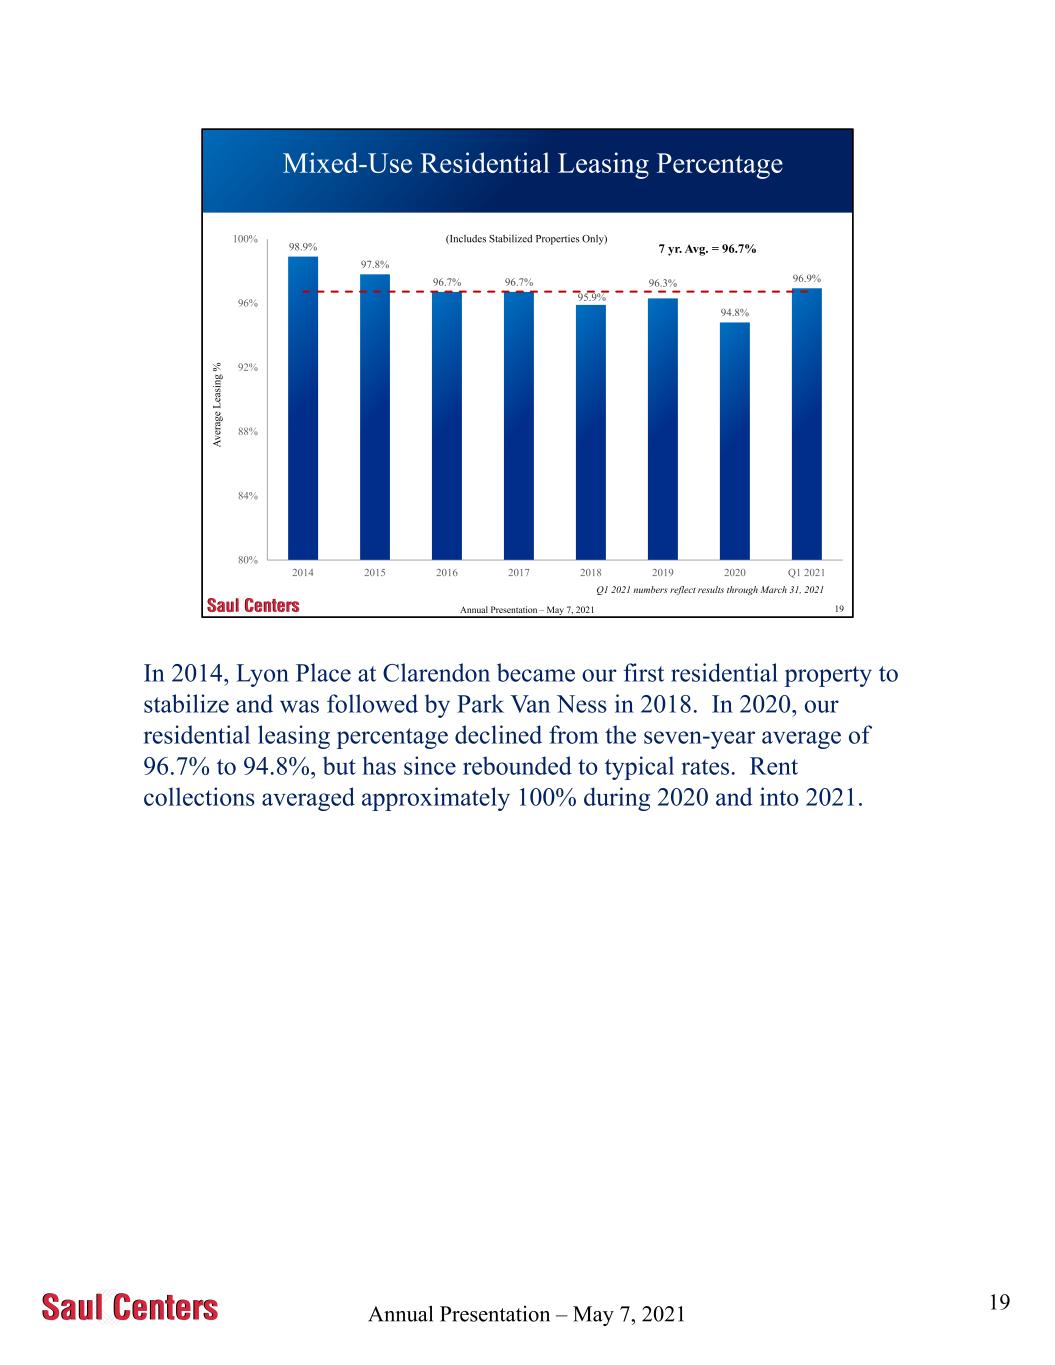
Annual Presentation – May 7, 2021 19 98.9% 97.8% 96.7% 96.7% 95.9% 96.3% 94.8% 96.9% 80% 84% 88% 92% 96% 100% 2014 2015 2016 2017 2018 2019 2020 Q1 2021 Mixed-Use Residential Leasing Percentage 5/10/2021 A v er ag e L ea si n g % 7 yr. Avg. = 96.7% (Includes Stabilized Properties Only) Q1 2021 numbers reflect results through March 31, 2021 Annual Presentation – May 7, 2021 In 2014, Lyon Place at Clarendon became our first residential property to stabilize and was followed by Park Van Ness in 2018. In 2020, our residential leasing percentage declined from the seven-year average of 96.7% to 94.8%, but has since rebounded to typical rates. Rent collections averaged approximately 100% during 2020 and into 2021. 19
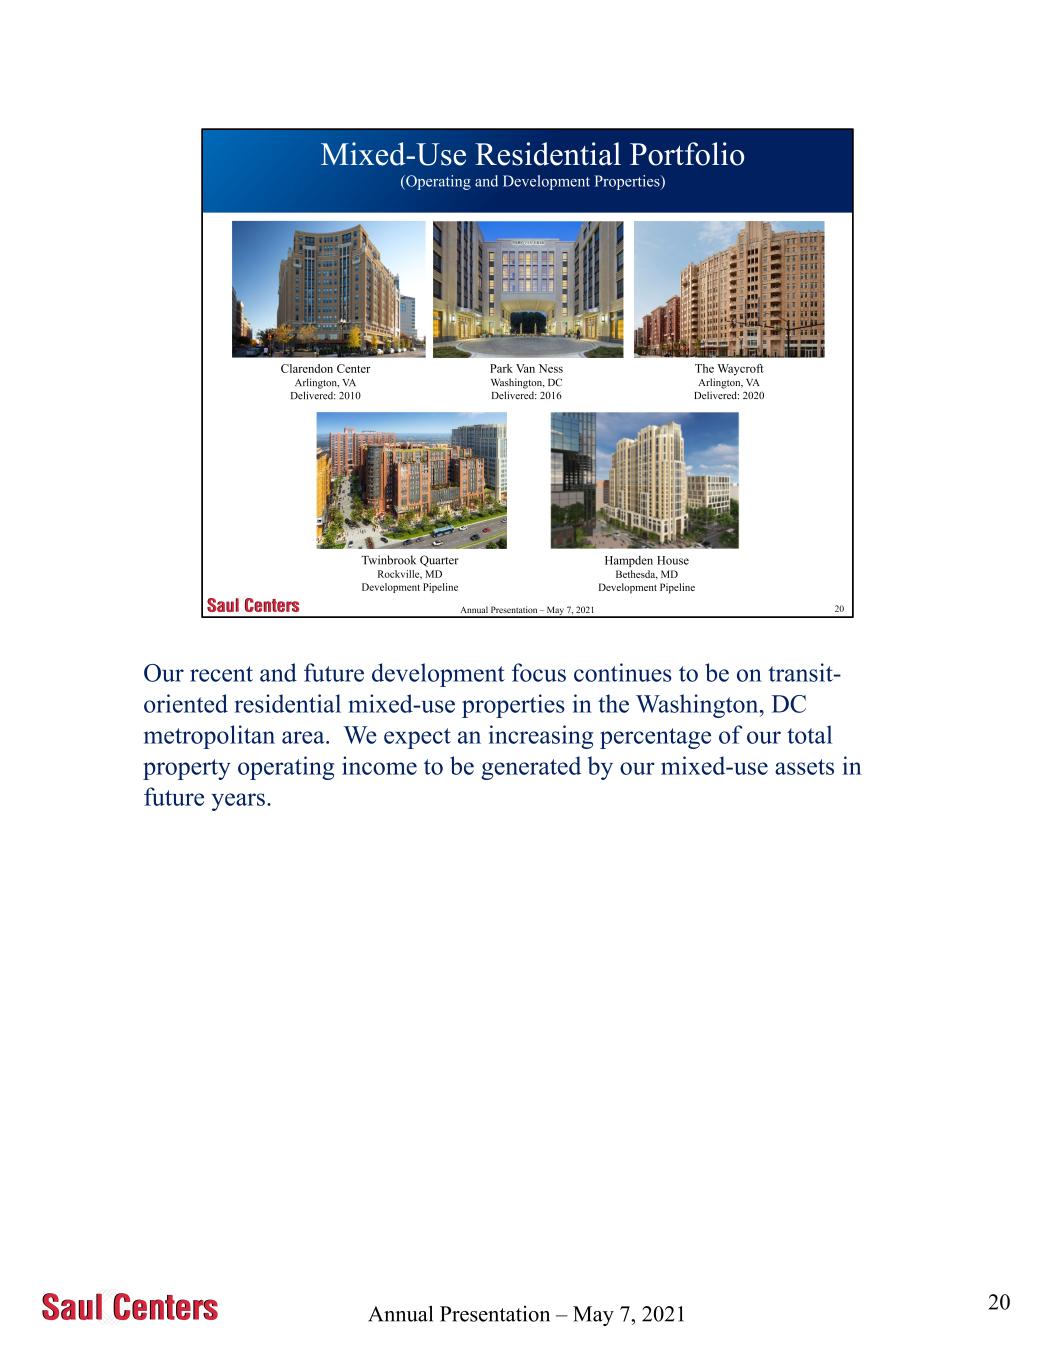
Annual Presentation – May 7, 2021 20 Mixed-Use Residential Portfolio (Operating and Development Properties) 5/10/2021 Hampden House Bethesda, MD Development Pipeline Twinbrook Quarter Rockville, MD Development Pipeline The Waycroft Arlington, VA Delivered: 2020 Park Van Ness Washington, DC Delivered: 2016 Clarendon Center Arlington, VA Delivered: 2010 Annual Presentation – May 7, 2021 Our recent and future development focus continues to be on transit- oriented residential mixed-use properties in the Washington, DC metropolitan area. We expect an increasing percentage of our total property operating income to be generated by our mixed-use assets in future years. 20
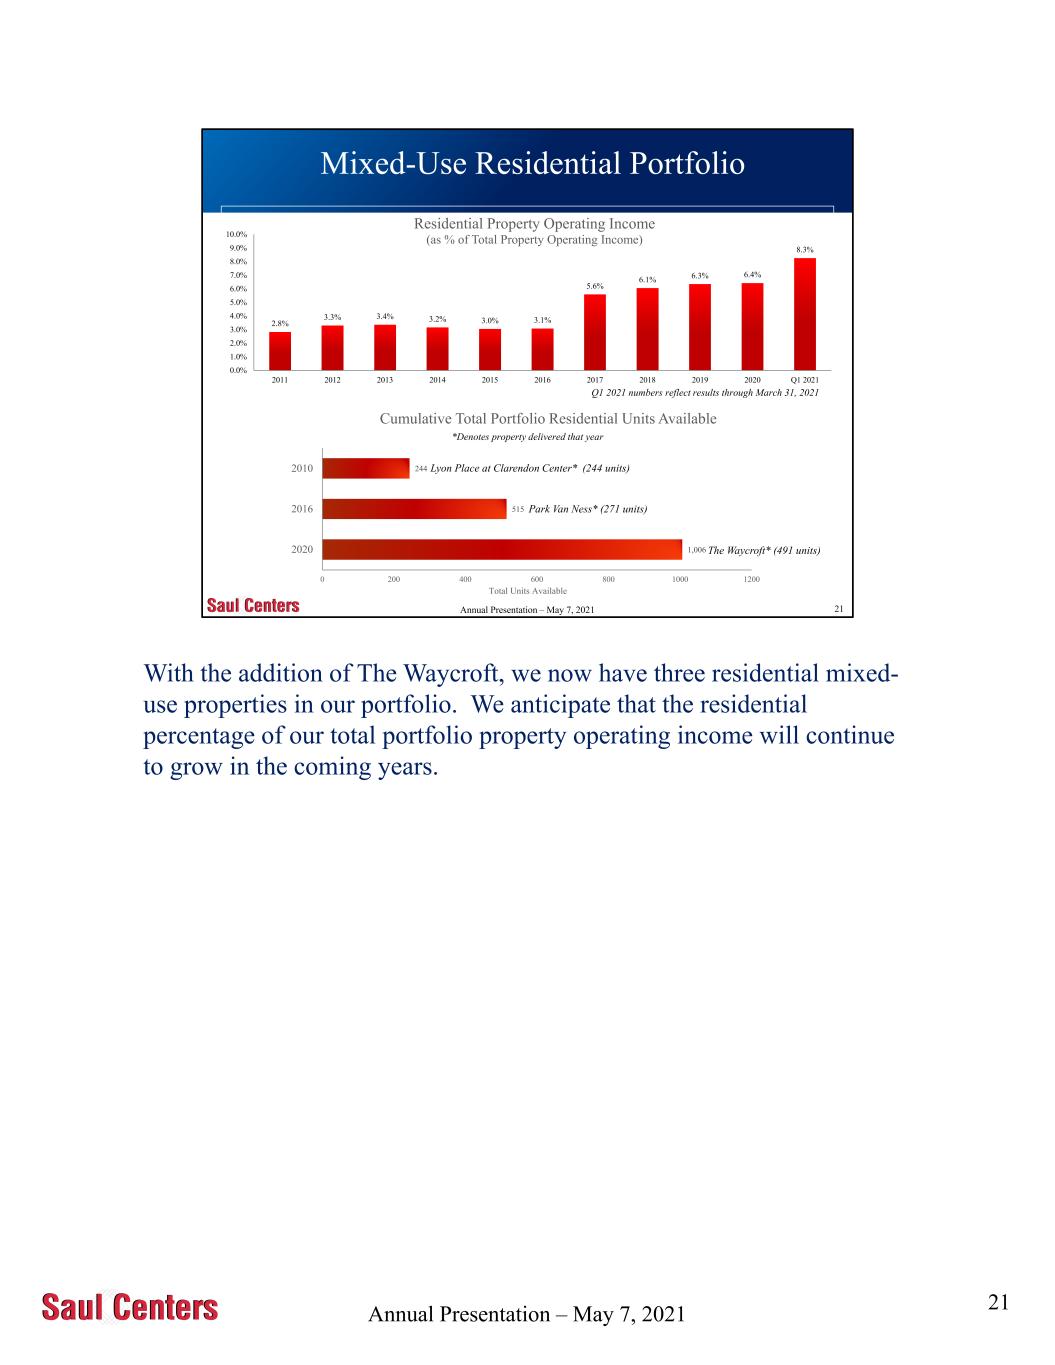
Annual Presentation – May 7, 2021 21 244 515 1,006 0 200 400 600 800 1000 1200 2010 2016 2020 Total Units Available Cumulative Total Portfolio Residential Units Available Lyon Place at Clarendon Center* (244 units) Park Van Ness* (271 units) The Waycroft* (491 units) Mixed-Use Residential Portfolio 5/10/2021 Q1 2021 numbers reflect results through March 31, 2021 *Denotes property delivered that year Annual Presentation – May 7, 2.8% 3.3% 3.4% 3.2% 3.0% 3.1% 5.6% 6.1% 6.3% 6.4% 8.3% 0.0% 1.0% 2.0% 3.0% 4.0% 5.0% 6.0% 7.0% 8.0% 9.0% 10.0% 2011 2012 2013 2014 2015 2016 2017 2018 2019 2020 Q1 2021 Residential Property Operating Income (as % of Total Property Operating Income) With the addition of The Waycroft, we now have three residential mixed- use properties in our portfolio. We anticipate that the residential percentage of our total portfolio property operating income will continue to grow in the coming years. 21
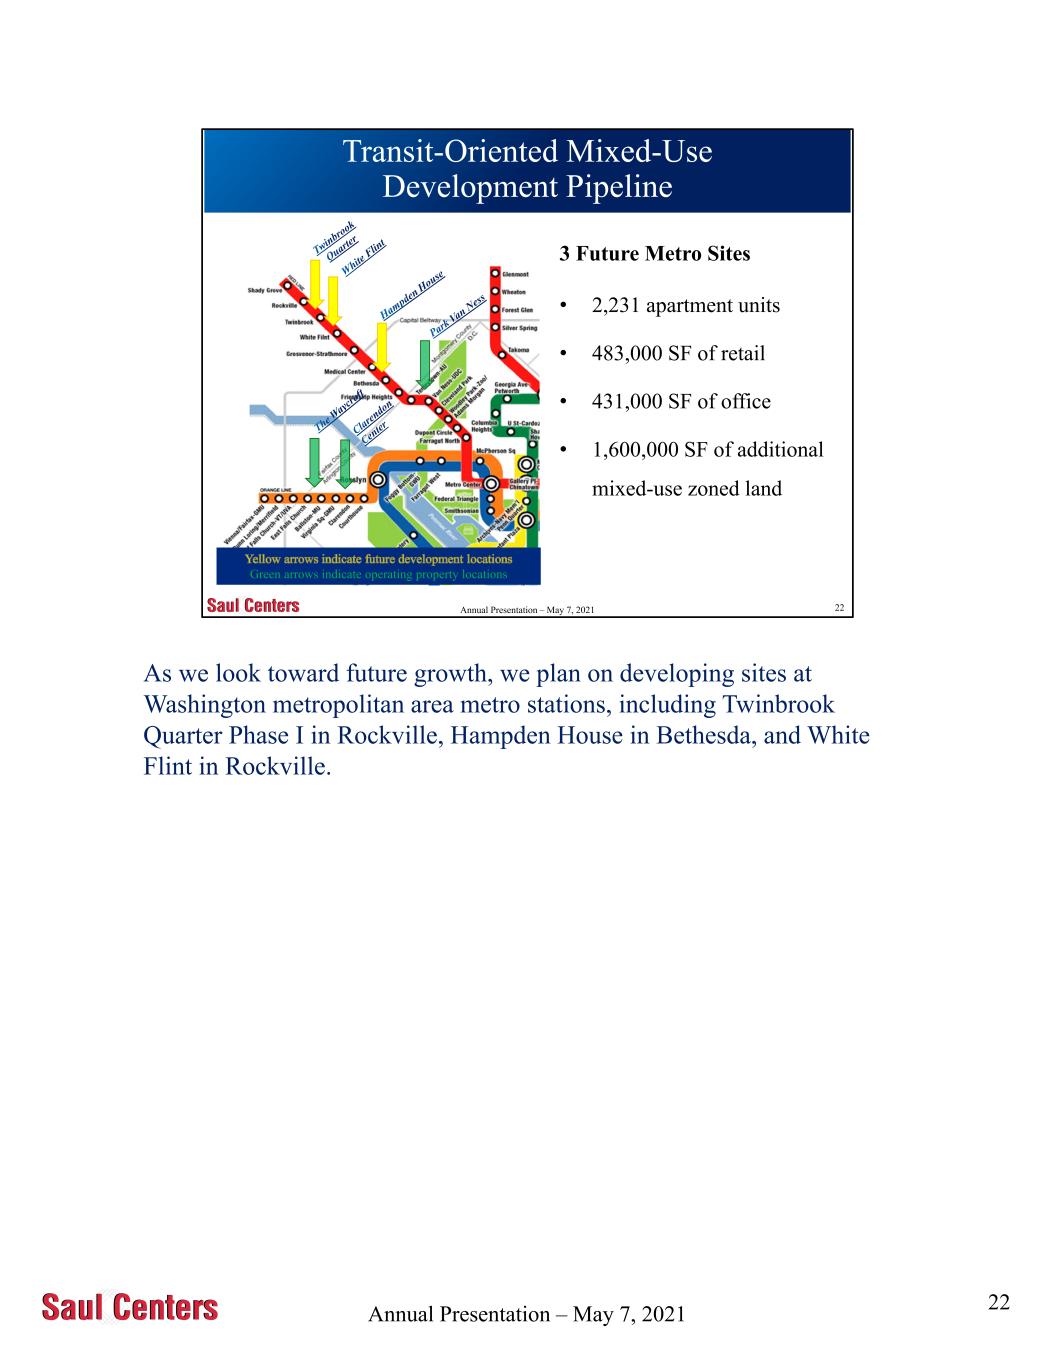
Annual Presentation – May 7, 2021 22 Transit-Oriented Mixed-Use Development Pipeline 3 Future Metro Sites • 2,231 apartment units • 483,000 SF of retail • 431,000 SF of office • 1,600,000 SF of additional mixed-use zoned land Green arrows indicate operating property locations Annual Presentation – May 7, 2021 As we look toward future growth, we plan on developing sites at Washington metropolitan area metro stations, including Twinbrook Quarter Phase I in Rockville, Hampden House in Bethesda, and White Flint in Rockville. 22
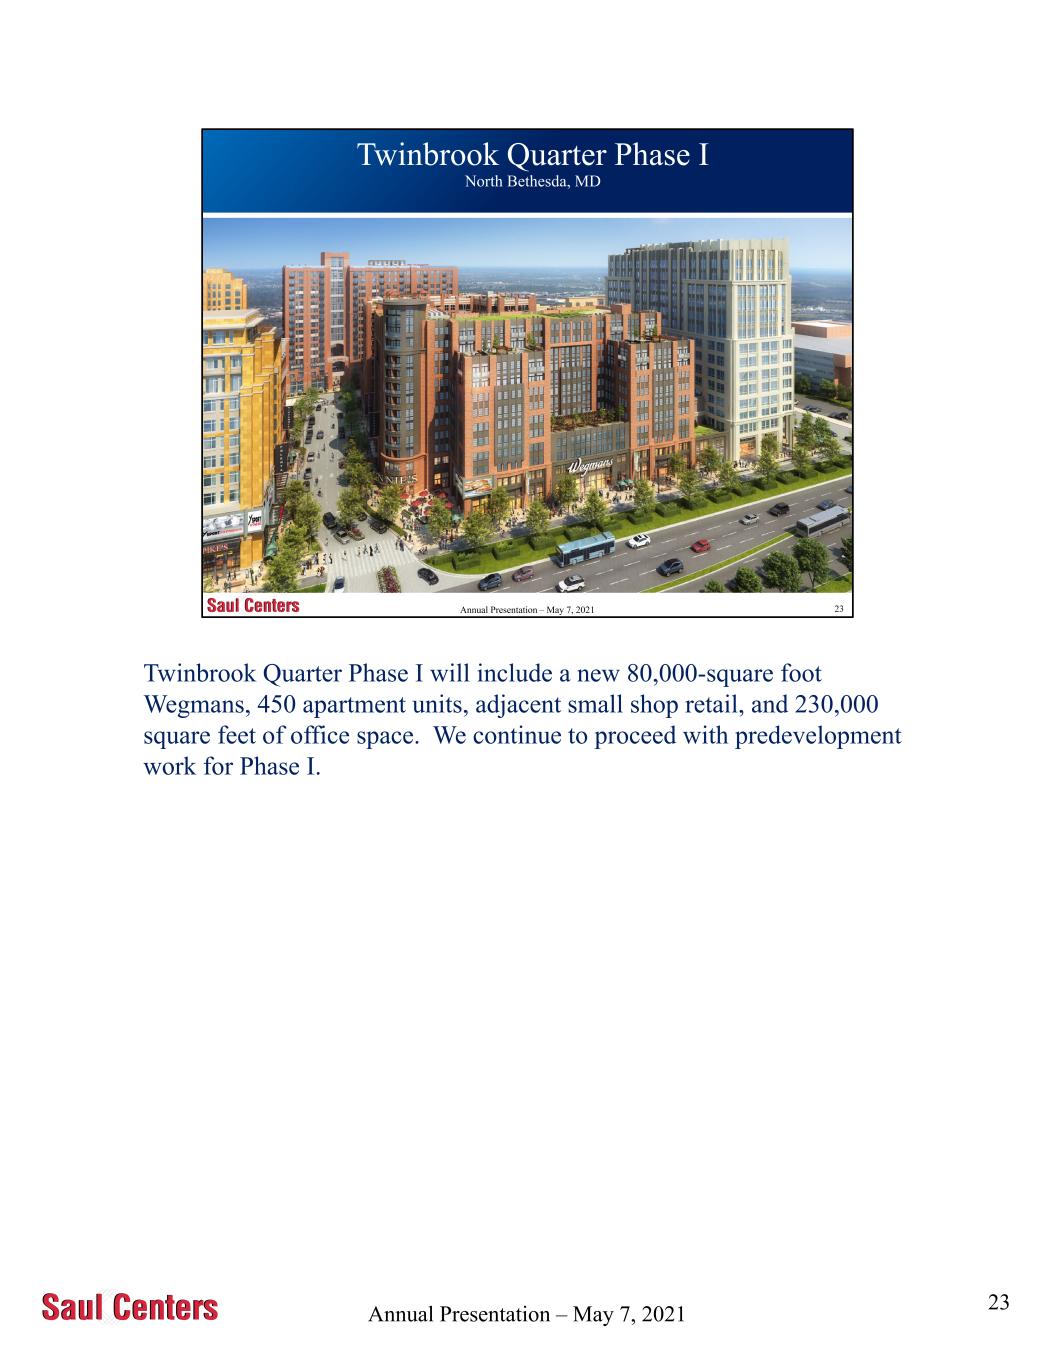
Annual Presentation – May 7, 2021 23 Twinbrook Quarter Phase I North Bethesda, MD 5/10/2021Annual Presentation – May 7, 2021 Twinbrook Quarter Phase I will include a new 80,000-square foot Wegmans, 450 apartment units, adjacent small shop retail, and 230,000 square feet of office space. We continue to proceed with predevelopment work for Phase I. 23
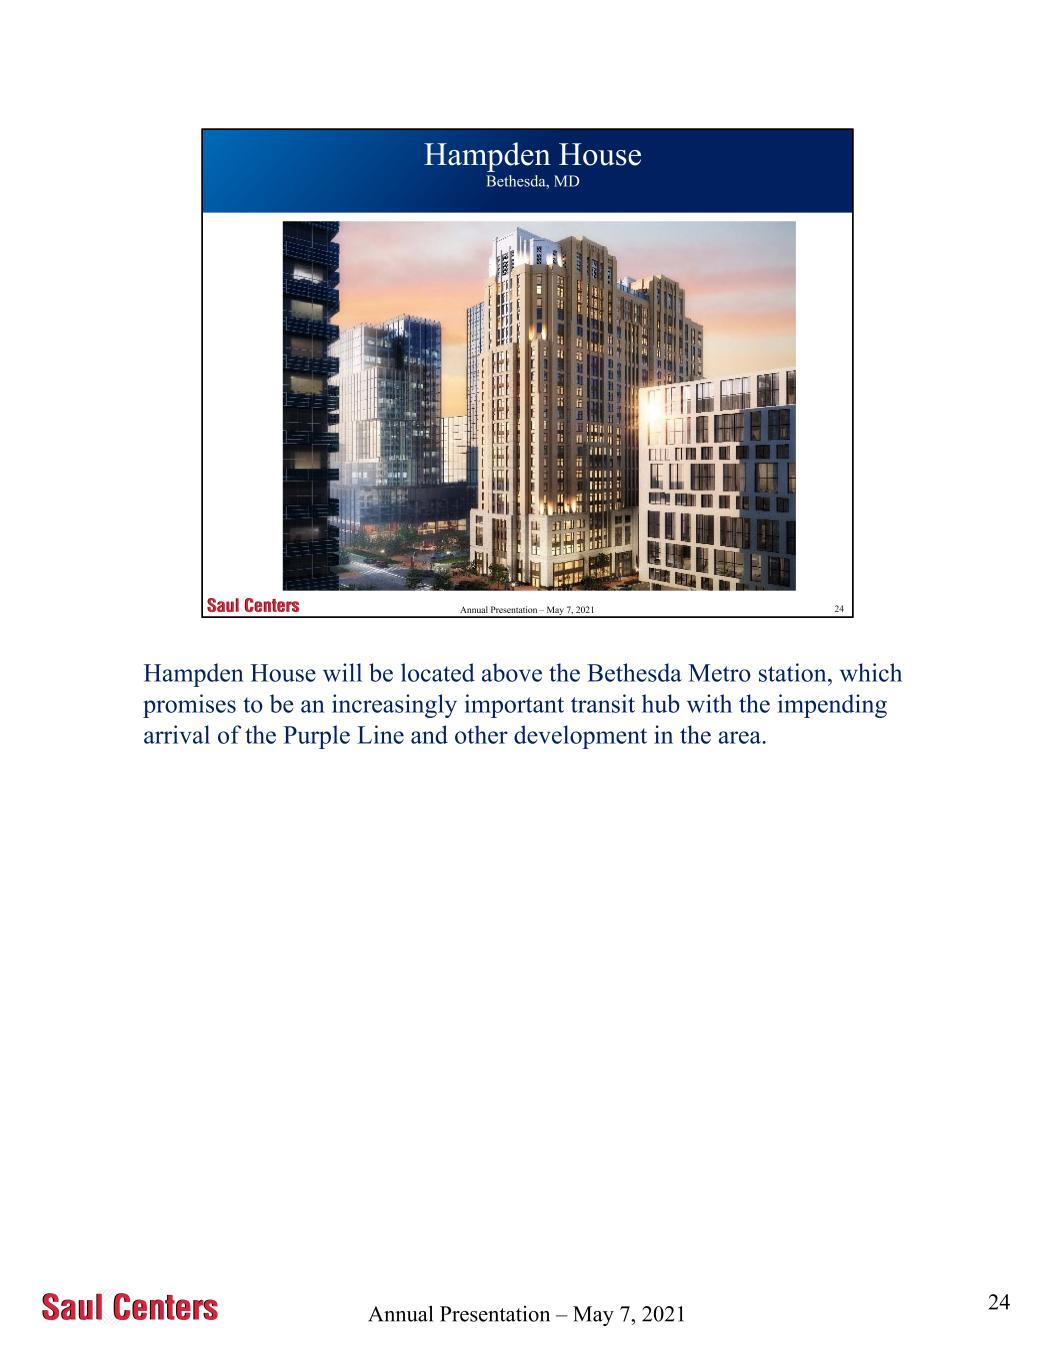
Annual Presentation – May 7, 2021 24 Rendering of proposed Glebe Road development Mixed-Use Development 750 N. Glebe Road Arlington, Virginia Hampden H use Bethesda, MD Annual Presentation – May 7, 2021 Hampden House will be located above the Bethesda Metro station, which promises to be an increasingly important transit hub with the impending arrival of the Purple Line and other development in the area. 24
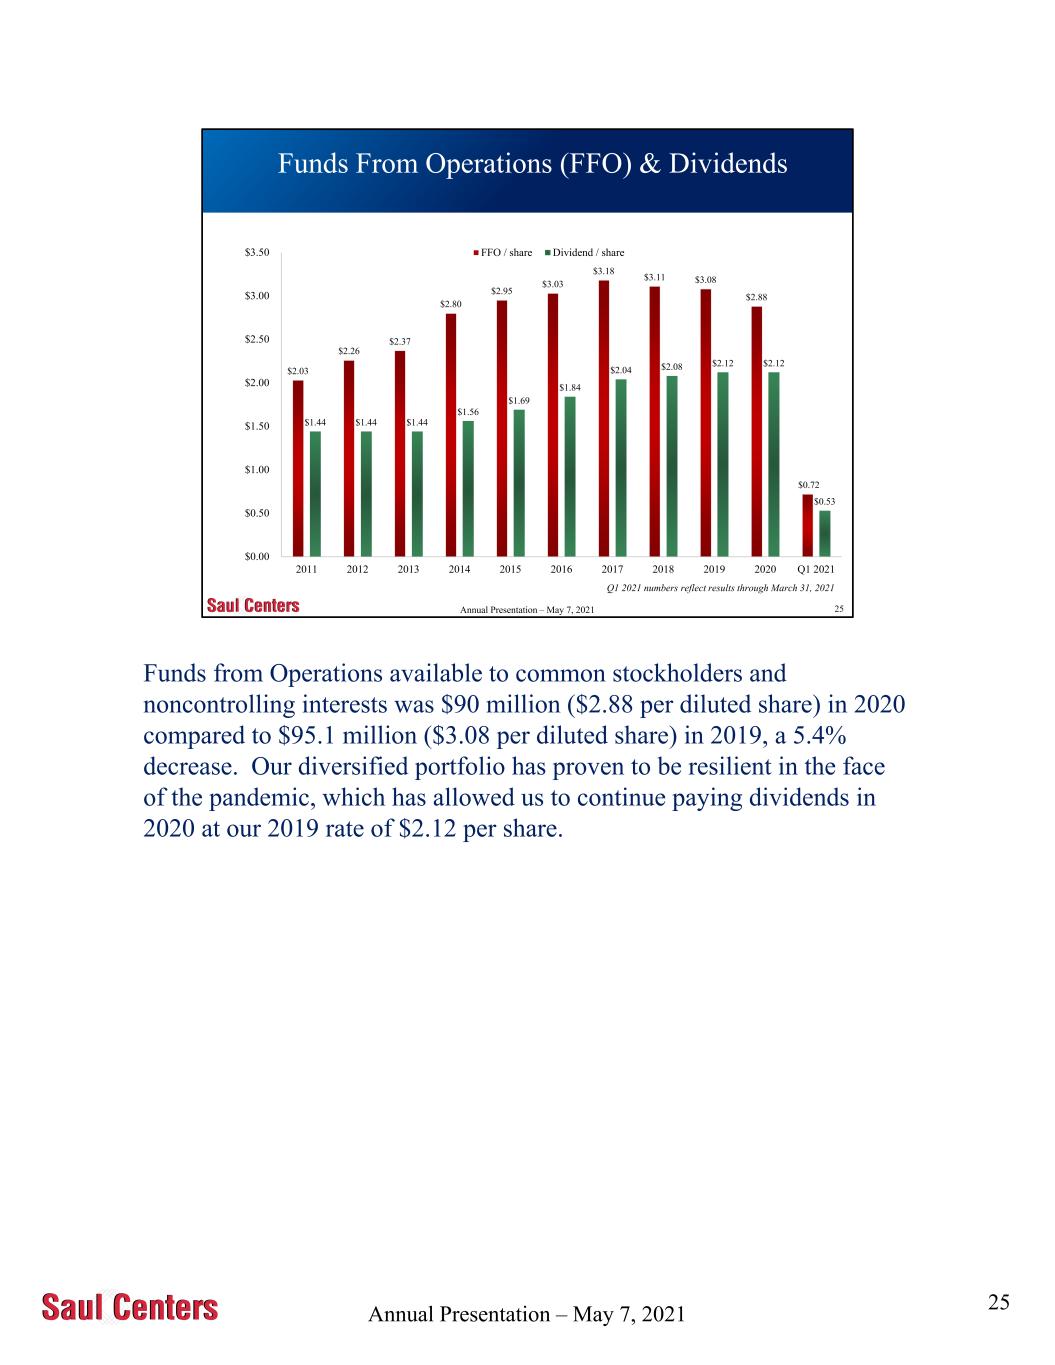
Annual Presentation – May 7, 2021 25 Funds From Operations (FFO) & Dividends $2.03 $2.26 $2.37 $2.80 $2.95 $3.03 $3.18 $3.11 $3.08 $2.88 $0.72 $1.44 $1.44 $1.44 $1.56 $1.69 $1.84 $2.04 $2.08 $2.12 $2.12 $0.53 $0.00 $0.50 $1.00 $1.50 $2.00 $2.50 $3.00 $3.50 2011 2012 2013 2014 2015 2016 2017 2018 2019 2020 Q1 2021 FFO / share Dividend / share Q1 2021 numbers reflect results through March 31, 2021 Annual Presentation – May 7, 2021 Funds from Operations available to common stockholders and noncontrolling interests was $90 million ($2.88 per diluted share) in 2020 compared to $95.1 million ($3.08 per diluted share) in 2019, a 5.4% decrease. Our diversified portfolio has proven to be resilient in the face of the pandemic, which has allowed us to continue paying dividends in 2020 at our 2019 rate of $2.12 per share. 25
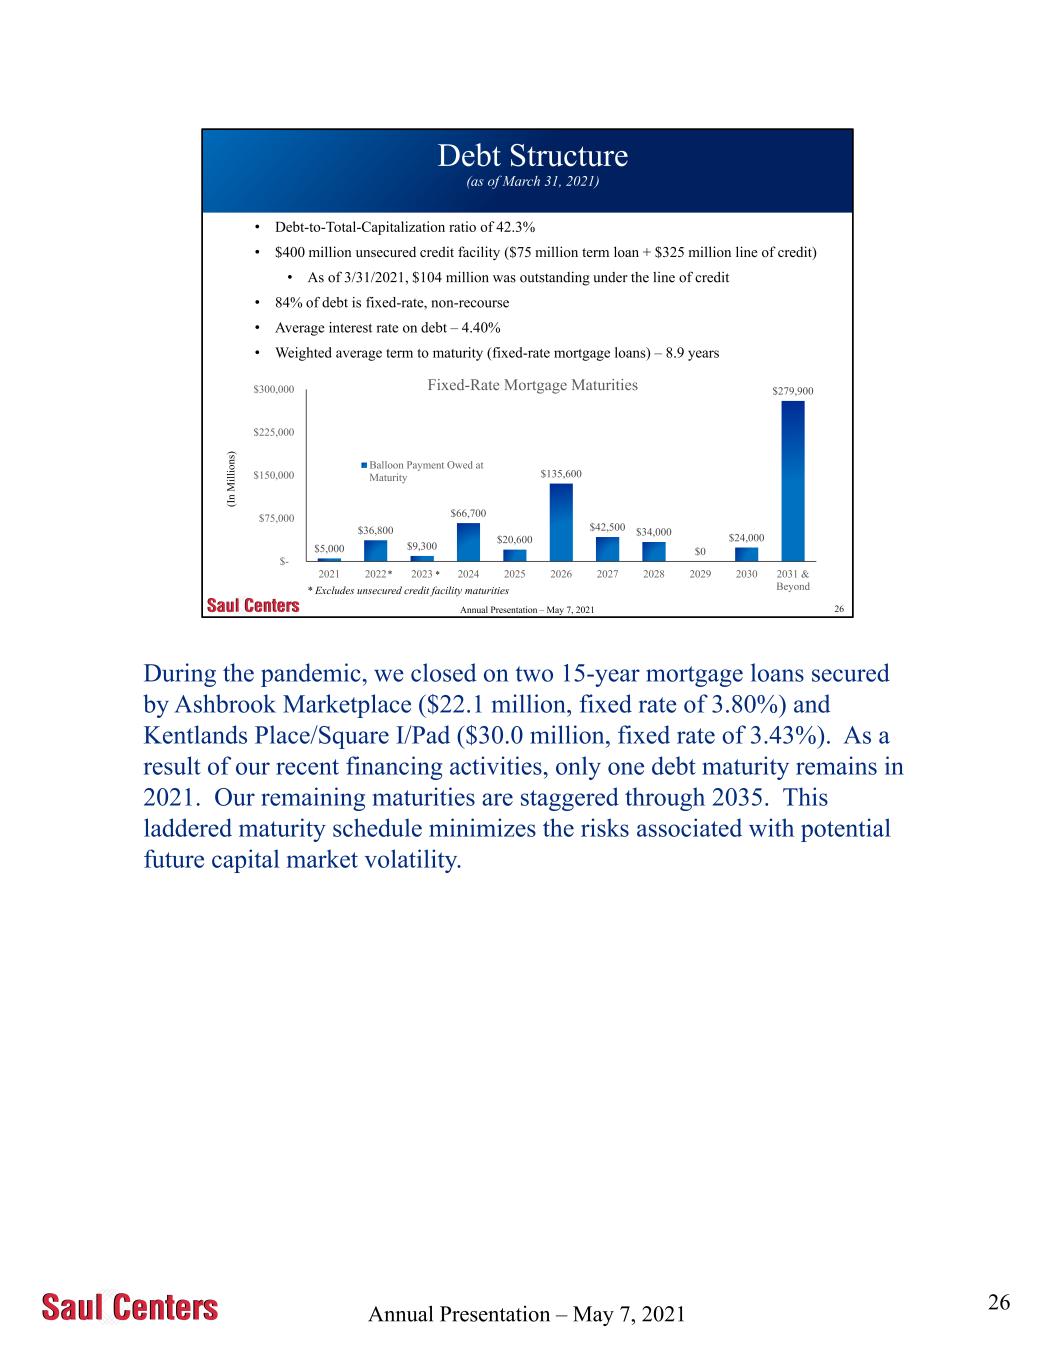
Annual Presentation – May 7, 2021 26 Debt Structure (as of March 31, 2021) 5/10/2021 (I n M il li o n s) $5,000 $36,800 $9,300 $66,700 $20,600 $135,600 $42,500 $34,000 $0 $24,000 $279,900 $- $75,000 $150,000 $225,000 $300,000 2021 2022 2023 2024 2025 2026 2027 2028 2029 2030 2031 & Beyond Fixed-Rate Mortgage Maturities Balloon Payment Owed at Maturity • Debt-to-Total-Capitalization ratio of 42.3% • $400 million unsecured credit facility ($75 million term loan + $325 million line of credit) • As of 3/31/2021, $104 million was outstanding under the line of credit • 84% of debt is fixed-rate, non-recourse • Average interest rate on debt – 4.40% • Weighted average term to maturity (fixed-rate mortgage loans) – 8.9 years ** * Excludes unsecured credit facility maturities Annual Presentation – May 7, 2021 During the pandemic, we closed on two 15-year mortgage loans secured by Ashbrook Marketplace ($22.1 million, fixed rate of 3.80%) and Kentlands Place/Square I/Pad ($30.0 million, fixed rate of 3.43%). As a result of our recent financing activities, only one debt maturity remains in 2021. Our remaining maturities are staggered through 2035. This laddered maturity schedule minimizes the risks associated with potential future capital market volatility. 26
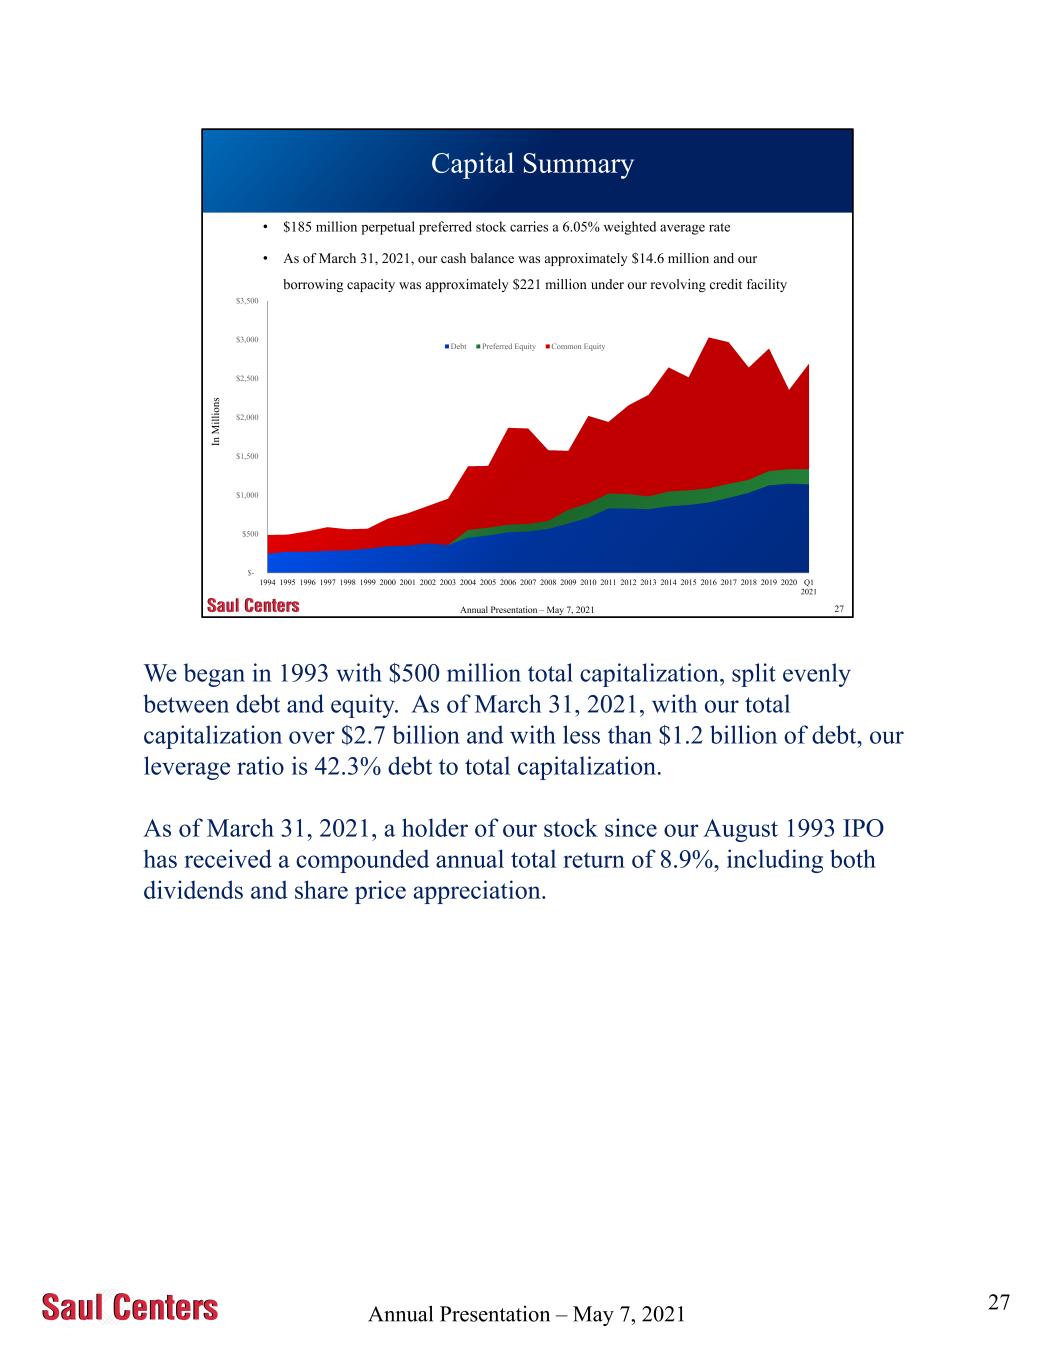
Annual Presentation – May 7, 2021 27 Capital Summary 5/10/2021 In M il li o n s • $185 million perpetual preferred stock carries a 6.05% weighted average rate • As of March 31, 2021, our cash balance was approximately $14.6 million and our borrowing capacity was approximately $221 million under our revolving credit facility $- $500 $1,000 $1,500 $2,000 $2,500 $3,000 $3,500 1994 1995 1996 1997 1998 1999 2000 2001 2002 2003 2004 2005 2006 2007 2008 2009 2010 2011 2012 2013 2014 2015 2016 2017 2018 2019 2020 Q1 2021 Debt Preferred Equity Common Equity Annual Presentation – May 7, 2021 We began in 1993 with $500 million total capitalization, split evenly between debt and equity. As of March 31, 2021, with our total capitalization over $2.7 billion and with less than $1.2 billion of debt, our leverage ratio is 42.3% debt to total capitalization. As of March 31, 2021, a holder of our stock since our August 1993 IPO has received a compounded annual total return of 8.9%, including both dividends and share price appreciation. 27
