Attached files
| file | filename |
|---|---|
| 8-K - FORM 8-K - INNOVATIVE INDUSTRIAL PROPERTIES INC | tm2115663d1_8k.htm |
Exhibit 99.1
INNOVATIVE INDUSTRIAL PROPERTIES Investor Presentation NYSE: IIPR www.innovativeindustrialproperties.com Posted May 10, 2021 1
Forward - Looking Statements 2 This presentation and our associated comments include "forward - looking statements" (within the meaning of the Private Securities Litigation Reform Act of 1995, Section 27A of the Securities Act of 1933, as amended, and Section 21E of the Securities Exchange Act of 1934, as amended) that are subject to risks and uncertainties. In particular, s tat ements pertaining to our capital resources, portfolio performance and results of operations contain forward - looking statements. Likewise, our statements regarding anticipated growth in our funds from operations and anticipated m arket and regulatory conditions, our strategic direction, our dividend rate and policy, demographics, results of operations, plans and objectives are forward - looking statements. Forward - looking statements involve num erous risks and uncertainties, and you should not rely on them as predictions of future events. Forward - looking statements depend on assumptions, data or methods which may be incorrect or imprecise, and we may not be able to realize them. We do not guarantee that the transactions and events described will happen as described (or that they will happen at all). You can identify forward - looking statements by the use of forward - lo oking terminology such as "believes," "expects," "may," "will," "should," "seeks," "approximately," "intends," "plans," "estimates" or "anticipates" or the negative of these words and phrases or similar words or phrases. You can also identify forward - looking statements by discussions of strategy, plans or intentions. The following factors, among others, could cause actual results and future events to differ materially from those set forth or co nte mplated in the forward - looking statements: the impact of the COVID - 19 pandemic, or future pandemics, on us, our business, our tenants, or the economy generally; our business and investment strategy; our projected op era ting results; actions and initiatives of the U.S. or state governments and changes to government policies and the execution and impact of these actions, initiatives and policies, including the fact that cannabis re mains illegal under federal law; rates of default on leases for our assets; availability of suitable investment opportunities in the regulated cannabis industry; our understanding of our competition and our potential tenants' alt ernative financing sources; the demand for regulated cannabis cultivation and processing facilities; concentration of our portfolio of assets and limited number of tenants; the estimated growth in and evolving mark et dynamics of the regulated cannabis market; the expected medical - use or adult - use cannabis legalization in certain states; shifts in public opinion regarding medical - use cannabis; the additional risks that may be associ ated with certain of our tenants cultivating adult - use cannabis in our cultivation facilities; the state of the U.S. economy generally or in specific geographic areas; economic trends and economic recoveries; our ability to access eq uit y or debt capital; financing rates for our assets; our expected leverage; changes in the values of our assets; our portfolio of assets; our expected investments; interest rate mismatches between our assets and our borrowings us ed to fund such investments; changes in interest rates and the market value of our assets; the degree to which any interest rate or other hedging strategies may or may not protect us from interest rate volatility; the im pac t of and changes in governmental regulations, tax law and rates, accounting guidance and similar matters; our ability to maintain our qualification as a real estate investment trust for U.S. federal income tax purposes; ou r a bility to maintain our exemption from registration under the Investment Company Act of 1940; availability of qualified personnel; and market trends in our industry, interest rates, real estate values, the securities ma rke ts or the general economy. The risks included here are not exhaustive, and additional factors could adversely affect our business and financial performa nce . In addition, we discussed a number of material risks in our Annual Report on Form 10 - K for the year ended December 31, 2020, as updated in our Quarterly Report on Form 10 - Q for the quarter ended March 31, 2021. Those risks cont inue to be relevant to our performance and financial condition. Moreover, we operate in a very competitive and rapidly changing environment. New risk factors emerge from time to time and it is not possible for man agement to predict all such risk factors, nor can it assess the impact of all such risk factors on our business or the extent to which any factor, or combination of factors, may cause actual results to differ materially from th ose contained in any forward - looking statements. Any forward - looking statement made by us speaks only of the date on which we make it. We undertake no obligation to publicly update or revise any forward - looking stateme nts, whether as a result of new information, future events or otherwise, except as may be required by law. Stockholders and investors are cautioned not to unduly rely on such forward - looking statements when evaluating the information presented in our filings and reports. Market and industry data are included in this presentation. We have obtained substantially all of this information from inter nal studies, public filings, other independent published industry sources and market studies prepared by third parties. We believe these internal studies, public filings, other independent published industry sources and market stu dies prepared by third parties are reliable. However, this information may prove to be inaccurate. No representation or warranty is made as to the accuracy of such information.
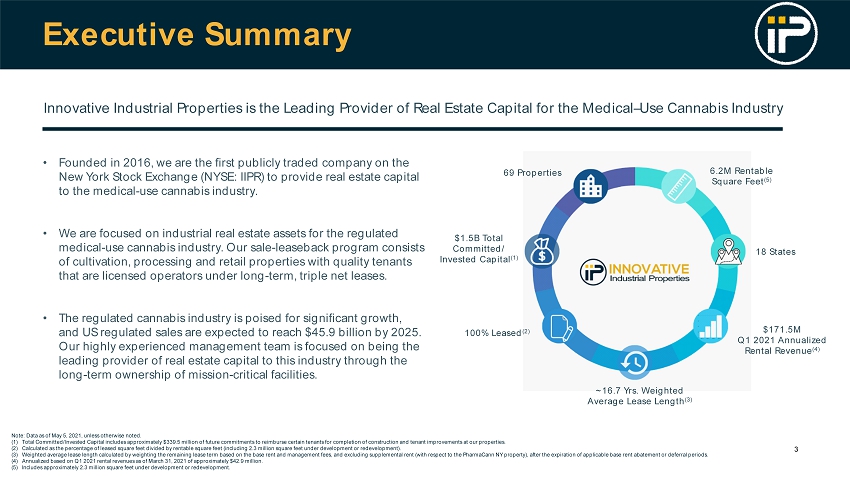
Executive Summary 3 • Founded in 2016, we are the first publicly traded company on the New York Stock Exchange (NYSE: IIPR) to provide real estate capital to the medical - use cannabis industry. • We are focused on industrial real estate assets for the regulated medical - use cannabis industry. Our sale - leaseback program consists of cultivation, processing and retail properties with quality tenants that are licensed operators under long - term, triple net leases. • The regulated cannabis industry is poised for significant growth, and US regulated sales are expected to reach $45.9 billion by 2025. Our highly experienced management team is focused on being the leading provider of real estate capital to this industry through the long - term ownership of mission - critical facilities. Innovative Industrial Properties is the Leading Provider of Real Estate Capital for the Medical – Use Cannabis Industry $1.5B Total Committed/ Invested Capital (1) $171.5M Q1 2021 Annualized Rental Revenue (4) ~16.7 Yrs. Weighted Average Lease Length (3) 69 Properties 100% Leased (2) 6.2M Rentable Square Feet (5) 18 States Note : Data as of May 5 , 2021 , unless otherwise noted . (1) Total Committed/Invested Capital includes approximately $ 339 . 5 million of future commitments to reimburse certain tenants for completion of construction and tenant improvements at our properties . (2) Calculated as the percentage of leased square feet divided by rentable square feet (including 2 . 3 million square feet under development or redevelopment) . (3) Weighted average lease length calculated by weighting the remaining lease term based on the base rent and management fees, and excluding supplemental rent (with respect to the PharmaCann NY property), after the expiration of applicable base rent abatement or deferral periods . (4) Annualized based on Q 1 2021 rental revenues as of March 31 , 2021 of approximately $ 42 . 9 million . (5) Includes approximately 2 . 3 million square feet under development or redevelopment .
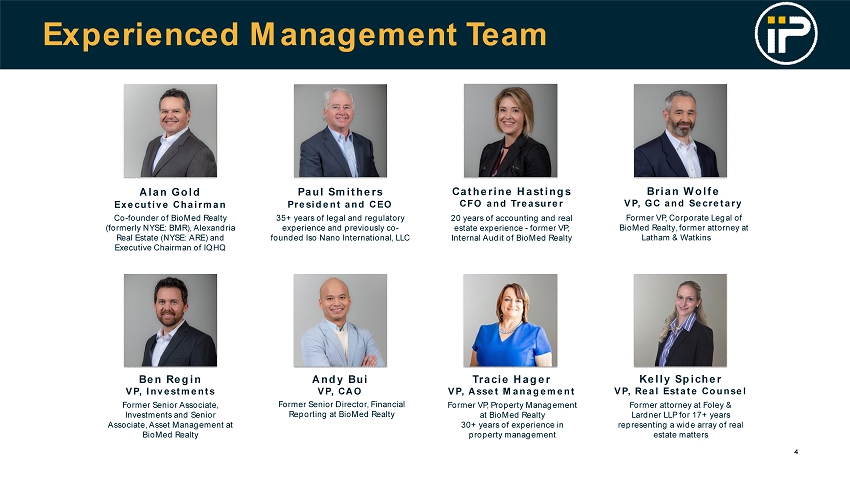
Experienced Management Team 4 Alan Gold Executive Chairman Co - founder of BioMed Realty (formerly NYSE: BMR), Alexandria Real Estate (NYSE: ARE) and Executive Chairman of IQHQ Paul Smithers President and CEO 35+ years of legal and regulatory experience and previously co - founded Iso Nano International, LLC Catherine Hastings CFO and Treasurer 20 years of accounting and real estate experience - former VP, Internal Audit of BioMed Realty Brian Wolfe VP, GC and Secretary Former VP, Corporate Legal of BioMed Realty, former attorney at Latham & Watkins LLP Tracie Hager VP, Asset Management Former VP, Property Management at BioMed Realty 30+ years of experience in property management Kelly Spicher VP, Real Estate Counsel Former attorney at Foley & Lardner LLP for 17+ years representing a wide array of real estate matters Andy Bui VP, CAO Former Senior Director, Financial Reporting at BioMed Realty Ben Regin VP, Investments Former Senior Associate, Investments and Senior Associate, Asset Management at BioMed Realty

Our Independent Board Members 5 Gary Kreitzer Vice Chairman Co - founder of BioMed Realty (formerly NYSE: BMR), Alexandria Real Estate (NYSE: ARE) and board member of IQHQ 35+ years of commercial real estate and public company REIT experience Mary Allis Curran Director Former senior executive at MUFG Union Bank, current board member of Banc of California (NYSE:BANC) Expertise in public company management, finance and risk management Scott Shoemaker, MD Director Practicing orthopedic surgeon specializing in pediatrics and trauma Extensive medical expertise David Stecher Director Managing Director at CapAcuity LLC, an investment advisor for executive benefits design and implementation Expertise in finance, accounting, and employee compensation and benefits
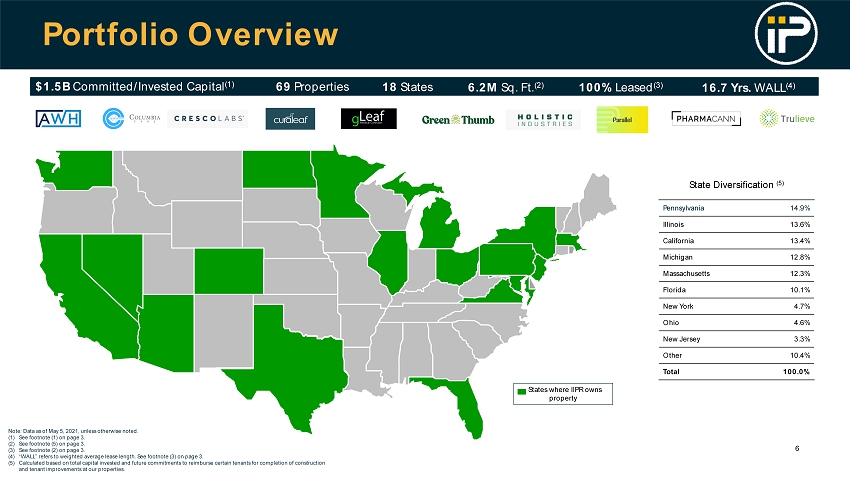
Portfolio Overview 6 69 Properties 18 States 6.2M Sq. Ft. (2) State Diversification (5) $1.5B Committed/Invested Capital (1) 100% Leased (3) 16.7 Yrs. WALL (4) Pennsylvania 14.9% Illinois 13.6% California 13.4% Michigan 12.8% Massachusetts 12.3% Florida 10.1% New York 4.7% Ohio 4.6% New Jersey 3.3% Other 10.4% Total 100.0% Note: Data as of May 5, 2021, unless otherwise noted. (1) See footnote (1) on page 3. (2) See footnote (5) on page 3. (3) See footnote (2) on page 3. (4) “WALL” refers to weighted average lease length. See footnote (3) on page 3. (5) Calculated based on total capital invested and future commitments to reimburse certain tenants for completion of construction and tenant improvements at our properties. States where IIPR owns property
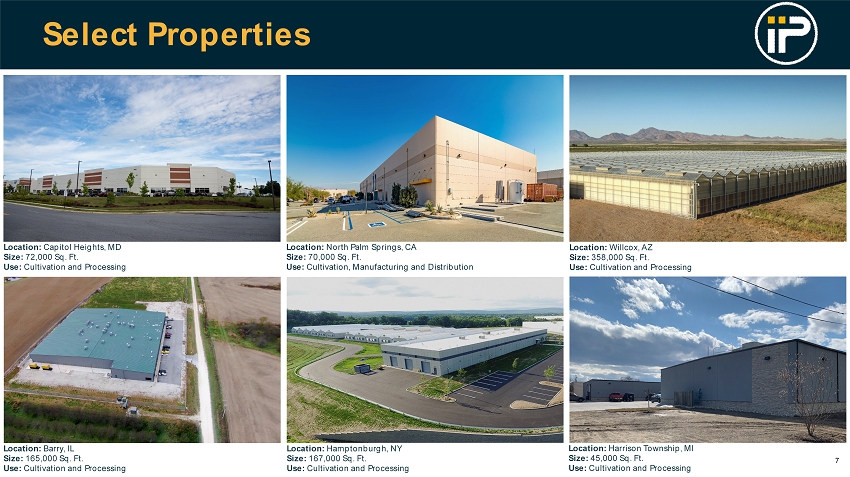
Select Properties 7 Location: Capitol Heights, MD Size: 72,000 Sq. Ft. Use: Cultivation and Processing Location: Barry, IL Size: 165,000 Sq. Ft. Use: Cultivation and Processing Location: Hamptonburgh, NY Size: 167,000 Sq. Ft. Use: Cultivation and Processing Location: Harrison Township, MI Size: 45,000 Sq. Ft. Use: Cultivation and Processing Location: North Palm Springs, CA Size: 70,000 Sq. Ft. Use: Cultivation, Manufacturing and Distribution Location: Willcox, AZ Size: 358,000 Sq. Ft. Use: Cultivation and Processing
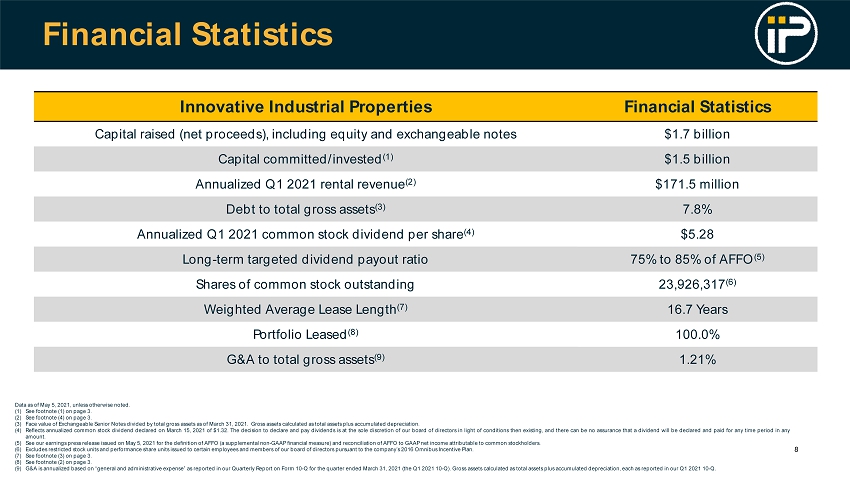
Innovative Industrial Properties Financial Statistics Capital raised (net proceeds), including equity and exchangeable notes $1.7 billion Capital committed/invested (1) $1.5 billion Annualized Q1 2021 rental revenue (2) $171.5 million Debt to total gross assets (3) 7.8% Annualized Q1 2021 common stock dividend per share (4) $5.28 Long - term targeted dividend payout ratio 75% to 85% of AFFO (5) Shares of common stock outstanding 23,926,317 (6) Weighted Average Lease Length (7) 16.7 Years Portfolio Leased (8) 100.0% G&A to total gross assets (9) 1.21% Data as of May 5 , 2021 , unless otherwise noted . (1) See footnote ( 1 ) on page 3 . (2) See footnote ( 4 ) on page 3 . (3) Face value of Exchangeable Senior Notes divided by total gross assets as of March 31 , 2021 . Gross assets calculated as total assets plus accumulated depreciation . (4) Reflects annualized common stock dividend declared on March 15 , 2021 of $ 1 . 32 . The decision to declare and pay dividends is at the sole discretion of our board of directors in light of conditions then existing, and there can be no assurance that a dividend will be declared and paid for any time period in any amount . (5) See our earnings press release issued on May 5 , 2021 for the definition of AFFO (a supplemental non - GAAP financial measure) and reconciliation of AFFO to GAAP net income attributable to common stockholders . (6) Excludes restricted stock units and performance share units issued to certain employees and members of our board of directors pursuant to the company’s 2016 Omnibus Incentive Plan . (7) See footnote ( 3 ) on page 3 . (8) See footnote ( 2 ) on page 3 . (9) G&A is annualized based on “general and administrative expense” as reported in our Quarterly Report on Form 10 - Q for the quarter ended March 31 , 2021 (the Q 1 2021 10 - Q) . Gross assets calculated as total assets plus accumulated depreciation, each as reported in our Q 1 2021 10 - Q . 8 Financial Statistics
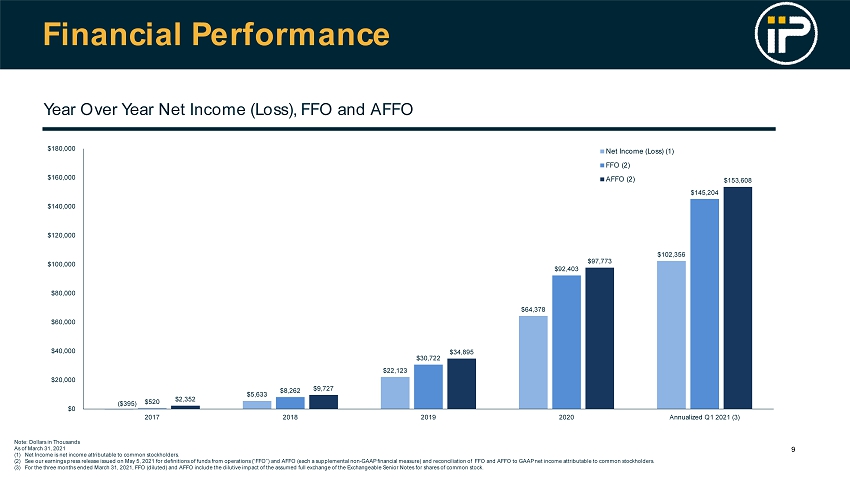
Financial Performance 9 $5,633 $22,123 $64,378 $102,356 $520 $8,262 $30,722 $92,403 $145,204 $2,352 $9,727 $34,895 $97,773 $153,608 $0 $20,000 $40,000 $60,000 $80,000 $100,000 $120,000 $140,000 $160,000 $180,000 2017 2018 2019 2020 Annualized Q1 2021 (3) Net Income (Loss) (1) FFO (2) AFFO (2) ($395) Note : Dollars in Thousands As of March 31 , 2021 (1) Net Income is net income attributable to common stockholders . (2) See our earnings press release issued on May 5 , 2021 for definitions of funds from operations (“FFO”) and AFFO (each a supplemental non - GAAP financial measure) and reconciliation of FFO and AFFO to GAAP net income attributable to common stockholders . (3) For the three months ended March 31 , 2021 , FFO (diluted) and AFFO include the dilutive impact of the assumed full exchange of the Exchangeable Senior Notes for shares of common stock . Year Over Year Net Income (Loss), FFO and AFFO
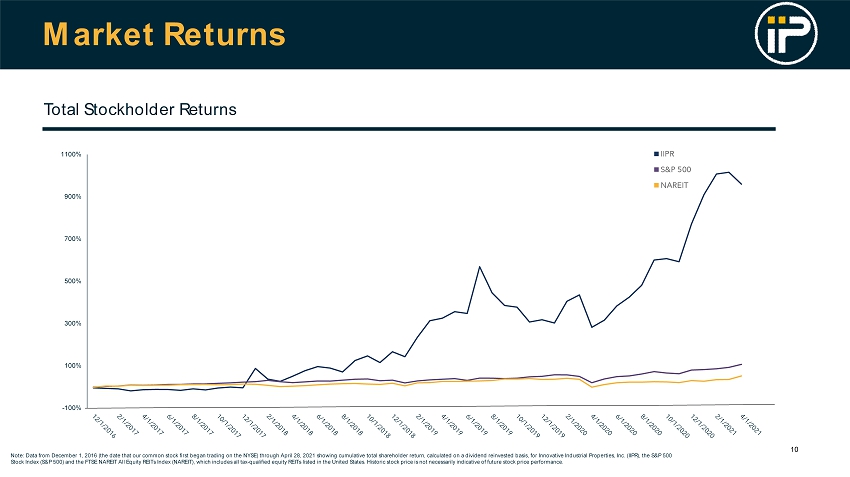
Market Returns 10 Total Stockholder Returns -100% 100% 300% 500% 700% 900% 1100% Note : Data from December 1 , 2016 (the date that our common stock first began trading on the NYSE) through April 28 , 2021 showing cumulative total shareholder return, calculated on a dividend reinvested basis, for Innovative Industrial Properties, Inc . (IIPR), the S&P 500 Stock Index (S&P 500 ) and the FTSE NAREIT All Equity REITs Index (NAREIT), which includes all tax - qualified equity REITs listed in the United States . Historic stock price is not necessarily indicative of future stock price performance .
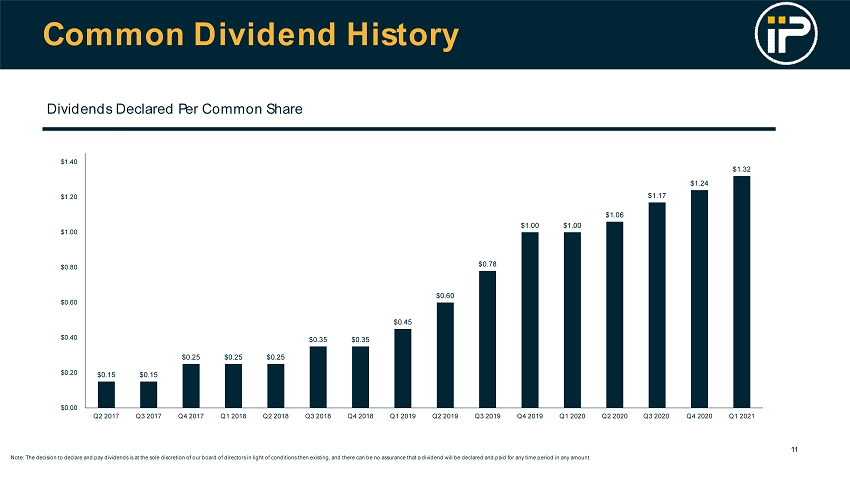
Common Dividend History 11 $0.15 $0.15 $0.25 $0.25 $0.25 $0.35 $0.35 $0.45 $0.60 $0.78 $1.00 $1.00 $1.06 $1.17 $1.24 $1.32 $0.00 $0.20 $0.40 $0.60 $0.80 $1.00 $1.20 $1.40 Q2 2017 Q3 2017 Q4 2017 Q1 2018 Q2 2018 Q3 2018 Q4 2018 Q1 2019 Q2 2019 Q3 2019 Q4 2019 Q1 2020 Q2 2020 Q3 2020 Q4 2020 Q1 2021 Dividends Declared Per Common Share Note : The decision to declare and pay dividends is at the sole discretion of our board of directors in light of conditions then existing, and there can be no assurance that a dividend will be declared and paid for any time period in any amount .
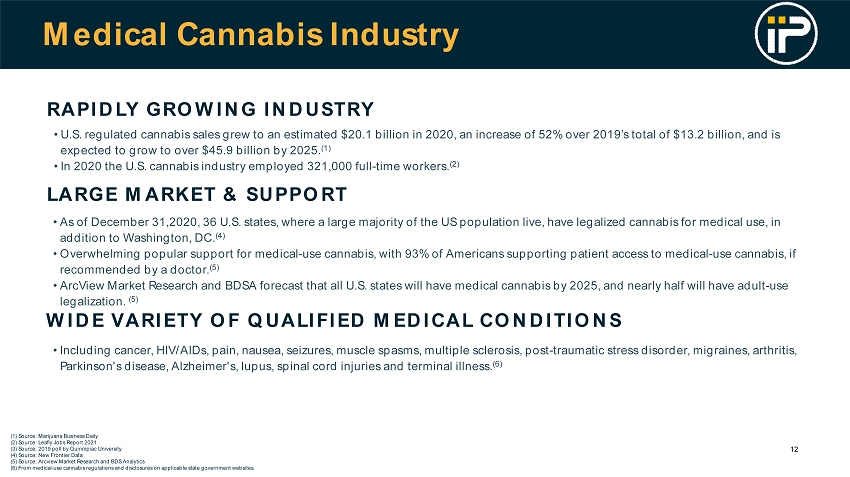
12 Medical Cannabis Industry WIDE VARIETY OF QUALIFIED MEDICAL CONDITIONS LARGE MARKET & SUPPORT RAPIDLY GROWING INDUSTRY • Including cancer, HIV/AIDs, pain, nausea, seizures, muscle spasms, multiple sclerosis, post - traumatic stress disorder, migraines , arthritis, Parkinson's disease, Alzheimer's, lupus, spinal cord injuries and terminal illness. (6) • As of December 31,2020, 36 U.S. states, where a large majority of the US population live, have legalized cannabis for medical use, in addition to Washington, DC. (4) • Overwhelming popular support for medical - use cannabis, with 93% of Americans supporting patient access to medical - use cannabis, if recommended by a doctor. (5) • ArcView Market Research and BDSA forecast that all U.S. states will have medical cannabis by 2025, and nearly half will have adu lt - use legalization. (5) • U.S. regulated cannabis sales grew to an estimated $ 20.1 billion in 2020, an increase of 52% over 2019’s total of $13.2 billion, and is expected to grow to over $45.9 billion by 2025. (1) • In 2020 the U.S. cannabis industry employed 321,000 full - time workers. (2) (1) Source: Marijuana Business Daily (2) Source: Leafly Jobs Report 2021 (3) Source: 2019 poll by Quinnipiac University (4) Source: New Frontier Data (5) Source: Arcview Market Research and BDS Analytics (6) From medical - use cannabis regulations and disclosures on applicable state government websites.
13 PROVEN STRATEGY STRONG BALANCE SHEET EXPERIENCED MANAGEMENT TEAM GROWING INDUSTRY CONSISTENT EXECUTION