Attached files
| file | filename |
|---|---|
| EX-99.2 - EXHIBIT 99.2 - EVERSOURCE ENERGY | tm2115513d1_ex99-2.htm |
| EX-99.1 - EXHIBIT 99.1 - EVERSOURCE ENERGY | tm2115513d1_ex99-1.htm |
| 8-K - FORM 8-K - EVERSOURCE ENERGY | tm2115513d1_8k.htm |
Exhibit 99.3

May 10, 2021 2021 First Quarter Results

Safe Harbor Statement 1 All per - share amounts in this presentation are reported on a diluted basis. The only common equity securities that are publicly traded are common shares of Eversource Energy. The earnings and EPS of each business do not represent a direct legal interest in the assets and liabilities of such bu siness, but rather represent a direct interest in Eversource Energy's assets and liabilities as a whole. EPS by business is a non - GAAP (not determined using generally accepte d accounting principles) financial measure that is calculated by dividing the net income or loss attributable to common shareholders of each business by the wei ght ed average diluted Eversource Energy common shares outstanding for the period. Earnings discussions also include a non - GAAP financial measure referencing 2021 and 2 020 earnings and EPS excluding certain acquisition and transition costs. Eversource Energy uses these non - GAAP financial measures to evaluate and provide deta ils of earnings results by business and to more fully compare and explain 2021 and 2020 results without including these items. Management believes the acquisition a nd transition costs are not indicative of Eversource Energy’s ongoing costs and performance. Due to the nature and significance of the effect of these items on net incom e attributable to common shareholders and EPS, management believes that the non - GAAP presentation is a more meaningful representation of Eversource Energy’s financial performance and provides additional and useful information to readers in analyzing historical and future performance of the business. Non - GAAP financial measures should not be considered as alternatives to Eversource Energy’s consolidated net income attributable to common shareholders or EPS determined in accordan ce with GAAP as indicators of Eversource Energy’s operating performance. This document includes statements concerning Eversource Energy’s expectations, beliefs, plans, objectives, goals, strategies, as sumptions of future events, future financial performance or growth and other statements that are not historical facts. These statements are “forward - looking statem ents” within the meaning of the Private Securities Litigation Reform Act of 1995. Generally, readers can identify these forward - looking statements through the use of w ords or phrases such as “estimate,” “expect,” “anticipate,” “intend,” “plan,” “project,” “believe,” “forecast,” “should,” “could” and other similar expressions. Fo rward - looking statements involve risks and uncertainties that may cause actual results or outcomes to differ materially from those included in the forward - looking statemen ts. Factors that may cause actual results to differ materially from those included in the forward - looking statements include, but are not limited to: cyberattacks or breache s, including those resulting in the compromise of the confidentiality of our proprietary information and the personal information of our customers; disruptions in the capit al markets or other events that make our access to necessary capital more difficult or costly; the negative impacts of the novel coronavirus (COVID - 19) pandemic on our customers, vendors, employees, regulators, and operations; changes in economic conditions, including impact on interest rates, tax policies, and customer demand and payment ab ility; ability or inability to commence and complete our major strategic development projects and opportunities; acts of war or terrorism, physical attacks or grid distu rba nces that may damage and disrupt our electric transmission and electric, natural gas, and water distribution systems; actions or inaction of local, state and fede ral regulatory, public policy and taxing bodies; substandard performance of third - party suppliers and service providers; fluctuations in weather patterns, including extreme weat her due to climate change; changes in business conditions, which could include disruptive technology or development of alternative energy sources related to our cu rre nt or future business model; contamination of, or disruption in, our water supplies; changes in levels or timing of capital expenditures; changes in laws, regulations o r r egulatory policy, including compliance with environmental laws and regulations; changes in accounting standards and financial reporting regulations; actions of rating ag enc ies; and other presently unknown or unforeseen factors. Other risk factors are detailed in Eversource Energy’s reports filed with the Securities and Exchange Commission (SEC). They ar e updated as necessary and available on Eversource Energy’s website at www.eversource.com and on the SEC’s website at www.sec.gov. All such factors are difficult to pr edict and contain uncertainties that may materially affect Eversource Energy’s actual results, many of which are beyond our control. You should not place undue relia nce on the forward - looking statements, as each speaks only as of the date on which such statement is made, and, except as required by federal securities laws, Eversour ce Energy undertakes no obligation to update any forward - looking statement or statements to reflect events or circumstances after the date on which such statement is made or to reflect the occurrence of unanticipated events.
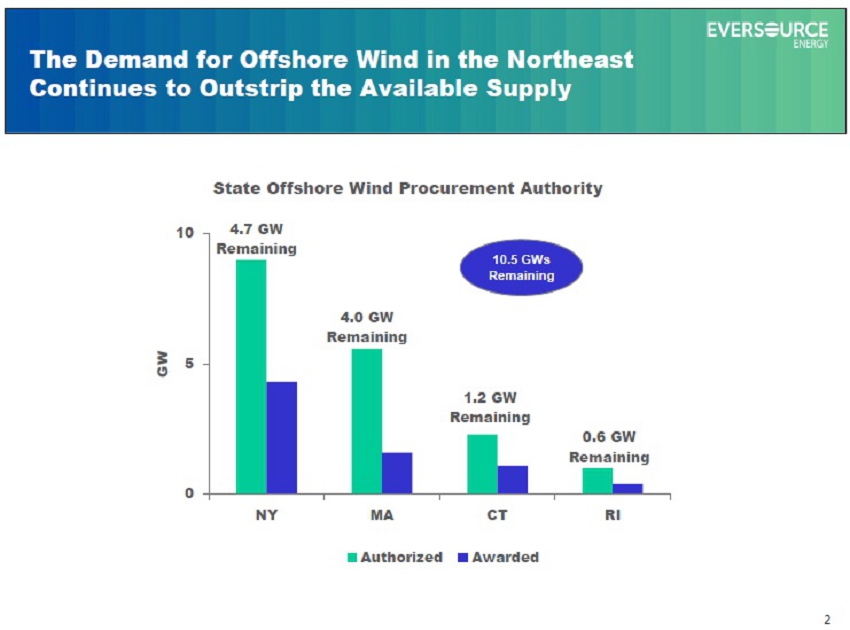
The Demand for Offshore Wind in the Northeast Continues to Outstrip the Available Supply 2 4.7 GW Remaining 4.0 GW Remaining 1.2 GW Remaining 0.6 GW Remaining 0 5 10 15 NY MA CT RI GW State Offshore Wind Procurement Authority Authorized Awarded 10.5 GWs Remaining

Expected Timeline for Eversource-Ørsted ProjectsSizeConstruction Operation Plan Filing with BOEMState PermitMost Recent Commercial Ops DatePrice as of first day of commercial operationTermStatus of ContractsSouth Fork Wind 132 MW Filed Oct 2018; DEIS issued Jan. 8, 2021; Decision in Jan 2022NY State Article VII Permit Approved March 18, 2021Late 2023~ $0.160/KWH for 90 MW ~ $0.086/KWH for 42 MW (avg. annual escalator: 2%) 20 yearsIncrease in capacity to 132 MW from 90 MW approvedRevolution Wind 704 MW Filed March 2020; review schedule was received on April 30, 2021; final approval expected in Q3 2023 Filed December 2020, completed initial hearing and public administrative hearings in late March & April Unlikely to achieve end of 2023 in-service date$0.098425/KWH for RI (no escalator) CT pricing not disclosed20 years400 MW for RI approved 200 MW for CT approved 104 MW for CT approvedSunrise Wind 924 MWSeptember 2020; review schedule expected in 2021Filed December 2020, supplemented application on April 12 with route enhancements Unlikely to achieve end of 2024 in-service date$0.11037/KWH (no escalator) 25 years Contract signed with NYSERDA in October 2019InterconnectionEast Hampton, NY (LI)Davisville, RIBrookhaven, NY (LI)3

Q1 2021 Q1 2020 Change $0.27 $0.39 (0.12) 0.39 0.38 0.01 0.43 0.26 0.17 0.01 0.01 0.00 (0.02) (0.02) 0.00 $1.08 $1.02 $0.06 (0.02) (0.01) (0.01) $1.06 $1.01 $0.05 Natural Gas Distribution Electric Transmission Electric Distribution Water Distribution Reported EPS (GAAP) 4 Q1 2021 vs. Q1 2020 Financial Results Parent & Other (Non - GAAP) EPS (Non - GAAP) exc. Acquisition/Transition Costs Acquisition/Transition Costs

5 Well Performing Core Businesses Drive EPS CAGR to Upper Half of 5 – 7% Through 2025 $2.28 $2.53 $2.65 $2.81 $2.96 $3.11 $3.25 $3.45 $3.64 $3.81 - $3.93 2012A* 2013A* 2014A* 2015A* 2016A 2017A 2018A 2019A* 2020A* 2021E 2022E 2023E 2024E 2025E *Excludes merger and integration costs in 2012 - 2015, NPT charge in 2019, and Columbia Gas acquisition and transition costs in 20 20 and 2021 Expected higher than 5% - 7% as larger offshore wind projects enter service * Now projecting lower end of 2021 earnings guidance, including $0.07 of CL&P of Storm Isaias credits

6 APPENDIX

7 $994 $1,030 $964 $1,065 $915 $853 $761 $711 $1,145 $1,221 $1,189 $1,269 $1,309 $1,353 $1,289 $1,229 $404 $453 $545 $824 $925 $974 $937 $789 $102 $110 $127 $149 $143 $154 $162 $171 $185 $239 $239 $217 $249 $211 $194 $176 $2,830 $3,053 $3,064 $3,524 $3,541 $3,545 $3,343 $3,076 $0 $500 $1,000 $1,500 $2,000 $2,500 $3,000 $3,500 $4,000 2018A 2019A 2020A 2021E 2022E 2023E 2024E 2025E Transmission Electric Distribution Natural Gas Distribution Water IT and Facilities $ In Millions Projected Capital Expenditures For Core Businesses $17 Billion 2021 - 2025

8 Description Docket Number Current Schedule Review of Tropical Storm Isaias 20 - 08 - 03 Final decision issued 4/28/21. Notice of Violation phase commenced on 5/6/21; Final decision (tentative) on 7/14/21 Annual review of multiple CL&P trackers (RAM) 21 - 01 - 03 Interim decision issued 4/28/21; New rates subject to true - up, 6/1/21; Phase II decision, 9/15/21; Potential rate adjustment, 10/1/21 New rate designs, including possible low - income, economic development rates, possible interim rate reduction 17 - 12 - 03RE11 Phase Ia decision (Rate 30) due 6/23/21; Phase IIa decision on interim rate decrease topics due 9/15/2021; Phase IIb (economic development/low - income rates) discovery to end no earlier than 7/9/2021 AMI 17 - 12 - 03RE02 Early stages in process Zero - emission vehicle deployment 17 - 12 - 03RE04 Draft decision expected in Q2 2021 Methodology for establishing residential bill credits for power outages longer than 96 hrs. 20 - 12 - 46 Draft decision, 6/9/21; Final decision, 6/23/21 Performance Based Ratemaking design N/A To be opened by 6/1/21 Key PURA Regulatory Dockets

10 FERC Transmission New England ROE Update • Current base: 10.57%; Cap: 11.74% (2014 Opinion 531A) • October 2018 FERC Order in New England ROE cases proposed a new methodology to address issues raised by Court in vacating Opinion 531A (New England ROE Complaint I) • This new methodology provided a path forward to resolve 2011, 2012, 2014 and 2016 complaints against New England transmission ROEs; timing of decision remains unclear • Original FERC - proposed new methodology averaged DCF, CAPM, risk premium, expected earnings • Illustrative base: 10.41%; Cap: 13.08% (October 2018 proposed new method) • FERC changed methodology in revised May 2020 MISO TO Order and applied only DCF, CAPM and risk premium methodologies. No date given for New England ROE decision • In April 2021, FERC voted 3 - 2 to issue a revised NOPR asking for comments on several items related to incentives, including limiting 50 - basis - point RTO adder to 3 years • ES incentives now capped at 11.74%, 117 bps above 10.57% base; FERC has approved 100 - 150 basis point incentives for multiple projects that were built between 2004 and 2012, but their all - in returns have been reduced since 2014 by the cap