Attached files
| file | filename |
|---|---|
| EX-99.1 - EX-99.1 - Trinseo S.A. | tse-20210506xex99d1.htm |
| 8-K - 8-K - Trinseo S.A. | tse-20210506x8k.htm |
Exhibit 99.2
| First Quarter 2021 Financial Results & Outlook May 6, 2021 Trinseo Confidential – For internal use only |
| 2 Disclosure Rules Cautionary Note on Forward-Looking Statements. This presentation contains forward-looking statements including, without limitation, statements concerning plans, objectives, goals, projections, strategies, future events or performance, and underlying assumptions and other statements, which are not statements of historical facts or guarantees or assurances of future performance. Forward-looking statements may be identified by the use of words like “expect,” “anticipate,” “intend,” “forecast,” “outlook,” “will,” “may,” “might,” “see,” “tend,” “assume,” “potential,” “likely,” “target,” “plan,” “contemplate,” “seek,” “attempt,” “should,” “could,” “would” or expressions of similar meaning. Forward-looking statements reflect management’s evaluation of information currently available and are based on our current expectations and assumptions regarding estimated and future results of operations, business strategies, competitive position, industry environment and potential growth opportunities and cost synergies related to the acquisition of the MMA and PMMA businesses from Arkema S.A.; our business, the economy and other future conditions. Because forward-looking statements relate to the future, they are subject to inherent uncertainties, risks and changes in circumstances that are difficult to predict. Factors that might cause such a difference include, but are not limited to, our ability to successfully integrate the acquired MMA and PMMA businesses, generate expected cost savings and synergies, maintain relationships with customers, retain key employees and profitably grow the business; and those factors discussed in our Annual Report on Form 10-K, under Part I, Item 1A — “Risk Factors” and elsewhere in our other reports furnished or filed with the U.S. Securities and Exchange Commission. As a result of these or other factors, our actual results may differ materially from those contemplated by the forward-looking statements. Therefore, we caution you against relying on any of these forward-looking statements. The forward- looking statements included in this presentation are made only as of the date hereof. We undertake no obligation to publicly update or revise any forward-looking statement as a result of new information, future events or otherwise, except as otherwise required by law. This presentation contains financial measures that are not in accordance with generally accepted accounting principles in the US (“GAAP”) including EBITDA, Adjusted EBITDA, Adjusted Net Income, Adjusted EPS and Free Cash Flow. We believe these measures provide relevant and meaningful information to investors and lenders about the ongoing operating results and liquidity position of the Company. Such measures when referenced herein should not be viewed as an alternative to GAAP measures of performance or liquidity, as applicable. We have provided a reconciliation of these measures to the most comparable GAAP metric alongside of the respective measure or otherwise in the Appendix section and in the accompanying press release. Introductions • Frank Bozich, President & CEO • David Stasse, Executive Vice President & CFO • Andy Myers, Director of Investor Relations Introductions & Disclosure Rules |

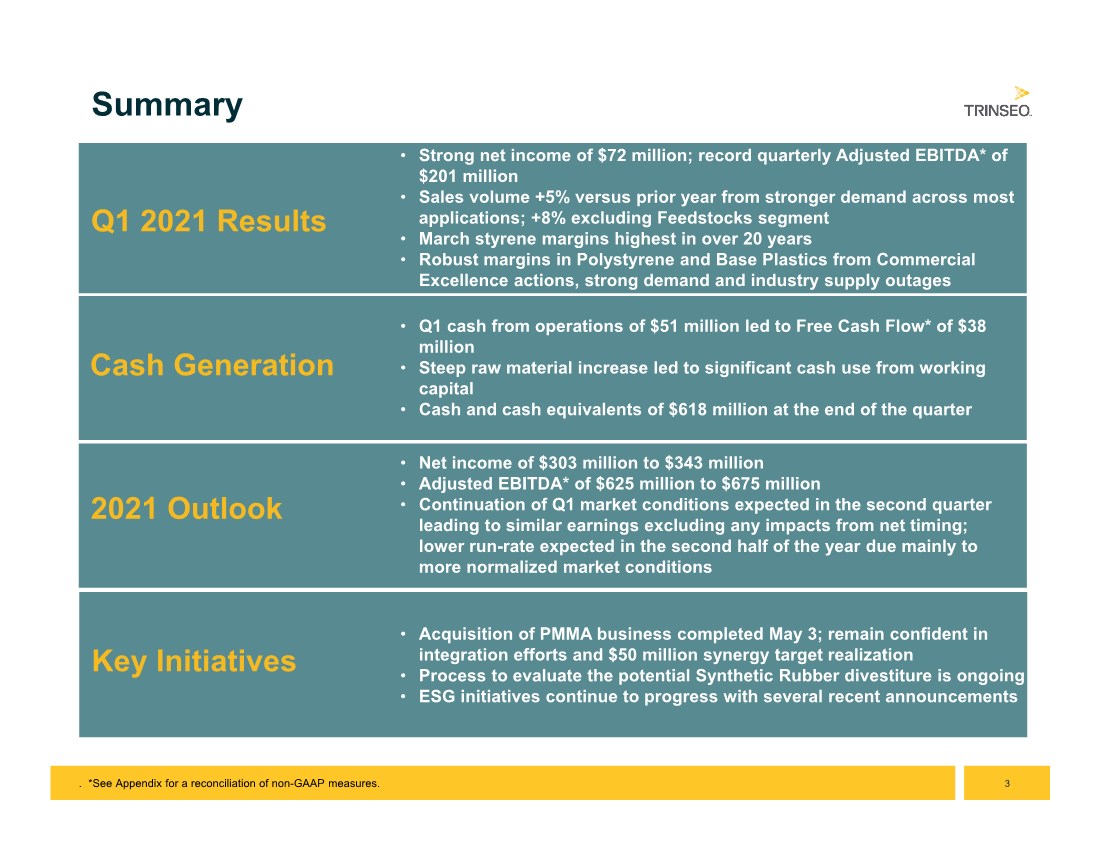
| 3 Summary • Strong net income of $72 million; record quarterly Adjusted EBITDA* of $201 million • Sales volume +5% versus prior year from stronger demand across most applications; +8% excluding Feedstocks segment • March styrene margins highest in over 20 years • Robust margins in Polystyrene and Base Plastics from Commercial Excellence actions, strong demand and industry supply outages 2021 Outlook Q1 2021 Results • Q1 cash from operations of $51 million led to Free Cash Flow* of $38 million • Steep raw material increase led to significant cash use from working capital • Cash and cash equivalents of $618 million at the end of the quarter Cash Generation • Net income of $303 million to $343 million • Adjusted EBITDA* of $625 million to $675 million • Continuation of Q1 market conditions expected in the second quarter leading to similar earnings excluding any impacts from net timing; lower run-rate expected in the second half of the year due mainly to more normalized market conditions • Acquisition of PMMA business completed May 3; remain confident in integration efforts and $50 million synergy target realization • Process to evaluate the potential Synthetic Rubber divestiture is ongoing • ESG initiatives continue to progress with several recent announcements Key Initiatives . *See Appendix for a reconciliation of non-GAAP measures. |
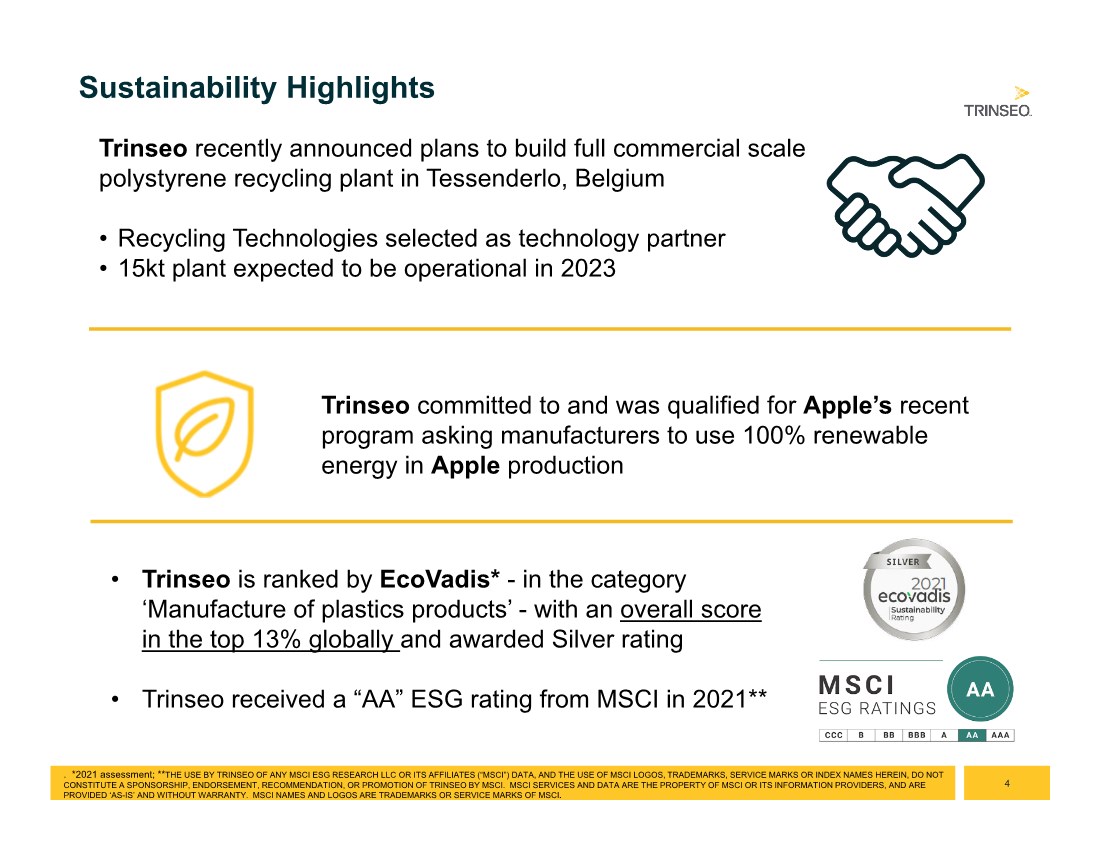
| 4 Sustainability Highlights Trinseo recently announced plans to build full commercial scale polystyrene recycling plant in Tessenderlo, Belgium • Recycling Technologies selected as technology partner • 15kt plant expected to be operational in 2023 Trinseo committed to and was qualified for Apple’s recent program asking manufacturers to use 100% renewable energy in Apple production • Trinseo is ranked by EcoVadis* - in the category ‘Manufacture of plastics products’ - with an overall score in the top 13% globally and awarded Silver rating • Trinseo received a “AA” ESG rating from MSCI in 2021** . *2021 assessment; **THE USE BY TRINSEO OF ANY MSCI ESG RESEARCH LLC OR ITS AFFILIATES (“MSCI”) DATA, AND THE USE OF MSCI LOGOS, TRADEMARKS, SERVICE MARKS OR INDEX NAMES HEREIN, DO NOT CONSTITUTE A SPONSORSHIP, ENDORSEMENT, RECOMMENDATION, OR PROMOTION OF TRINSEO BY MSCI. MSCI SERVICES AND DATA ARE THE PROPERTY OF MSCI OR ITS INFORMATION PROVIDERS, AND ARE PROVIDED ‘AS-IS’ AND WITHOUT WARRANTY. MSCI NAMES AND LOGOS ARE TRADEMARKS OR SERVICE MARKS OF MSCI. |
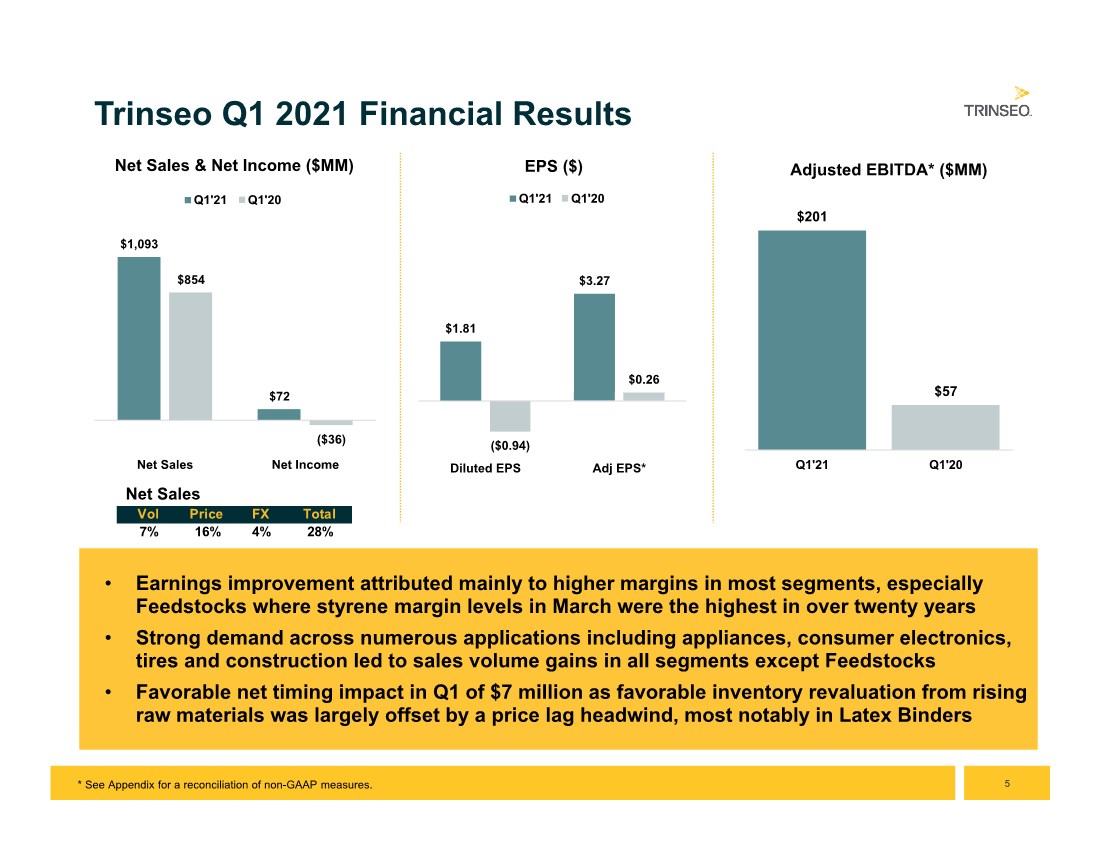
| 5 $201 $57 Q1'21 Q1'20 Adjusted EBITDA* ($MM) • Earnings improvement attributed mainly to higher margins in most segments, especially Feedstocks where styrene margin levels in March were the highest in over twenty years • Strong demand across numerous applications including appliances, consumer electronics, tires and construction led to sales volume gains in all segments except Feedstocks • Favorable net timing impact in Q1 of $7 million as favorable inventory revaluation from rising raw materials was largely offset by a price lag headwind, most notably in Latex Binders • Earnings improvement attributed mainly to higher margins in most segments, especially Feedstocks where styrene margin levels in March were the highest in over twenty years • Strong demand across numerous applications including appliances, consumer electronics, tires and construction led to sales volume gains in all segments except Feedstocks • Favorable net timing impact in Q1 of $7 million as favorable inventory revaluation from rising raw materials was largely offset by a price lag headwind, most notably in Latex Binders Trinseo Q1 2021 Financial Results $1.81 $3.27 ($0.94) $0.26 Diluted EPS Adj EPS* EPS ($) Q1'21 Q1'20 $1,093 $72 $854 ($36) Net Sales Net Income Net Sales & Net Income ($MM) Q1'21 Q1'20 Net Sales * See Appendix for a reconciliation of non-GAAP measures. Vol Price FX Total 7% 16% 4% 28% |
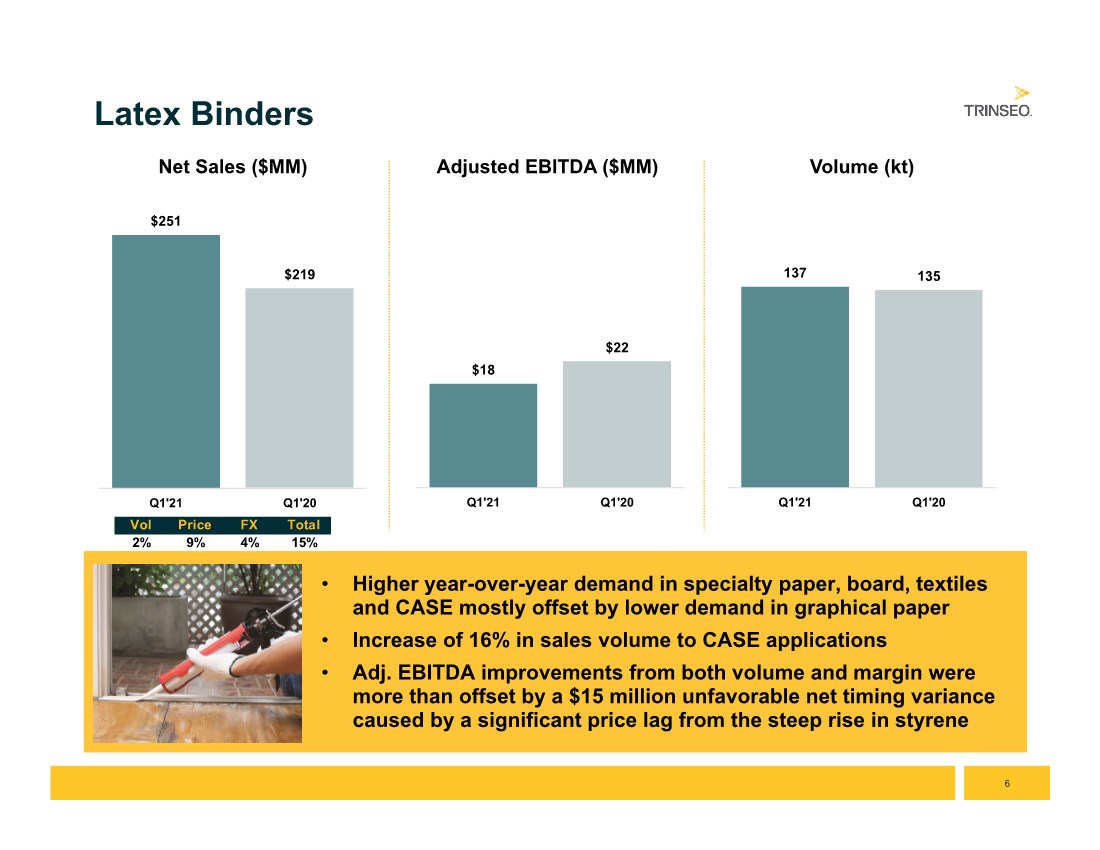
| 6 • Higher year-over-year demand in specialty paper, board, textiles and CASE mostly offset by lower demand in graphical paper • Increase of 16% in sales volume to CASE applications • Adj. EBITDA improvements from both volume and margin were more than offset by a $15 million unfavorable net timing variance caused by a significant price lag from the steep rise in styrene • Higher year-over-year demand in specialty paper, board, textiles and CASE mostly offset by lower demand in graphical paper • Increase of 16% in sales volume to CASE applications • Adj. EBITDA improvements from both volume and margin were more than offset by a $15 million unfavorable net timing variance caused by a significant price lag from the steep rise in styrene Latex Binders $251 $219 Q1'21 Q1'20 Net Sales ($MM) $18 $22 Q1'21 Q1'20 Adjusted EBITDA ($MM) 137 135 Q1'21 Q1'20 Volume (kt) Vol Price FX Total 2% 9% 4% 15% |
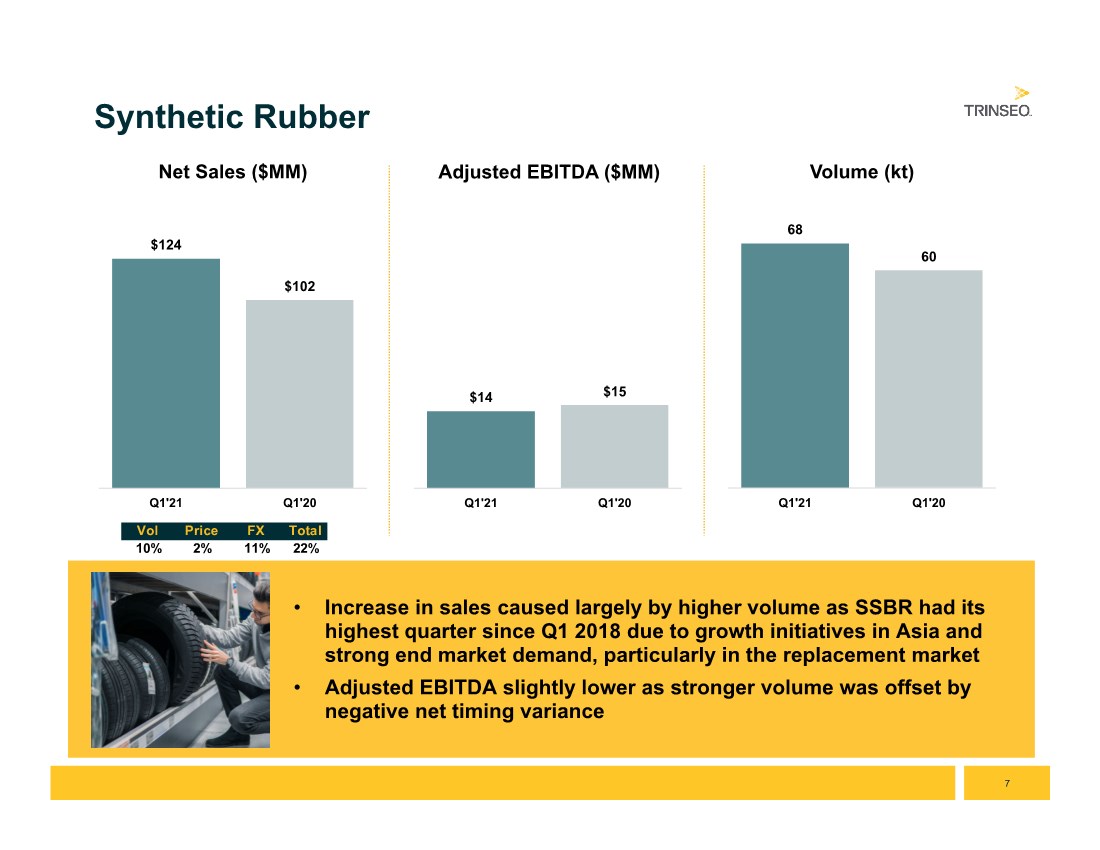
| 7 • Increase in sales caused largely by higher volume as SSBR had its highest quarter since Q1 2018 due to growth initiatives in Asia and strong end market demand, particularly in the replacement market • Adjusted EBITDA slightly lower as stronger volume was offset by negative net timing variance • Increase in sales caused largely by higher volume as SSBR had its highest quarter since Q1 2018 due to growth initiatives in Asia and strong end market demand, particularly in the replacement market • Adjusted EBITDA slightly lower as stronger volume was offset by negative net timing variance Synthetic Rubber $124 $102 Q1'21 Q1'20 Net Sales ($MM) $14 $15 Q1'21 Q1'20 Adjusted EBITDA ($MM) 68 60 Q1'21 Q1'20 Volume (kt) Vol Price FX Total 10% 2% 11% 22% |
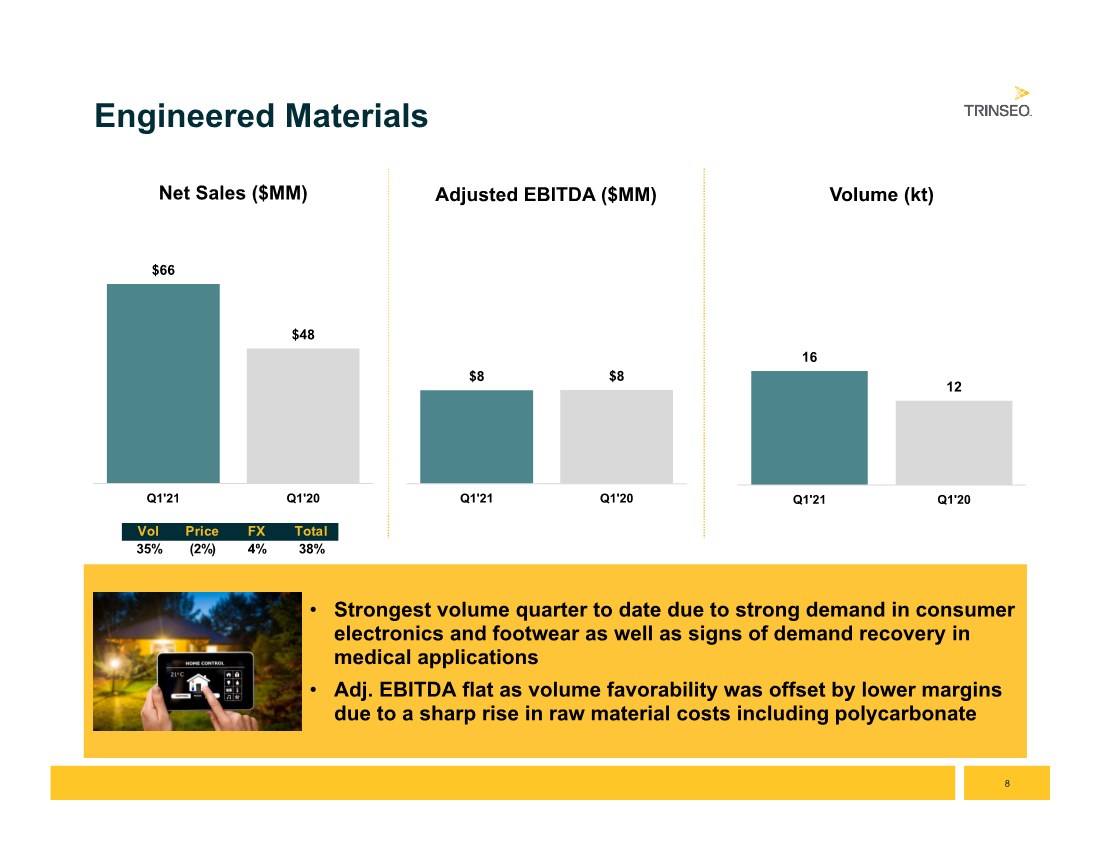
| 8 • Strongest volume quarter to date due to strong demand in consumer electronics and footwear as well as signs of demand recovery in medical applications • Adj. EBITDA flat as volume favorability was offset by lower margins due to a sharp rise in raw material costs including polycarbonate • Strongest volume quarter to date due to strong demand in consumer electronics and footwear as well as signs of demand recovery in medical applications • Adj. EBITDA flat as volume favorability was offset by lower margins due to a sharp rise in raw material costs including polycarbonate Engineered Materials $66 $48 Q1'21 Q1'20 Net Sales ($MM) $8 $8 Q1'21 Q1'20 Adjusted EBITDA ($MM) 16 12 Q1'21 Q1'20 Volume (kt) Vol Price FX Total 35% (2%) 4% 38% |
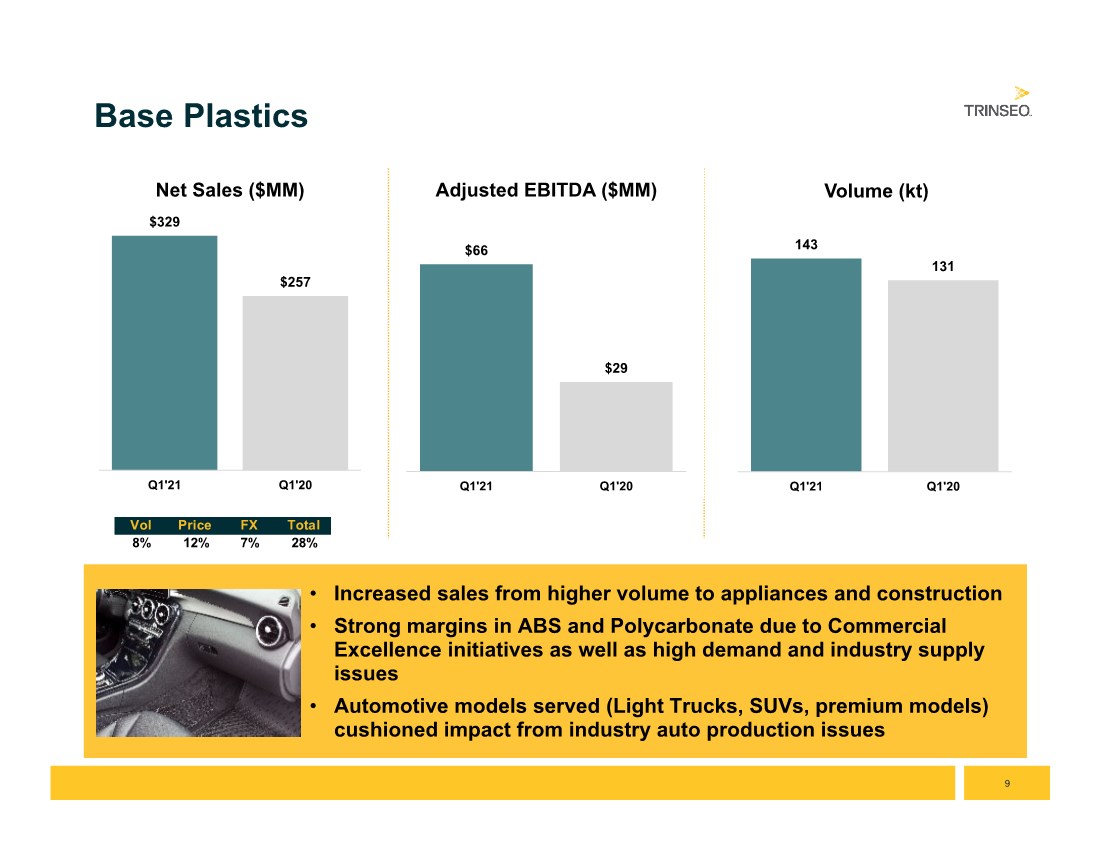
| 9 • Increased sales from higher volume to appliances and construction • Strong margins in ABS and Polycarbonate due to Commercial Excellence initiatives as well as high demand and industry supply issues • Automotive models served (Light Trucks, SUVs, premium models) cushioned impact from industry auto production issues • Increased sales from higher volume to appliances and construction • Strong margins in ABS and Polycarbonate due to Commercial Excellence initiatives as well as high demand and industry supply issues • Automotive models served (Light Trucks, SUVs, premium models) cushioned impact from industry auto production issues Base Plastics $329 $257 Q1'21 Q1'20 Net Sales ($MM) $66 $29 Q1'21 Q1'20 Adjusted EBITDA ($MM) 143 131 Q1'21 Q1'20 Volume (kt) Vol Price FX Total 8% 12% 7% 28% |
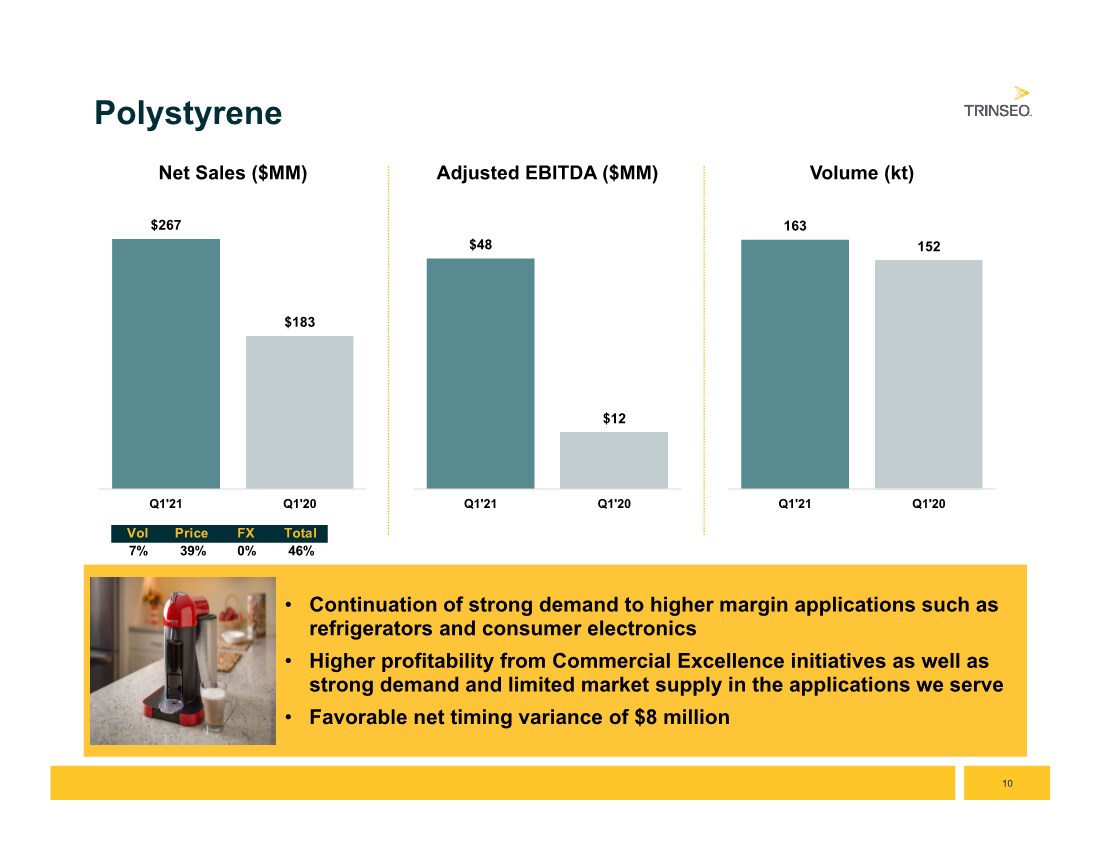
| 10 • Continuation of strong demand to higher margin applications such as refrigerators and consumer electronics • Higher profitability from Commercial Excellence initiatives as well as strong demand and limited market supply in the applications we serve • Favorable net timing variance of $8 million • Continuation of strong demand to higher margin applications such as refrigerators and consumer electronics • Higher profitability from Commercial Excellence initiatives as well as strong demand and limited market supply in the applications we serve • Favorable net timing variance of $8 million Polystyrene $267 $183 Q1'21 Q1'20 Net Sales ($MM) $48 $12 Q1'21 Q1'20 Adjusted EBITDA ($MM) 163 152 Q1'21 Q1'20 Volume (kt) Vol Price FX Total 7% 39% 0% 46% |
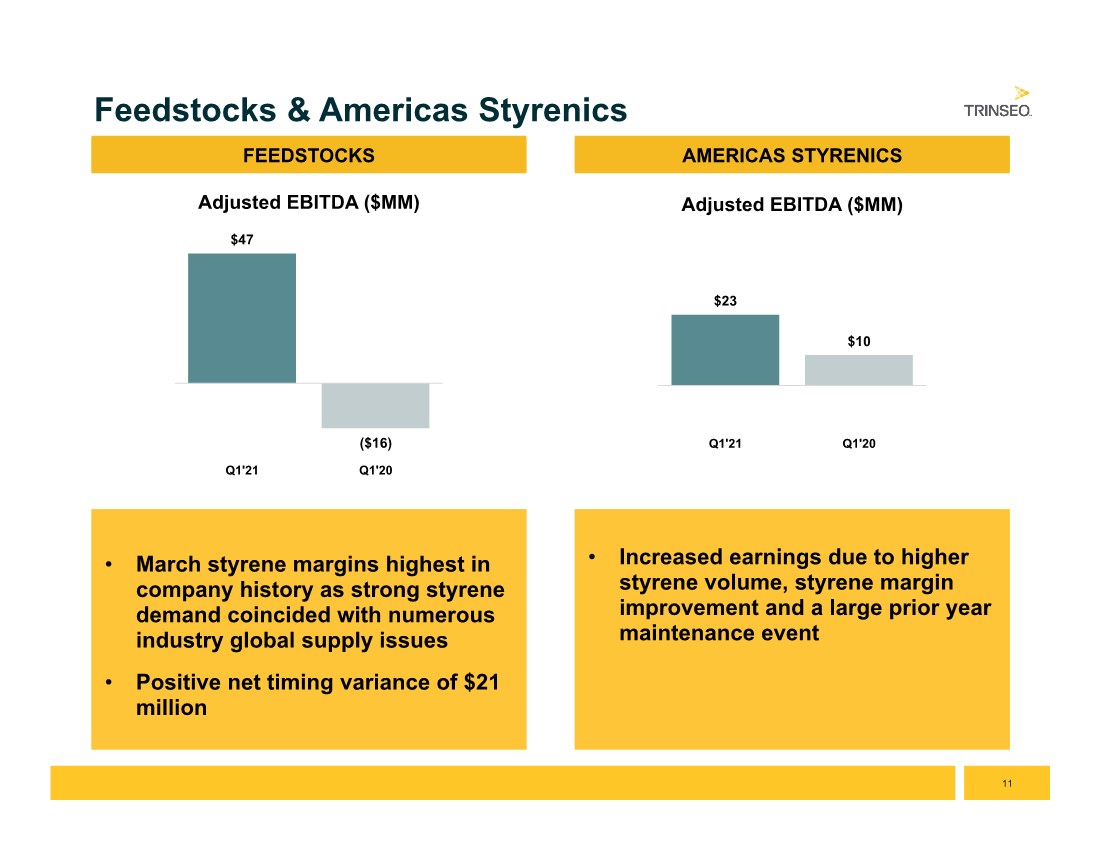
| 11 • March styrene margins highest in company history as strong styrene demand coincided with numerous industry global supply issues • Positive net timing variance of $21 million • March styrene margins highest in company history as strong styrene demand coincided with numerous industry global supply issues • Positive net timing variance of $21 million Feedstocks & Americas Styrenics $47 ($16) Q1'21 Q1'20 Adjusted EBITDA ($MM) FEEDSTOCKS • Increased earnings due to higher styrene volume, styrene margin improvement and a large prior year maintenance event • Increased earnings due to higher styrene volume, styrene margin improvement and a large prior year maintenance event AMERICAS STYRENICS $23 $10 Q1'21 Q1'20 Adjusted EBITDA ($MM) |
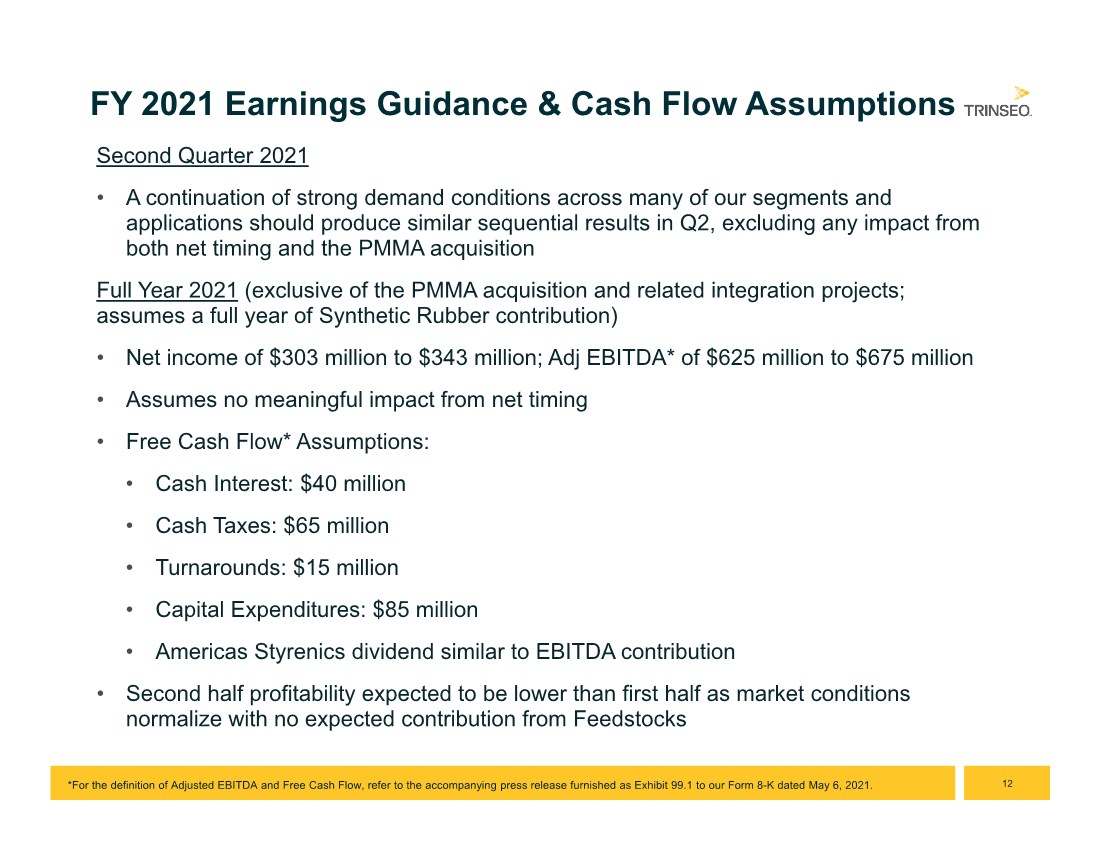
| 12 FY 2021 Earnings Guidance & Cash Flow Assumptions Second Quarter 2021 • A continuation of strong demand conditions across many of our segments and applications should produce similar sequential results in Q2, excluding any impact from both net timing and the PMMA acquisition Full Year 2021 (exclusive of the PMMA acquisition and related integration projects; assumes a full year of Synthetic Rubber contribution) • Net income of $303 million to $343 million; Adj EBITDA* of $625 million to $675 million • Assumes no meaningful impact from net timing • Free Cash Flow* Assumptions: • Cash Interest: $40 million • Cash Taxes: $65 million • Turnarounds: $15 million • Capital Expenditures: $85 million • Americas Styrenics dividend similar to EBITDA contribution • Second half profitability expected to be lower than first half as market conditions normalize with no expected contribution from Feedstocks *For the definition of Adjusted EBITDA and Free Cash Flow, refer to the accompanying press release furnished as Exhibit 99.1 to our Form 8-K dated May 6, 2021. |
| Appendix Trinseo Confidential – For internal use only |

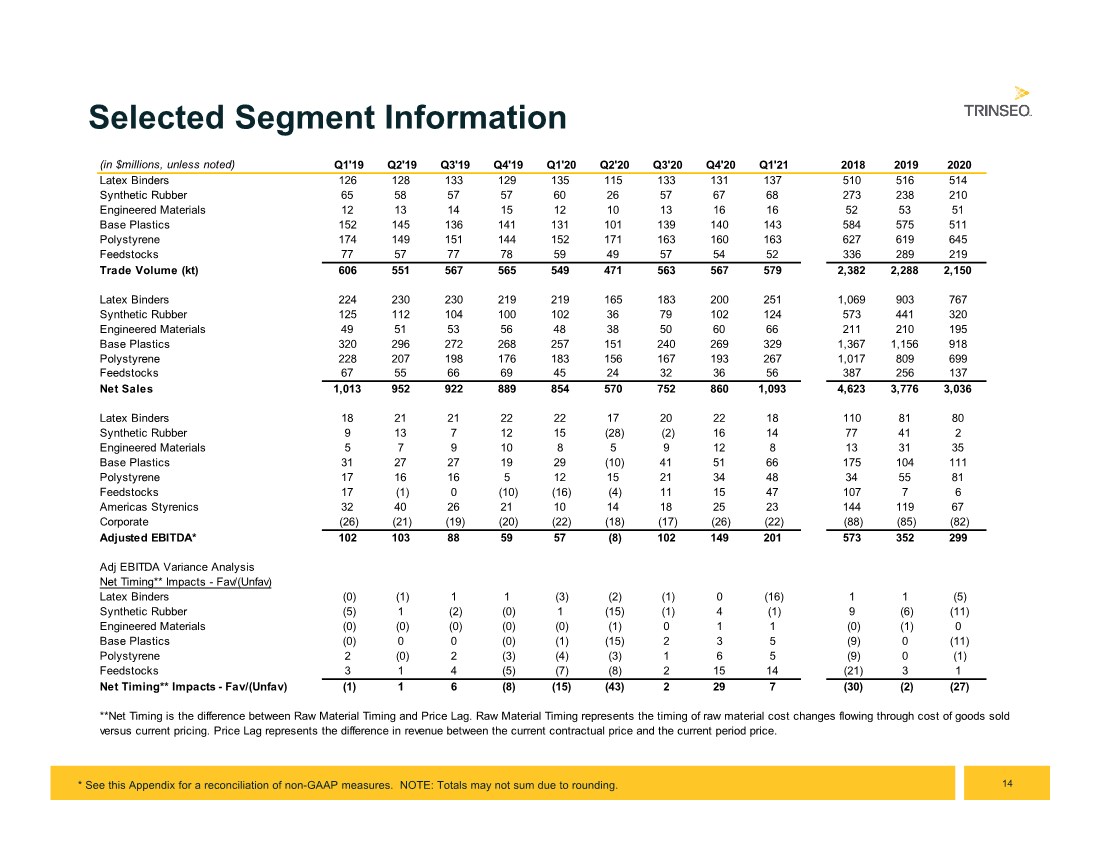
| 14 Selected Segment Information * See this Appendix for a reconciliation of non-GAAP measures. NOTE: Totals may not sum due to rounding. (in $millions, unless noted) Q1'19 Q2'19 Q3'19 Q4'19 Q1'20 Q2'20 Q3'20 Q4'20 Q1'21 2018 2019 2020 Latex Binders 126 128 133 129 135 115 133 131 137 510 516 514 Synthetic Rubber 65 58 57 57 60 26 57 67 68 273 238 210 Engineered Materials 121314151210131616525351 Base Plastics 152 145 136 141 131 101 139 140 143 584 575 511 Polystyrene 174 149 151 144 152 171 163 160 163 627 619 645 Feedstocks 77 57 77 78 59 49 57 54 52 336 289 219 Trade Volume (kt) 606 551 567 565 549 471 563 567 579 2,382 2,288 2,150 Latex Binders 224 230 230 219 219 165 183 200 251 1,069 903 767 Synthetic Rubber 125 112 104 100 102 36 79 102 124 573 441 320 Engineered Materials 49 51 53 56 48 38 50 60 66 211 210 195 Base Plastics 320 296 272 268 257 151 240 269 329 1,367 1,156 918 Polystyrene 228 207 198 176 183 156 167 193 267 1,017 809 699 Feedstocks 67 55 66 69 45 24 32 36 56 387 256 137 Net Sales 1,013 952 922 889 854 570 752 860 1,093 4,623 3,776 3,036 Latex Binders 1821212222172022181108180 Synthetic Rubber 9 13 7 12 15 (28) (2) 16 14 77 41 2 Engineered Materials 5 7 9 10 8 5 9 12 8 13 31 35 Base Plastics 31 27 27 19 29 (10) 41 51 66 175 104 111 Polystyrene 17 16 16 5 12 15 21 34 48 34 55 81 Feedstocks 17 (1) 0 (10) (16) (4) 11 15 47 107 7 6 Americas Styrenics 32 40 26 21 10 14 18 25 23 144 119 67 Corporate (26) (21) (19) (20) (22) (18) (17) (26) (22) (88) (85) (82) Adjusted EBITDA* 102 103 88 59 57 (8) 102 149 201 573 352 299 Adj EBITDA Variance Analysis Net Timing** Impacts - Fav/(Unfav) Latex Binders (0) (1) 1 1 (3) (2) (1) 0 (16) 1 1 (5) Synthetic Rubber (5) 1 (2) (0) 1 (15) (1) 4 (1) 9 (6) (11) Engineered Materials (0) (0) (0) (0) (0) (1) 0 1 1 (0) (1) 0 Base Plastics (0) 0 0 (0) (1) (15) 2 3 5 (9) 0 (11) Polystyrene 2 (0) 2 (3) (4) (3) 1 6 5 (9) 0 (1) Feedstocks 3 1 4 (5) (7) (8) 2 15 14 (21) 3 1 Net Timing** Impacts - Fav/(Unfav) (1) 1 6 (8) (15) (43) 2 29 7 (30) (2) (27) **Net Timing is the difference between Raw Material Timing and Price Lag. Raw Material Timing represents the timing of raw material cost changes flowing through cost of goods sold versus current pricing. Price Lag represents the difference in revenue between the current contractual price and the current period price. |
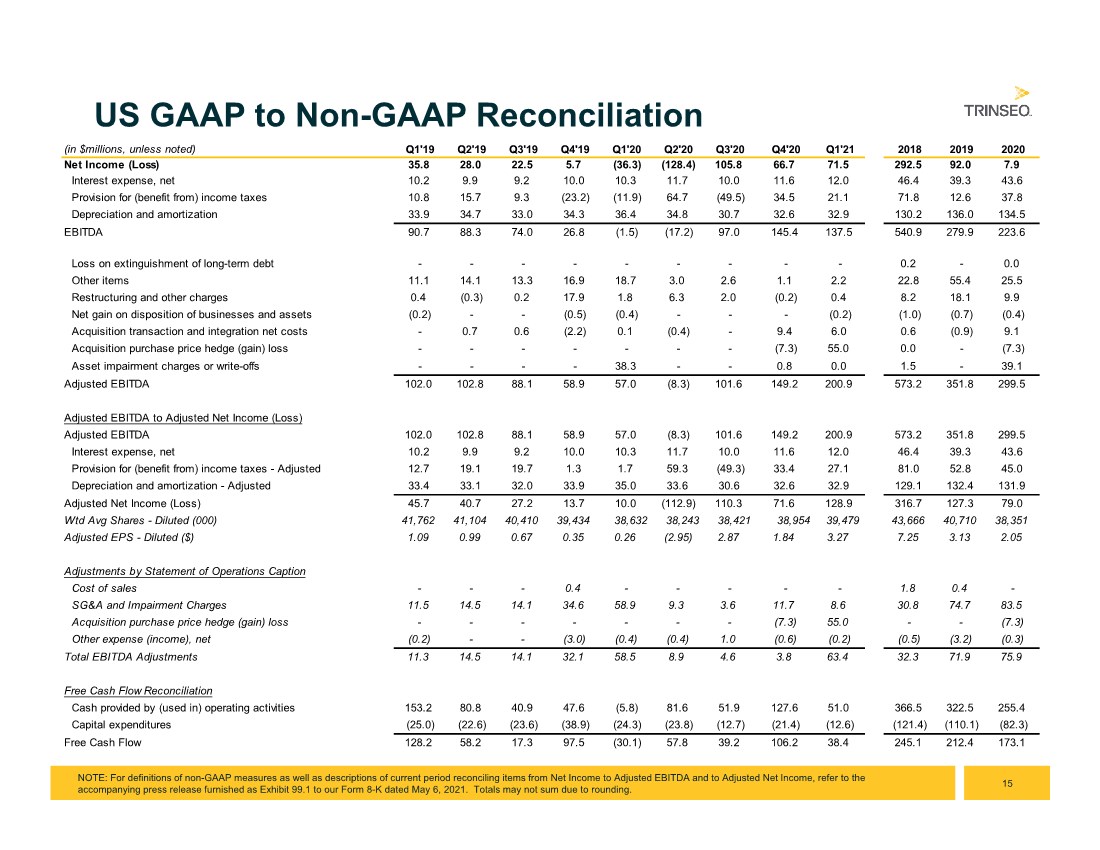
| 15 US GAAP to Non-GAAP Reconciliation NOTE: For definitions of non-GAAP measures as well as descriptions of current period reconciling items from Net Income to Adjusted EBITDA and to Adjusted Net Income, refer to the accompanying press release furnished as Exhibit 99.1 to our Form 8-K dated May 6, 2021. Totals may not sum due to rounding. (in $millions, unless noted) Q1'19 Q2'19 Q3'19 Q4'19 Q1'20 Q2'20 Q3'20 Q4'20 Q1'21 2018 2019 2020 Net Income (Loss) 35.8 28.0 22.5 5.7 (36.3) (128.4) 105.8 66.7 71.5 292.5 92.0 7.9 Interest expense, net 10.2 9.9 9.2 10.0 10.3 11.7 10.0 11.6 12.0 46.4 39.3 43.6 Provision for (benefit from) income taxes 10.8 15.7 9.3 (23.2) (11.9) 64.7 (49.5) 34.5 21.1 71.8 12.6 37.8 Depreciation and amortization 33.9 34.7 33.0 34.3 36.4 34.8 30.7 32.6 32.9 130.2 136.0 134.5 EBITDA 90.7 88.3 74.0 26.8 (1.5) (17.2) 97.0 145.4 137.5 540.9 279.9 223.6 Loss on extinguishment of long-term debt - - - - - - - - - 0.2 - 0.0 Other items 11.1 14.1 13.3 16.9 18.7 3.0 2.6 1.1 2.2 22.8 55.4 25.5 Restructuring and other charges 0.4 (0.3) 0.2 17.9 1.8 6.3 2.0 (0.2) 0.4 8.2 18.1 9.9 Net gain on disposition of businesses and assets (0.2) - - (0.5) (0.4) - - - (0.2) (1.0) (0.7) (0.4) Acquisition transaction and integration net costs - 0.7 0.6 (2.2) 0.1 (0.4) - 9.4 6.0 0.6 (0.9) 9.1 Acquisition purchase price hedge (gain) loss - - - - - - - (7.3) 55.0 0.0 - (7.3) Asset impairment charges or write-offs - - - - 38.3 - - 0.8 0.0 1.5 - 39.1 Adjusted EBITDA 102.0 102.8 88.1 58.9 57.0 (8.3) 101.6 149.2 200.9 573.2 351.8 299.5 Adjusted EBITDA to Adjusted Net Income (Loss) Adjusted EBITDA 102.0 102.8 88.1 58.9 57.0 (8.3) 101.6 149.2 200.9 573.2 351.8 299.5 Interest expense, net 10.2 9.9 9.2 10.0 10.3 11.7 10.0 11.6 12.0 46.4 39.3 43.6 Provision for (benefit from) income taxes - Adjusted 12.7 19.1 19.7 1.3 1.7 59.3 (49.3) 33.4 27.1 81.0 52.8 45.0 Depreciation and amortization - Adjusted 33.4 33.1 32.0 33.9 35.0 33.6 30.6 32.6 32.9 129.1 132.4 131.9 Adjusted Net Income (Loss) 45.7 40.7 27.2 13.7 10.0 (112.9) 110.3 71.6 128.9 316.7 127.3 79.0 Wtd Avg Shares - Diluted (000) 41,762 41,104 40,410 39,434 38,632 38,243 38,421 38,954 39,479 43,666 40,710 38,351 Adjusted EPS - Diluted ($) 1.09 0.99 0.67 0.35 0.26 (2.95) 2.87 1.84 3.27 7.25 3.13 2.05 Adjustments by Statement of Operations Caption Cost of sales - - - 0.4 - - - - - 1.8 0.4 - SG&A and Impairment Charges 11.5 14.5 14.1 34.6 58.9 9.3 3.6 11.7 8.6 30.8 74.7 83.5 Acquisition purchase price hedge (gain) loss - - - - - - - (7.3) 55.0 - - (7.3) Other expense (income), net (0.2) - - (3.0) (0.4) (0.4) 1.0 (0.6) (0.2) (0.5) (3.2) (0.3) Total EBITDA Adjustments 11.3 14.5 14.1 32.1 58.5 8.9 4.6 3.8 63.4 32.3 71.9 75.9 Free Cash Flow Reconciliation Cash provided by (used in) operating activities 153.2 80.8 40.9 47.6 (5.8) 81.6 51.9 127.6 51.0 366.5 322.5 255.4 Capital expenditures (25.0) (22.6) (23.6) (38.9) (24.3) (23.8) (12.7) (21.4) (12.6) (121.4) (110.1) (82.3) Free Cash Flow 128.2 58.2 17.3 97.5 (30.1) 57.8 39.2 106.2 38.4 245.1 212.4 173.1 |
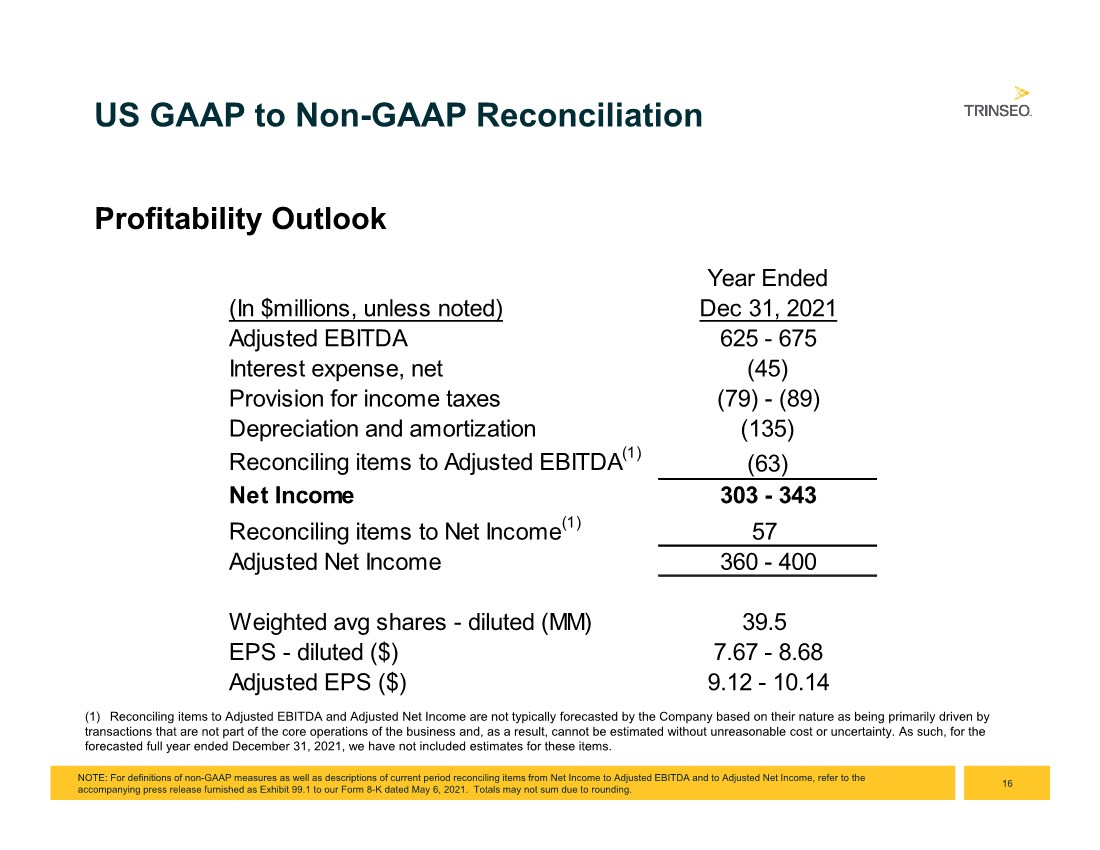
| 16 US GAAP to Non-GAAP Reconciliation NOTE: For definitions of non-GAAP measures as well as descriptions of current period reconciling items from Net Income to Adjusted EBITDA and to Adjusted Net Income, refer to the accompanying press release furnished as Exhibit 99.1 to our Form 8-K dated May 6, 2021. Totals may not sum due to rounding. Profitability Outlook (1) Reconciling items to Adjusted EBITDA and Adjusted Net Income are not typically forecasted by the Company based on their nature as being primarily driven by transactions that are not part of the core operations of the business and, as a result, cannot be estimated without unreasonable cost or uncertainty. As such, for the forecasted full year ended December 31, 2021, we have not included estimates for these items. Year Ended (In $millions, unless noted) Dec 31, 2021 Adjusted EBITDA 625 - 675 Interest expense, net (45) Provision for income taxes (79) - (89) Depreciation and amortization (135) Reconciling items to Adjusted EBITDA(1) (63) Net Income 303 - 343 Reconciling items to Net Income(1) 57 Adjusted Net Income 360 - 400 Weighted avg shares - diluted (MM) 39.5 EPS - diluted ($) 7.67 - 8.68 Adjusted EPS ($) 9.12 - 10.14 |