Attached files
| file | filename |
|---|---|
| EX-99.1 - EX-99.1 - Ready Capital Corp | rc-20210506xex99d1.htm |
| 8-K - 8-K - Ready Capital Corp | rc-20210506x8k.htm |
Exhibit 99.2
| Supplemental Financial Data First Quarter 2021 |

| DISCLAIMER 2 This presentation contains statements that constitute "forward-looking statements," as such term is defined in Section 27A of the Securities Act of 1933, as amended, and Section 21E of the Securities Exchange Act of 1934, as amended, and such statements are intended to be covered by the safe harbor provided by the same. These statements are based on management's current expectations and beliefs and are subject to a number of trends and uncertainties that could cause actual results to differ materially from those described in the forward-looking statements; Ready Capital Corporation (the "Company") cangiveno assurance that its expectations will be attained. Factors that could cause actual results to differ materially from the Company's expectations include those set forth in the Risk Factors section of the most recent Annual Report on Form 10-K filed with the SEC and other reports filed by the Company with the SEC, copies of which are available on the SEC's website, www.sec.gov. The Company undertakes no obligation to update these statements for revisions or changes after the date of this release, except as required by law. This presentation includes certain non-GAAP financial measures, including Distributable earnings. These non-GAAP financial measures should be considered only as supplemental to, and not as superior to, financial measures in accordance with GAAP. Please refer to Appendix A for the most recent GAAP information. This presentation also contains market statistics and industry data which are subject to uncertainty and are not necessarily reflective of market conditions. These have been derived from third party sources and have not been independently verified by the Company or its affiliates. All material presented is compiled from sources believed to be reliable and current, but accuracy cannot be guaranteed. All data is as of March 31, 2021 unless otherwise noted. |
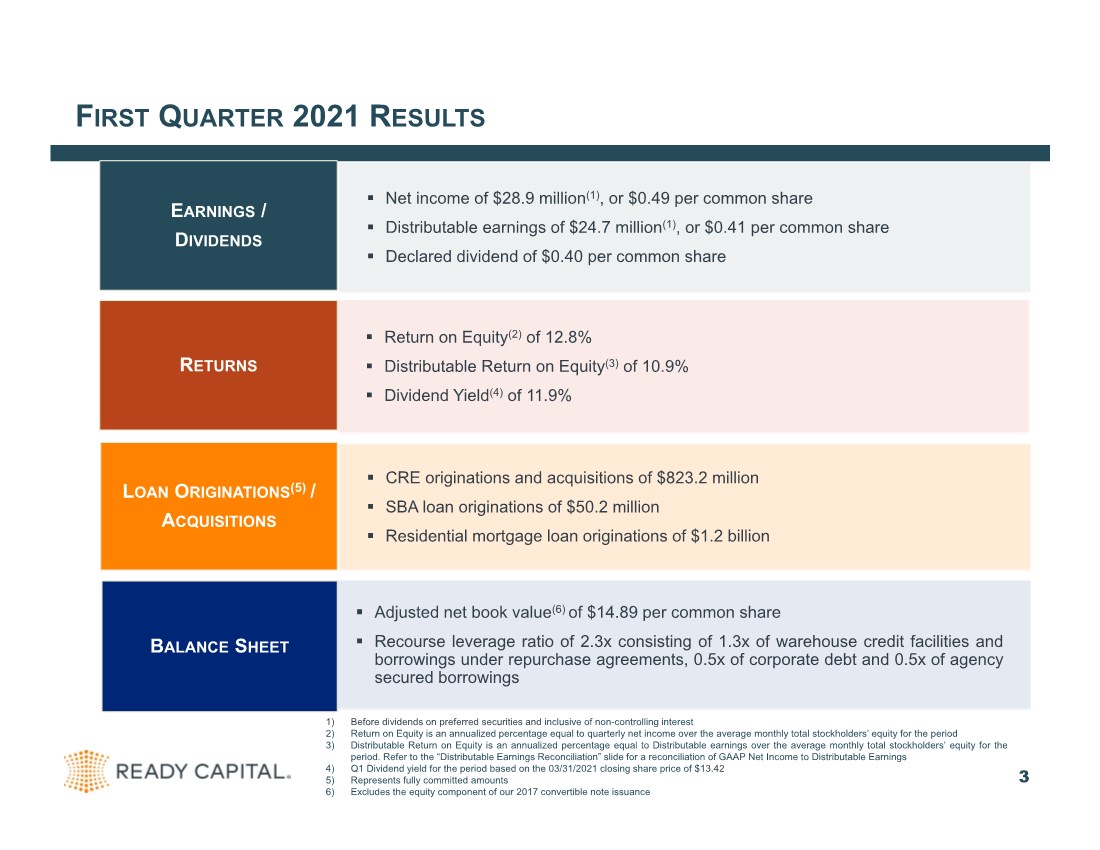
| FIRST QUARTER 2021 RESULTS 3 . Net income of $28.9 million(1), or $0.49 per common share . Distributable earnings of $24.7 million(1), or $0.41 per common share . Declared dividend of $0.40 per common share EARNINGS / DIVIDENDS . Return on Equity(2) of 12.8% . Distributable Return on Equity(3) of 10.9% . Dividend Yield(4) of 11.9% RETURNS . CRE originations and acquisitions of $823.2 million . SBA loan originations of $50.2 million . Residential mortgage loan originations of $1.2 billion LOAN ORIGINATIONS(5) / ACQUISITIONS . Adjusted net book value(6) of $14.89 per common share . Recourse leverage ratio of 2.3x consisting of 1.3x of warehouse credit facilities and borrowings under repurchase agreements, 0.5x of corporate debt and 0.5x of agency secured borrowings BALANCE SHEET 1) Before dividends on preferred securities and inclusive of non-controlling interest 2) Return on Equity is an annualized percentage equal to quarterly net income over the average monthly total stockholders’ equity for the period 3) Distributable Return on Equity is an annualized percentage equal to Distributable earnings over the average monthly total stockholders’ equity for the period. Refer to the “Distributable Earnings Reconciliation” slide for a reconciliation of GAAP Net Income to Distributable Earnings 4) Q1 Dividend yield for the period based on the 03/31/2021 closing share price of $13.42 5) Represents fully committed amounts 6) Excludes the equity component of our 2017 convertible note issuance |
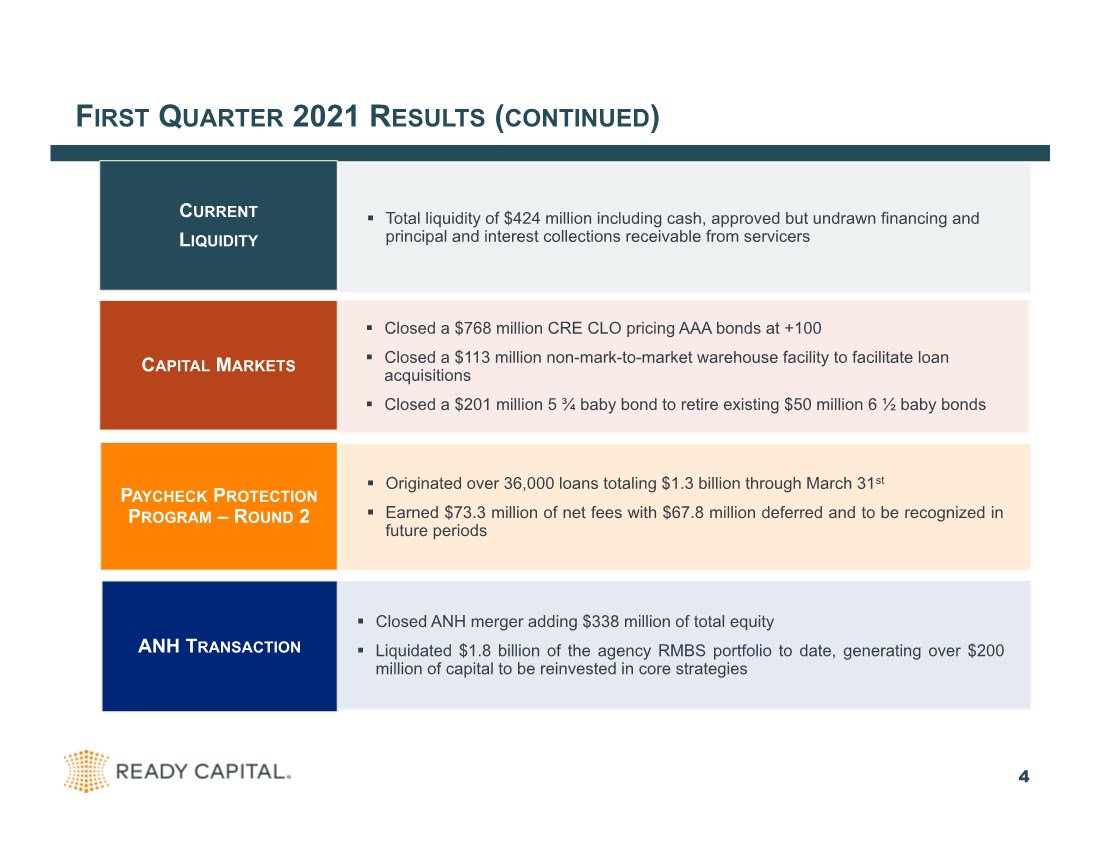
| FIRST QUARTER 2021 RESULTS (CONTINUED) 4 . Total liquidity of $424 million including cash, approved but undrawn financing and principal and interest collections receivable from servicers CURRENT LIQUIDITY . Closed a $768 million CRE CLO pricing AAA bonds at +100 . Closed a $113 million non-mark-to-market warehouse facility to facilitate loan acquisitions . Closed a $201 million 5 ¾ baby bond to retire existing $50 million 6 ½ baby bonds CAPITAL MARKETS . Originated over 36,000 loans totaling $1.3 billion through March 31st . Earned $73.3 million of net fees with $67.8 million deferred and to be recognized in future periods PAYCHECK PROTECTION PROGRAM –R OUND 2 . Closed ANH merger adding $338 million of total equity . Liquidated $1.8 billion of the agency RMBS portfolio to date, generating over $200 million of capital to be reinvested in core strategies ANH TRANSACTION |
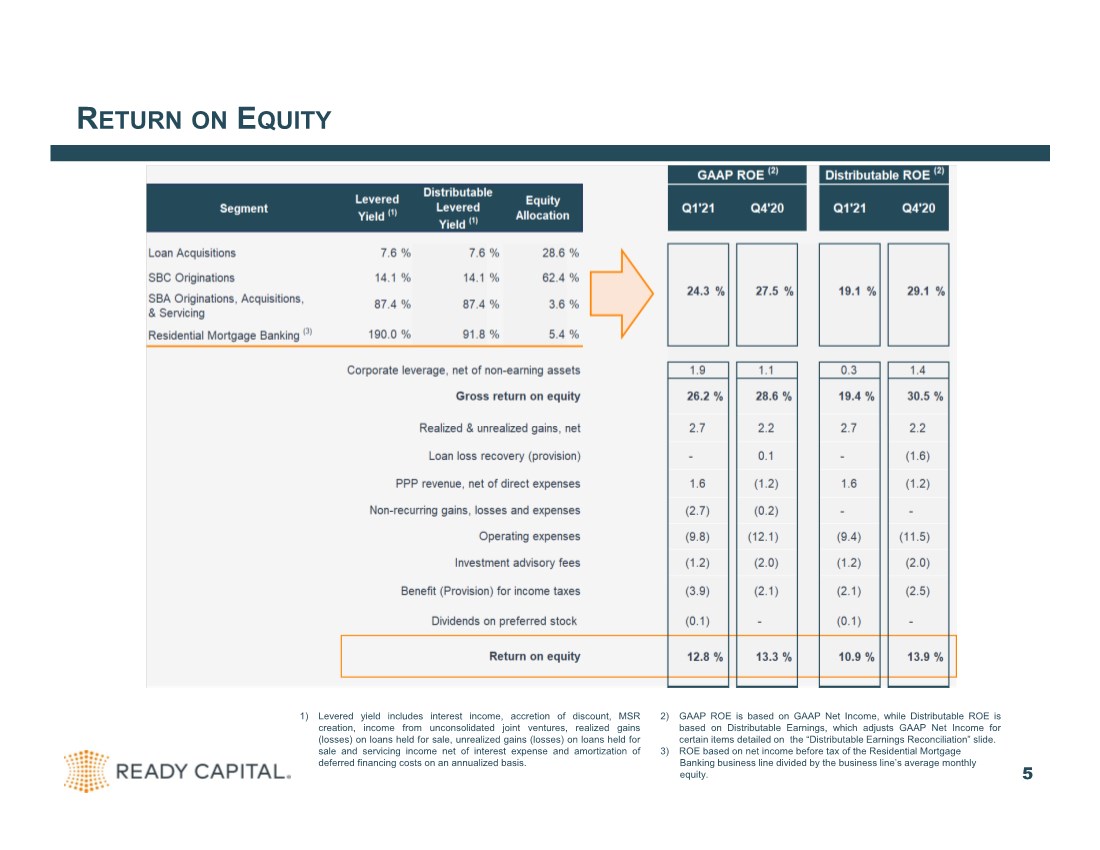
| RETURN ON EQUITY 5 1) Levered yield includes interest income, accretion of discount, MSR creation, income from unconsolidated joint ventures, realized gains (losses) on loans held for sale, unrealized gains (losses) on loans held for sale and servicing income net of interest expense and amortization of deferred financing costs on an annualized basis. 2) GAAP ROE is based on GAAP Net Income, while Distributable ROE is based on Distributable Earnings, which adjusts GAAP Net Income for certain items detailed on the “Distributable Earnings Reconciliation” slide. 3) ROE based on net income before tax of the Residential Mortgage Banking business line divided by the business line’s average monthly equity. |
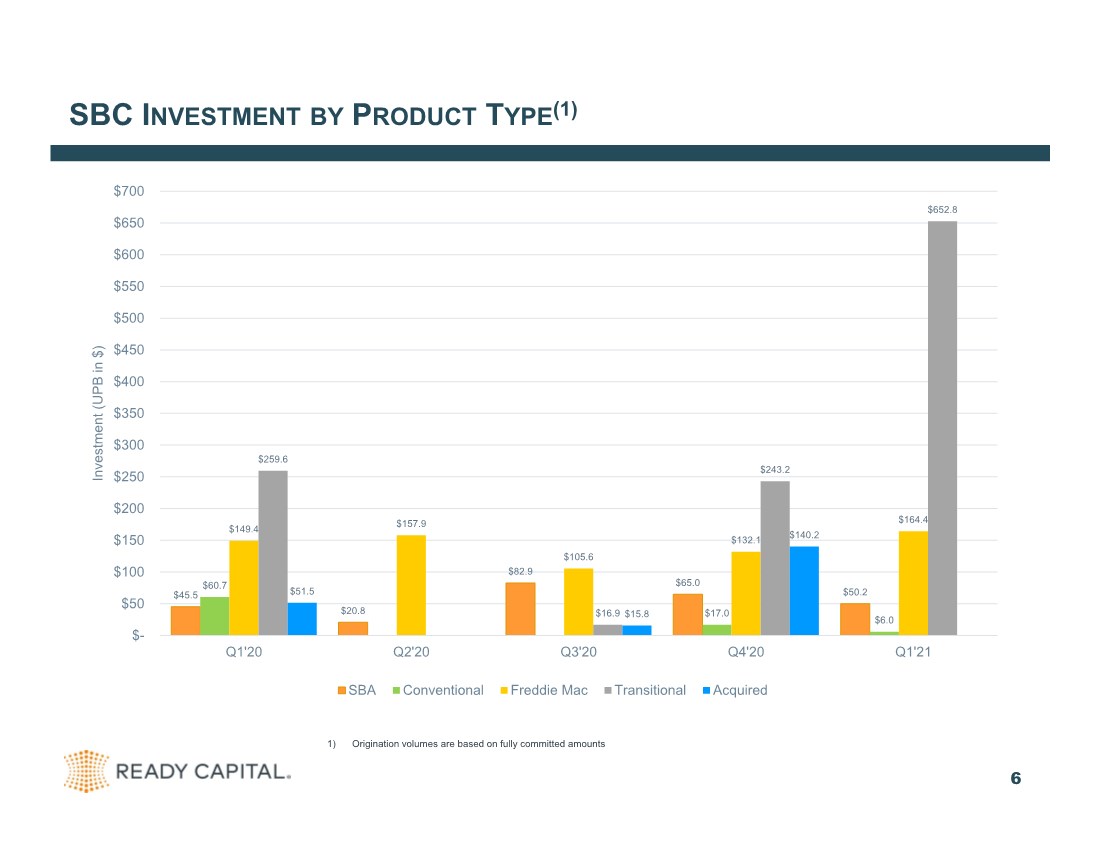
| SBC INVESTMENT BY PRODUCT TYPE(1) 6 1) Origination volumes are based on fully committed amounts $45.5 $20.8 $82.9 $65.0 $50.2 $60.7 $17.0 $6.0 $149.4 $157.9 $105.6 $132.1 $164.4 $259.6 $16.9 $243.2 $652.8 $51.5 $15.8 $140.2 $- $50 $100 $150 $200 $250 $300 $350 $400 $450 $500 $550 $600 $650 $700 Q1'20 Q2'20 Q3'20 Q4'20 Q1'21 Investment (UPB in $) SBA Conventional Freddie Mac Transitional Acquired |
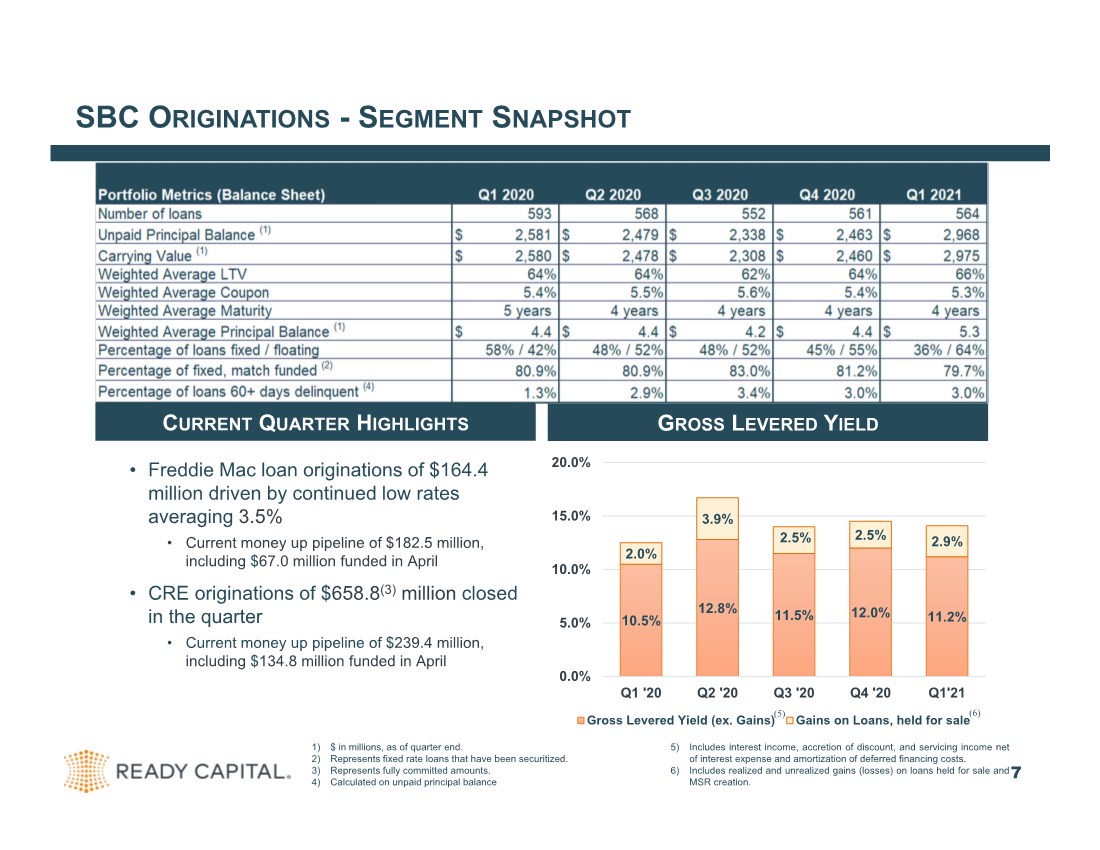
| SBC ORIGINATIONS -S EGMENT SNAPSHOT 7 1) $ in millions, as of quarter end. 2) Represents fixed rate loans that have been securitized. 3) Represents fully committed amounts. 4) Calculated on unpaid principal balance 5) Includes interest income, accretion of discount, and servicing income net of interest expense and amortization of deferred financing costs. 6) Includes realized and unrealized gains (losses) on loans held for sale and MSR creation. • Freddie Mac loan originations of $164.4 million driven by continued low rates averaging 3.5% • Current money up pipeline of $182.5 million, including $67.0 million funded in April • CRE originations of $658.8(3) million closed in the quarter • Current money up pipeline of $239.4 million, including $134.8 million funded in April 10.5% 12.8% 11.5% 12.0% 11.2% 2.0% 3.9% 2.5% 2.5% 2.9% 0.0% 5.0% 10.0% 15.0% 20.0% Q1 '20 Q2 '20 Q3 '20 Q4 '20 Q1'21 Gross Levered Yield (ex. Gains) Gains on Loans, held for sale GROSS LEVERED YIELD CURRENT QUARTER HIGHLIGHTS (5) (6) |
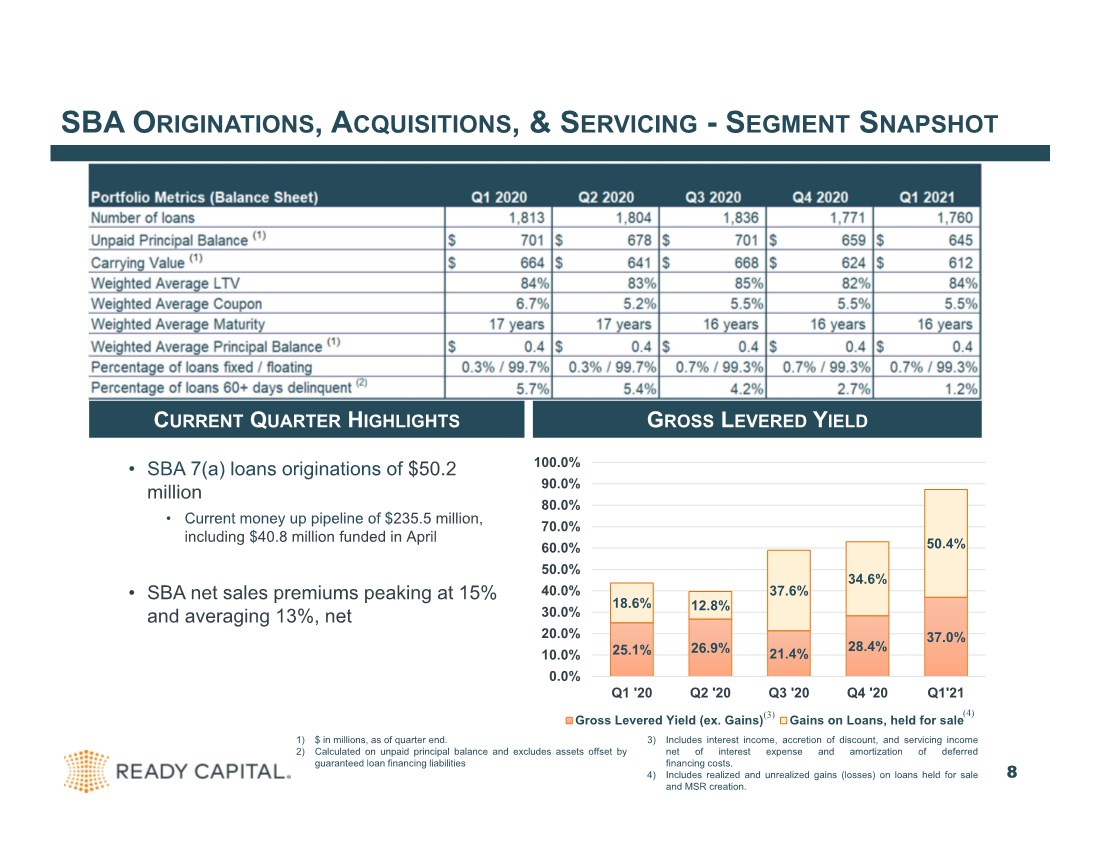
| SBA ORIGINATIONS, ACQUISITIONS, & SERVICING -S EGMENT SNAPSHOT 8 1) $ in millions, as of quarter end. 2) Calculated on unpaid principal balance and excludes assets offset by guaranteed loan financing liabilities 3) Includes interest income, accretion of discount, and servicing income net of interest expense and amortization of deferred financing costs. 4) Includes realized and unrealized gains (losses) on loans held for sale and MSR creation. • SBA 7(a) loans originations of $50.2 million • Current money up pipeline of $235.5 million, including $40.8 million funded in April • SBA net sales premiums peaking at 15% and averaging 13%, net 25.1% 26.9% 21.4% 28.4% 37.0% 18.6% 12.8% 37.6% 34.6% 50.4% 0.0% 10.0% 20.0% 30.0% 40.0% 50.0% 60.0% 70.0% 80.0% 90.0% 100.0% Q1 '20 Q2 '20 Q3 '20 Q4 '20 Q1'21 Gross Levered Yield (ex. Gains) Gains on Loans, held for sale CURRENT QUARTER HIGHLIGHTS GROSS LEVERED YIELD (3) (4) |
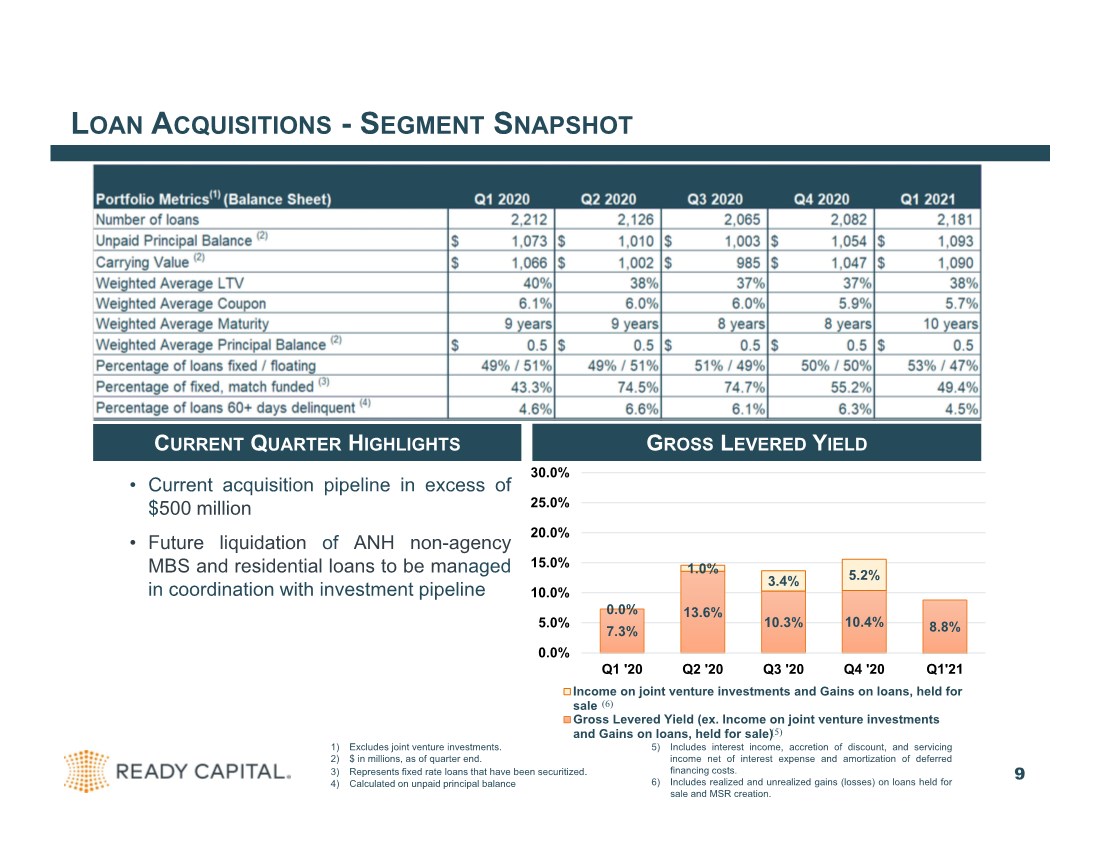
| LOAN ACQUISITIONS -S EGMENT SNAPSHOT 9 1) Excludes joint venture investments. 2) $ in millions, as of quarter end. 3) Represents fixed rate loans that have been securitized. 4) Calculated on unpaid principal balance 5) Includes interest income, accretion of discount, and servicing income net of interest expense and amortization of deferred financing costs. 6) Includes realized and unrealized gains (losses) on loans held for sale and MSR creation. • Current acquisition pipeline in excess of $500 million • Future liquidation of ANH non-agency MBS and residential loans to be managed in coordination with investment pipeline 7.3% 13.6% 10.3% 10.4% 8.8% 0.0% 1.0% 3.4% 5.2% 0.0% 5.0% 10.0% 15.0% 20.0% 25.0% 30.0% Q1 '20 Q2 '20 Q3 '20 Q4 '20 Q1'21 Income on joint venture investments and Gains on loans, held for sale Gross Levered Yield (ex. Income on joint venture investments and Gains on loans, held for sale) (5) CURRENT QUARTER HIGHLIGHTS GROSS LEVERED YIELD (6) |
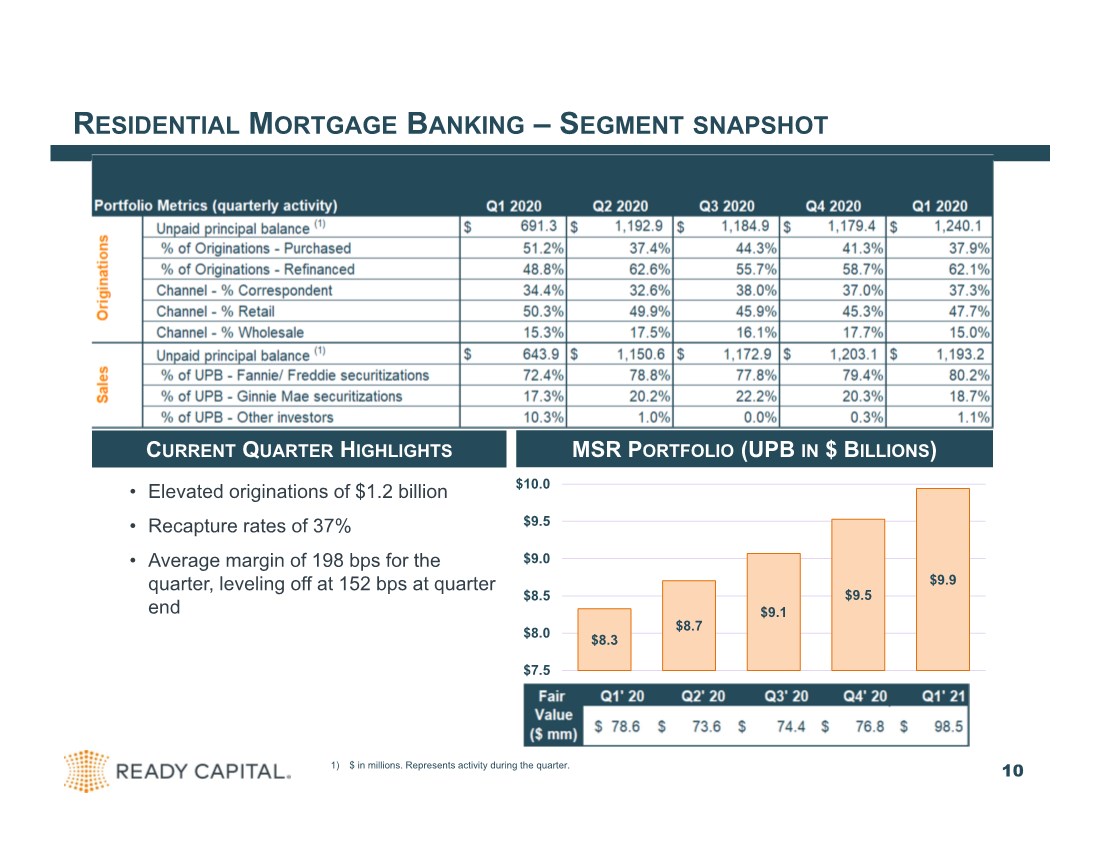
| RESIDENTIAL MORTGAGE BANKING –S EGMENT SNAPSHOT 10 1) $ in millions. Represents activity during the quarter. • Elevated originations of $1.2 billion • Recapture rates of 37% • Average margin of 198 bps for the quarter, leveling off at 152 bps at quarter end $8.3 $8.7 $9.1 $9.5 $9.9 $7.5 $8.0 $8.5 $9.0 $9.5 $10.0 MSR PORTFOLIO (UPB IN $ BILLIONS) CURRENT QUARTER HIGHLIGHTS |
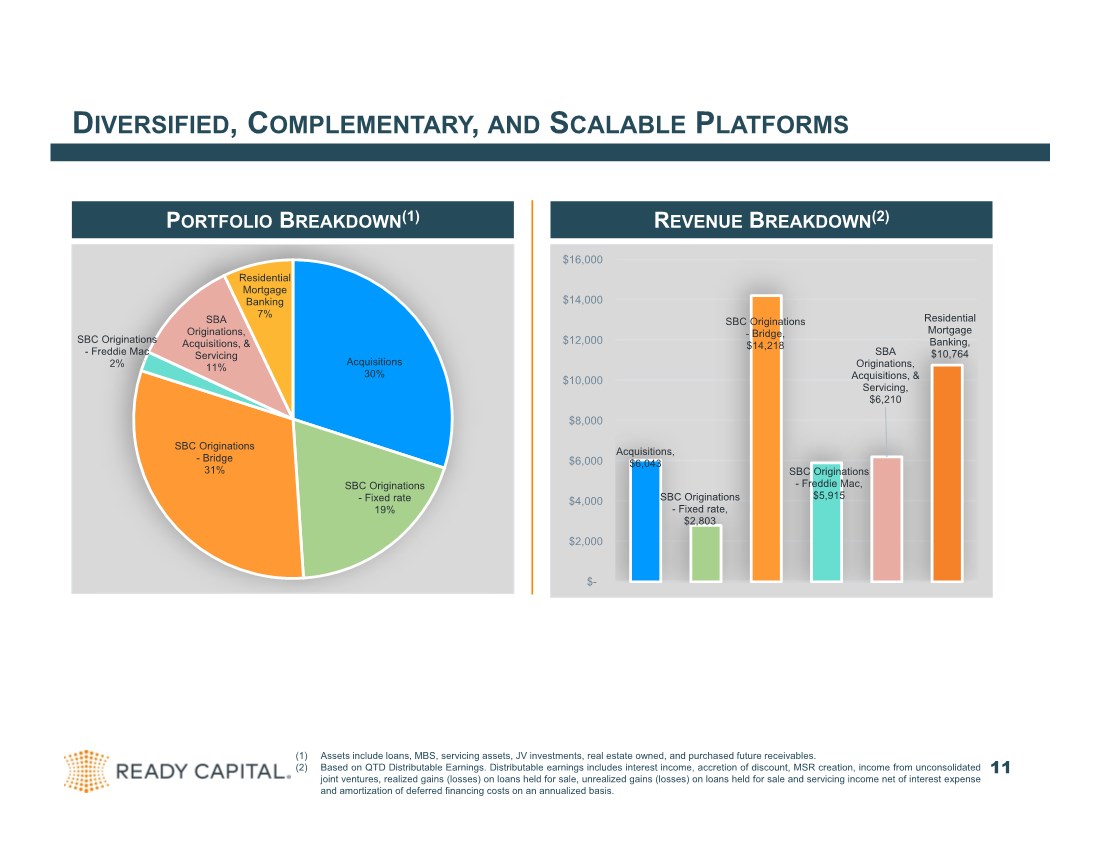
| DIVERSIFIED, COMPLEMENTARY, AND SCALABLE PLATFORMS (1) Assets include loans, MBS, servicing assets, JV investments, real estate owned, and purchased future receivables. (2) Based on QTD Distributable Earnings. Distributable earnings includes interest income, accretion of discount, MSR creation, income from unconsolidated joint ventures, realized gains (losses) on loans held for sale, unrealized gains (losses) on loans held for sale and servicing income net of interest expense and amortization of deferred financing costs on an annualized basis. (3) 11 PORTFOLIO BREAKDOWN(1) REVENUE BREAKDOWN(2) Acquisitions 30% SBC Originations - Fixed rate 19% SBC Originations - Bridge 31% SBC Originations - Freddie Mac 2% SBA Originations, Acquisitions, & Servicing 11% Residential Mortgage Banking 7% Acquisitions, $6,043 SBC Originations - Fixed rate, $2,803 SBC Originations - Bridge, $14,218 SBC Originations - Freddie Mac, $5,915 SBA Originations, Acquisitions, & Servicing, $6,210 Residential Mortgage Banking, $10,764 $- $2,000 $4,000 $6,000 $8,000 $10,000 $12,000 $14,000 $16,000 |
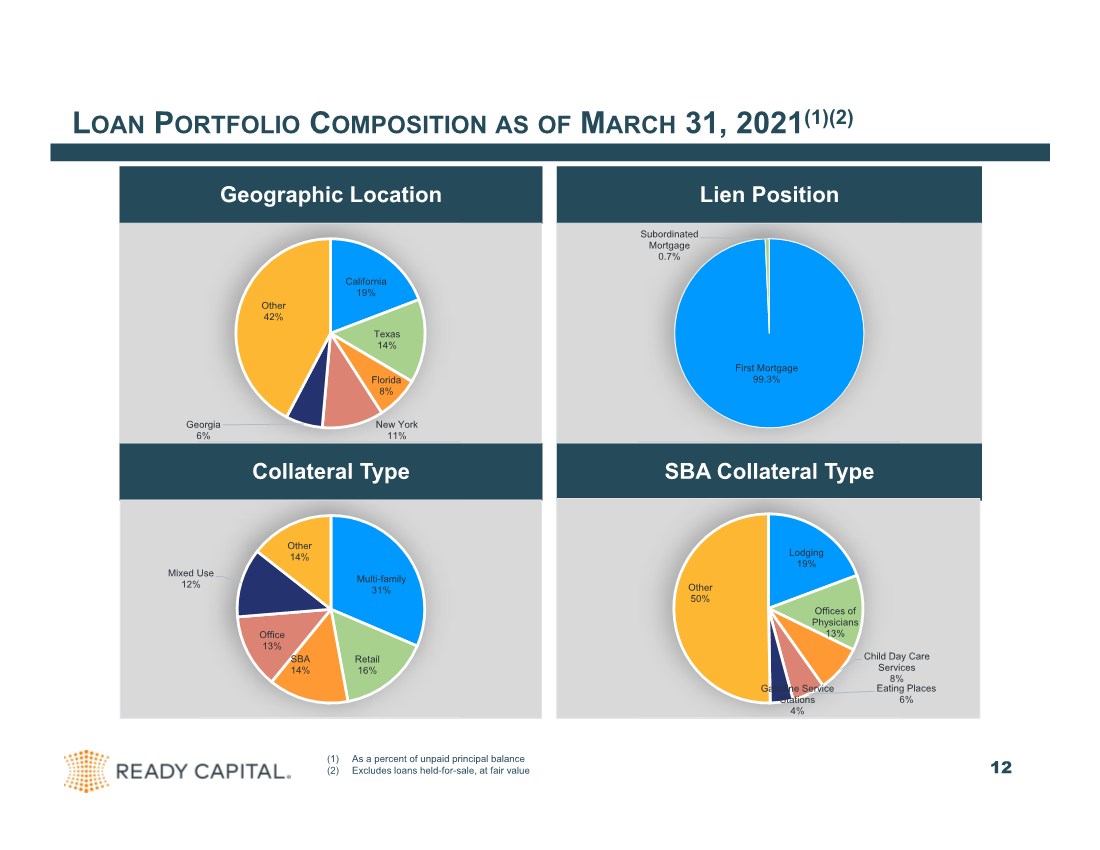
| LOAN PORTFOLIO COMPOSITION AS OF MARCH 31, 2021(1)(2) Geographic Location Lien Position (1) As a percent of unpaid principal balance (2) Excludes loans held-for-sale, at fair value (3) Collateral Type SBA Collateral Type 12 California 19% Texas 14% Florida 8% New York 11% Georgia 6% Other 42% First Mortgage 99.3% Subordinated Mortgage 0.7% Multi-family 31% Retail 16% SBA 14% Office 13% Mixed Use 12% Other 14% Lodging 19% Offices of Physicians 13% Child Day Care Services 8% Eating Places 6% Gasoline Service Stations 4% Other 50% |
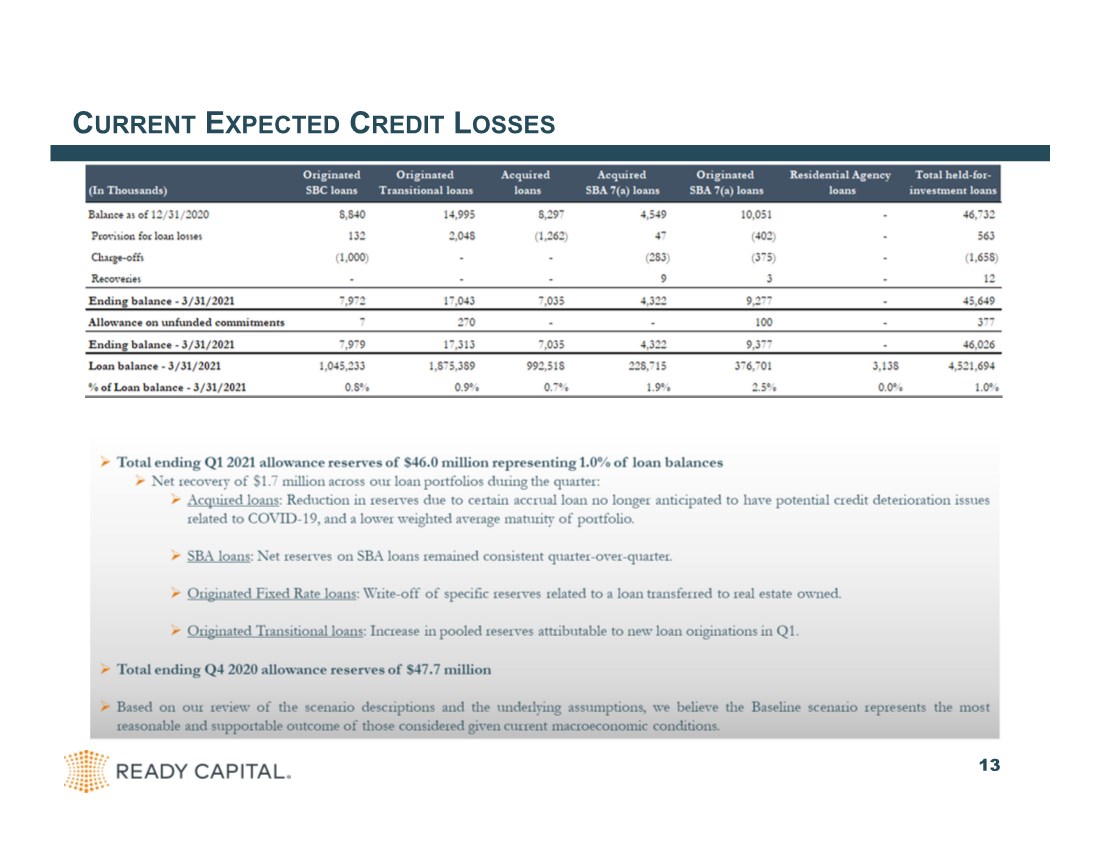
| 13 CURRENT EXPECTED CREDIT LOSSES |
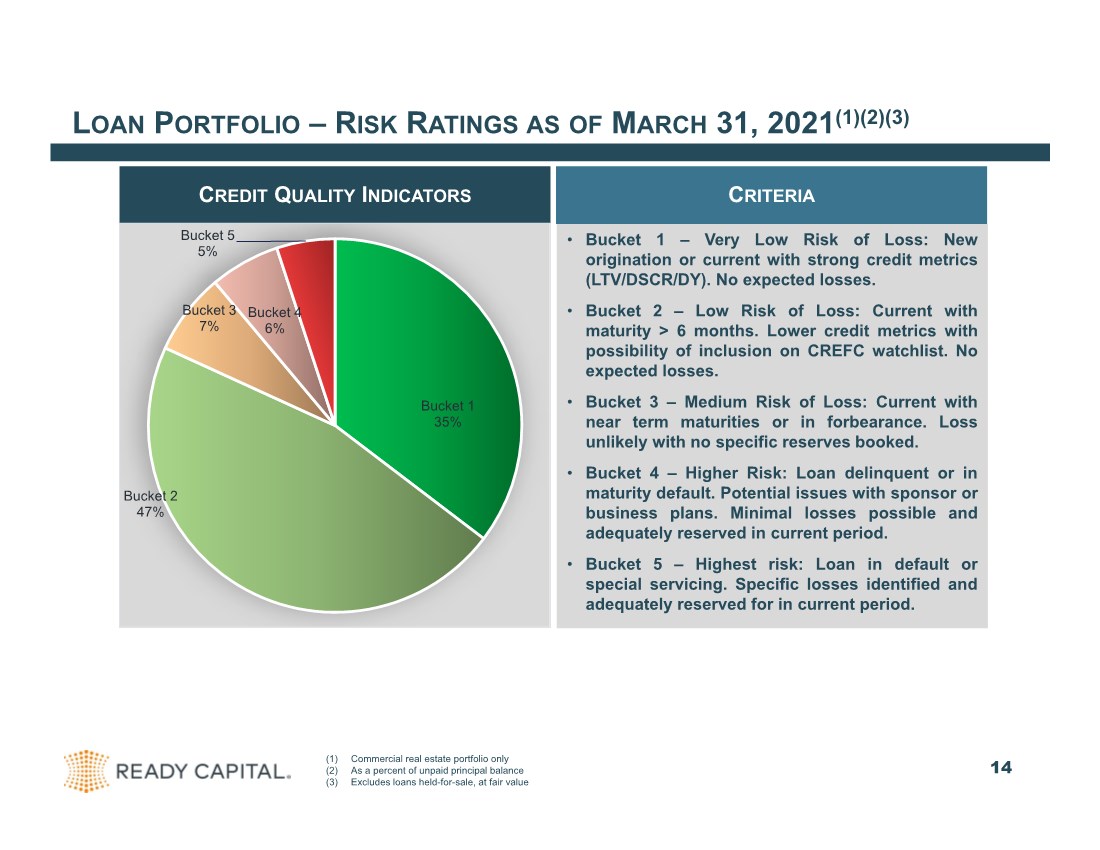
| LOAN PORTFOLIO –R ISK RATINGS AS OF MARCH 31, 2021(1)(2)(3) CREDIT QUALITY INDICATORS (1) Commercial real estate portfolio only (2) As a percent of unpaid principal balance (3) Excludes loans held-for-sale, at fair value 14 Bucket 1 35% Bucket 2 47% Bucket 3 7% Bucket 4 6% Bucket 5 5% CRITERIA • Bucket 1 – Very Low Risk of Loss: New origination or current with strong credit metrics (LTV/DSCR/DY). No expected losses. • Bucket 2 – Low Risk of Loss: Current with maturity > 6 months. Lower credit metrics with possibility of inclusion on CREFC watchlist. No expected losses. • Bucket 3 – Medium Risk of Loss: Current with near term maturities or in forbearance. Loss unlikely with no specific reserves booked. • Bucket 4 – Higher Risk: Loan delinquent or in maturity default. Potential issues with sponsor or business plans. Minimal losses possible and adequately reserved in current period. • Bucket 5 – Highest risk: Loan in default or special servicing. Specific losses identified and adequately reserved for in current period. |
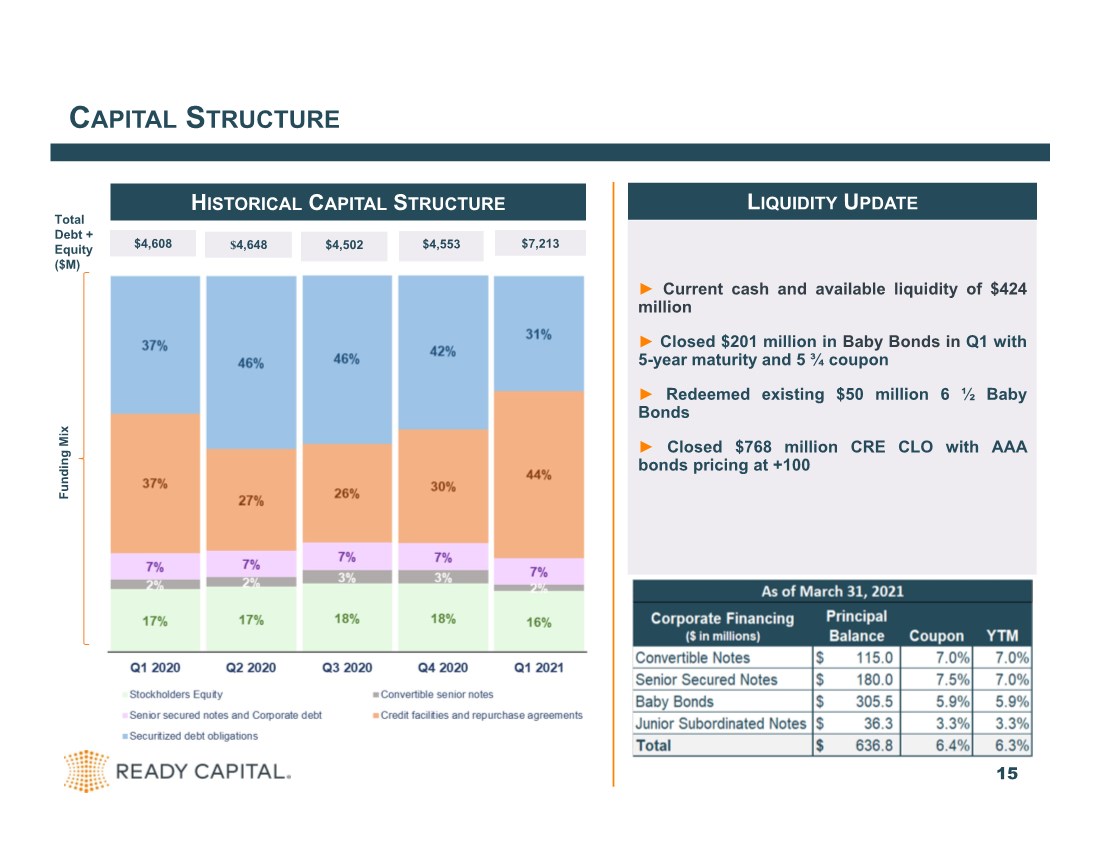
| CAPITAL STRUCTURE ► Current cash and available liquidity of $424 million ► Closed $201 million in Baby Bonds in Q1 with 5-year maturity and 5 ¾ coupon ► Redeemed existing $50 million 6 ½ Baby Bonds ► Closed $768 million CRE CLO with AAA bonds pricing at +100 15 Total Debt + Equity LIQUIDITY UPDATE HISTORICAL CAPITAL STRUCTURE Total Debt + Equity ($M) Funding Mix $4,608 $4,648 $4,502 $4,553 $7,213 |
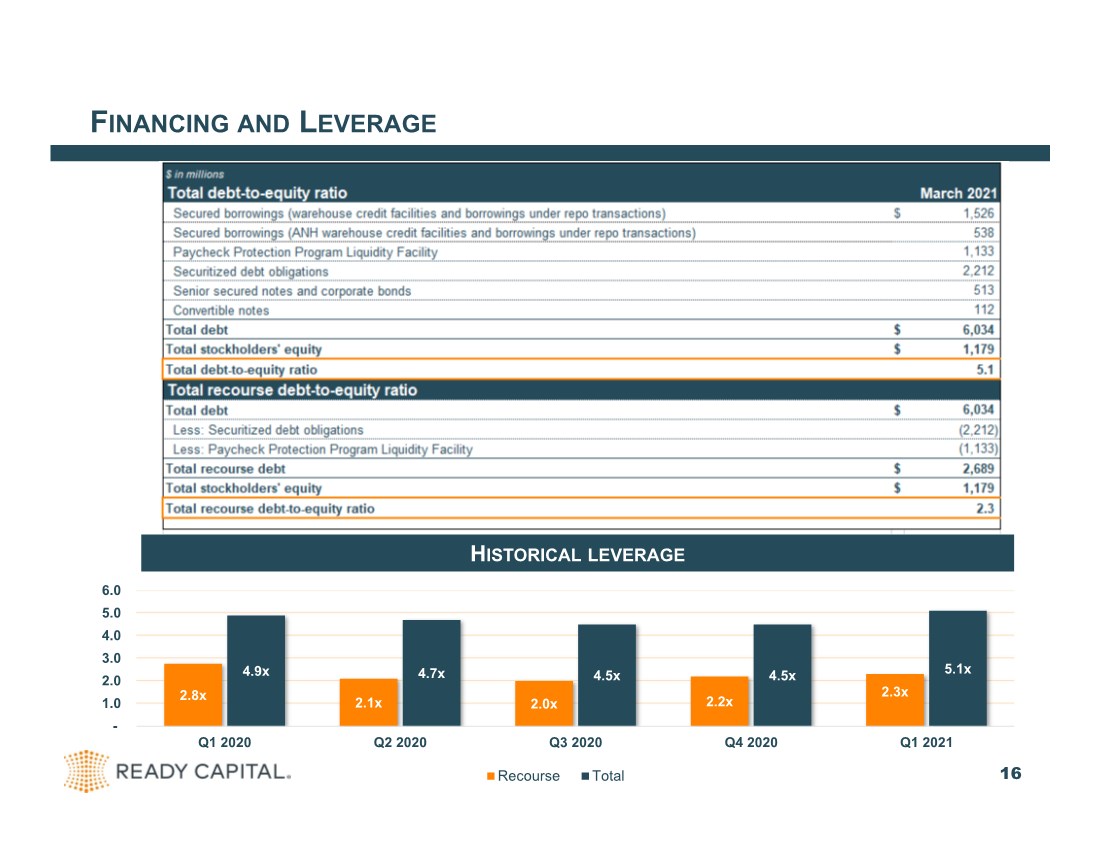
| FINANCING AND LEVERAGE 16 2.8x 2.1x 2.0x 2.2x 2.3x 4.9x 4.7x 4.5x 4.5x 5.1x - 1.0 2.0 3.0 4.0 5.0 6.0 Q1 2020 Q2 2020 Q3 2020 Q4 2020 Q1 2021 Historical Leverage Recourse Total HISTORICAL LEVERAGE |
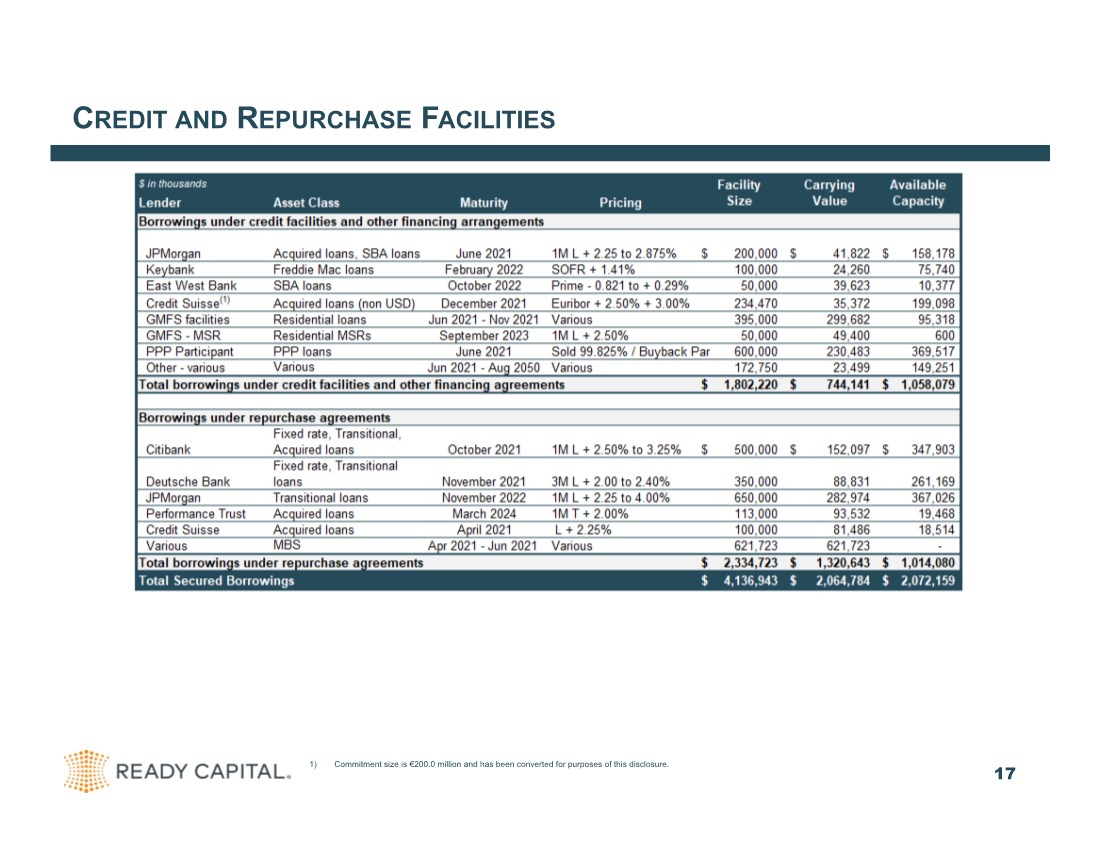
| CREDIT AND REPURCHASE FACILITIES 17 1) Commitment size is €200.0 million and has been converted for purposes of this disclosure. |
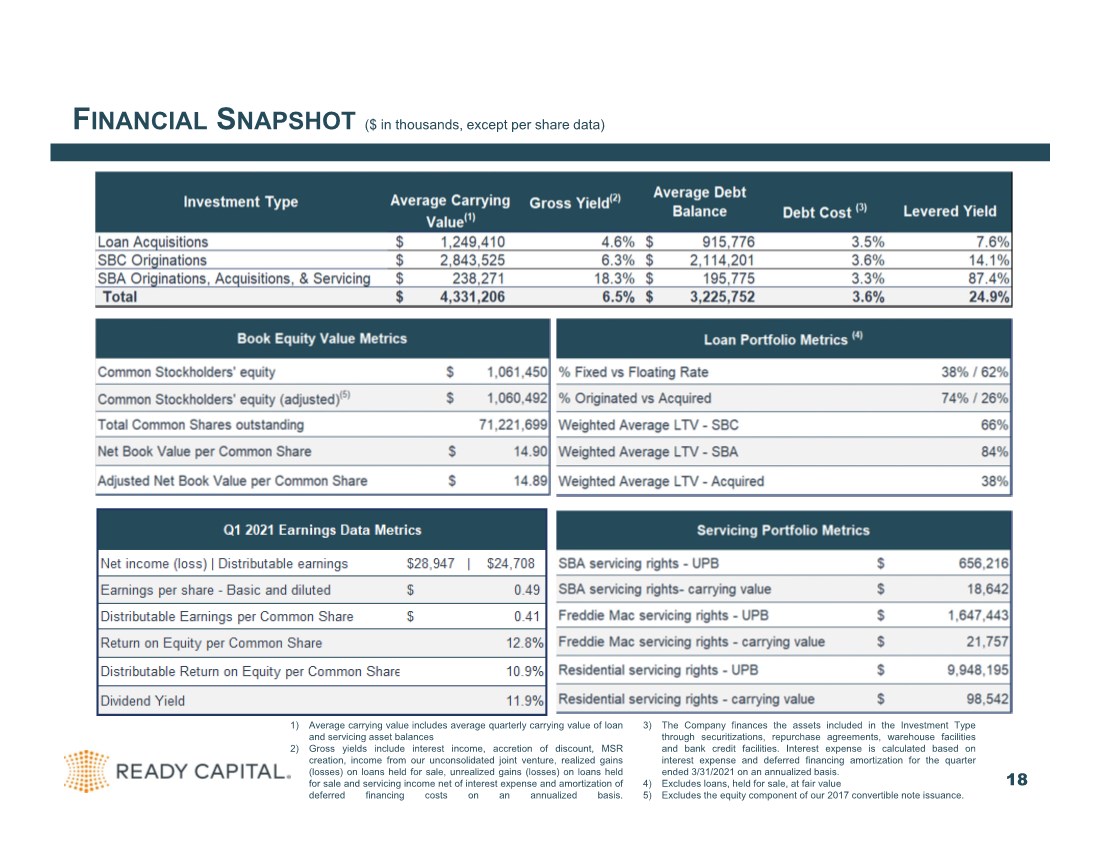
| FINANCIAL SNAPSHOT ($ in thousands, except per share data) 18 (5) Excludes the equity component of our 2017 convertible note issuance 1) Average carrying value includes average quarterly carrying value of loan and servicing asset balances 2) Gross yields include interest income, accretion of discount, MSR creation, income from our unconsolidated joint venture, realized gains (losses) on loans held for sale, unrealized gains (losses) on loans held for sale and servicing income net of interest expense and amortization of deferred financing costs on an annualized basis. 3) The Company finances the assets included in the Investment Type through securitizations, repurchase agreements, warehouse facilities and bank credit facilities. Interest expense is calculated based on interest expense and deferred financing amortization for the quarter ended 3/31/2021 on an annualized basis. 4) Excludes loans, held for sale, at fair value 5) Excludes the equity component of our 2017 convertible note issuance. |
| APPENDIX 19 |

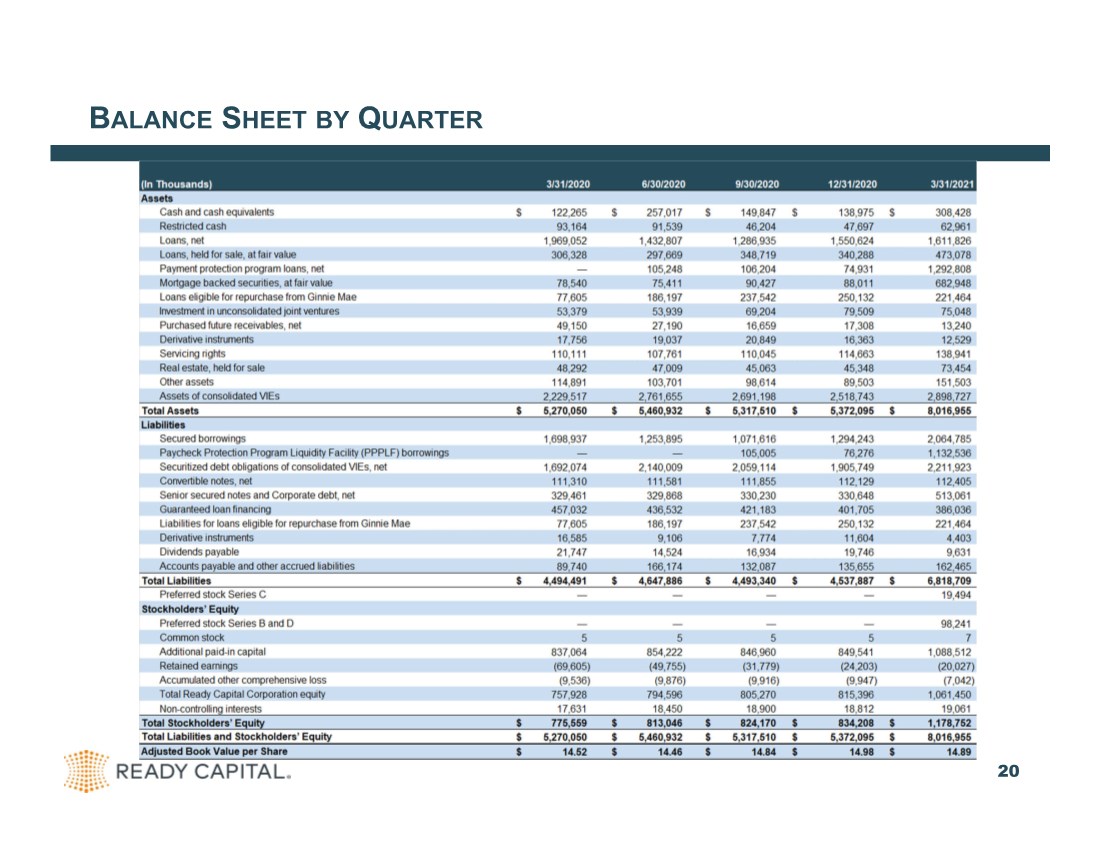
| BALANCE SHEET BY QUARTER 20 |
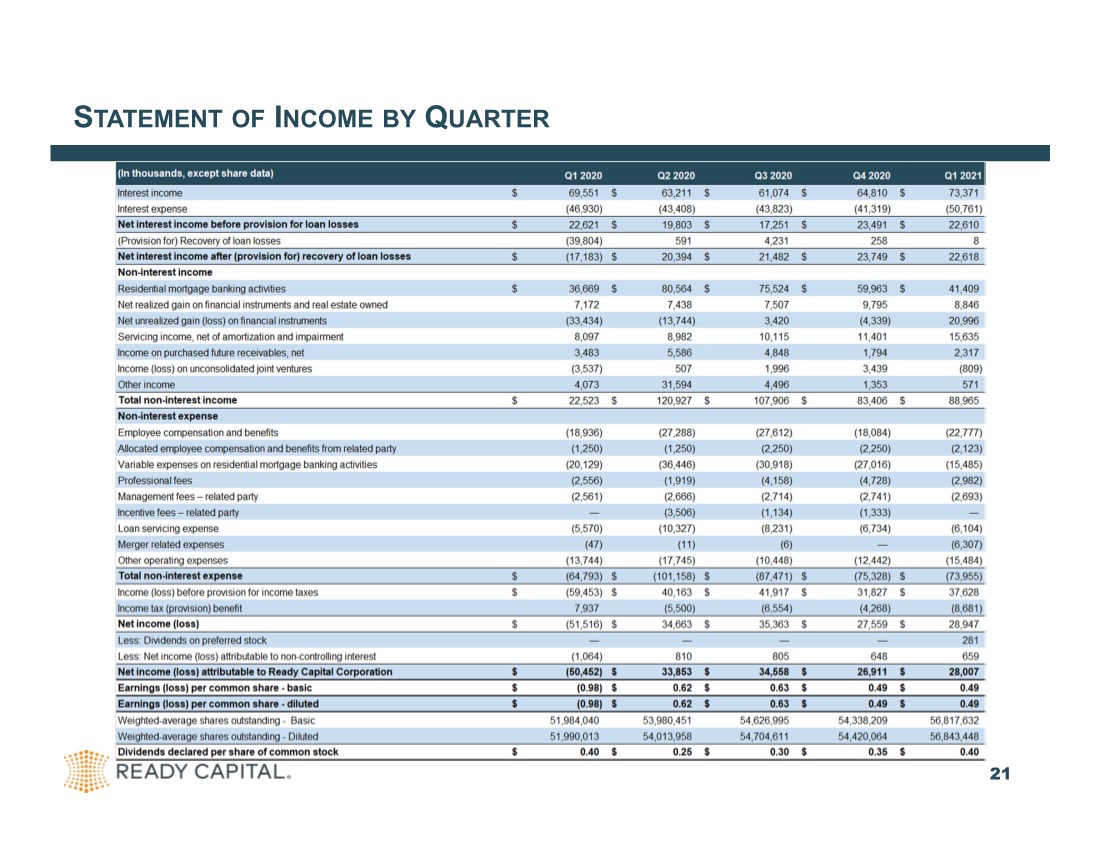
| STATEMENT OF INCOME BY QUARTER 21 (1) Certain balances have been reclassified to match current period presentation |
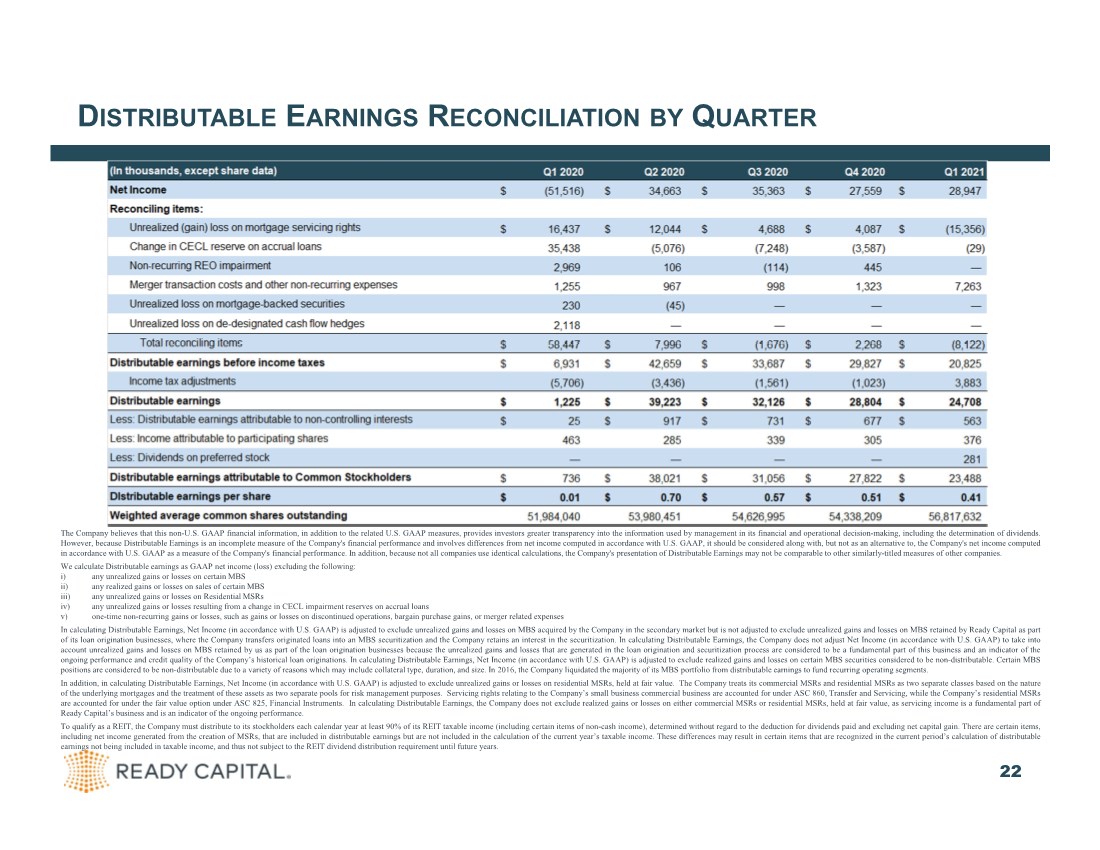
| DISTRIBUTABLE EARNINGS RECONCILIATION BY QUARTER 22 The Company believes that this non-U.S. GAAP financial information, in addition to the related U.S. GAAP measures, provides investors greater transparency into the information used by management in its financial and operational decision-making, including the determination of dividends. However, because Distributable Earnings is an incomplete measure of the Company's financial performance and involves differences from net income computed in accordance with U.S. GAAP, it should be considered along with, but not as an alternative to, the Company's net income computed in accordance with U.S. GAAP as a measure of the Company's financial performance. In addition, because not all companies use identical calculations, the Company's presentation of Distributable Earnings may not be comparable to other similarly-titled measures of other companies. We calculate Distributable earnings as GAAP net income (loss) excluding the following: i) any unrealized gains or losses on certain MBS ii) any realized gains or losses on sales of certain MBS iii) any unrealized gains or losses on Residential MSRs iv) any unrealized gains or losses resulting from a change in CECL impairment reserves on accrual loans v) one-time non-recurring gains or losses, such as gains or losses on discontinued operations, bargain purchase gains, or merger related expenses In calculating Distributable Earnings, Net Income (in accordance with U.S. GAAP) is adjusted to exclude unrealized gains and losses on MBS acquired by the Company in the secondary market but is not adjusted to exclude unrealized gains and losses on MBS retained by Ready Capital as part of its loan origination businesses, where the Company transfers originated loans into an MBS securitization and the Company retains an interest in the securitization. In calculating Distributable Earnings, the Company does not adjust Net Income (in accordance with U.S. GAAP) to take into account unrealized gains and losses on MBS retained by us as part of the loan origination businesses because the unrealized gains and losses that are generated in the loan origination and securitization process are considered to be a fundamental part of this business and an indicator of the ongoing performance and credit quality of the Company’s historical loan originations. In calculating Distributable Earnings, Net Income (in accordance with U.S. GAAP) is adjusted to exclude realized gains and losses on certain MBS securities considered to be non-distributable. Certain MBS positions are considered to be non-distributable due to a variety of reasons which may include collateral type, duration, and size. In 2016, the Company liquidated the majority of its MBS portfolio from distributable earnings to fund recurring operating segments. In addition, in calculating Distributable Earnings, Net Income (in accordance with U.S. GAAP) is adjusted to exclude unrealized gains or losses on residential MSRs, held at fair value. The Company treats its commercial MSRs and residential MSRs as two separate classes based on the nature of the underlying mortgages and the treatment of these assets as two separate pools for risk management purposes. Servicing rights relating to the Company’s small business commercial business are accounted for under ASC 860, Transfer and Servicing, while the Company’s residential MSRs are accounted for under the fair value option under ASC 825, Financial Instruments. In calculating Distributable Earnings, the Company does not exclude realized gains or losses on either commercial MSRs or residential MSRs, held at fair value, as servicing income is a fundamental part of Ready Capital’s business and is an indicator of the ongoing performance. To qualify as a REIT, the Company must distribute to its stockholders each calendar year at least 90% of its REIT taxable income (including certain items of non-cash income), determined without regard to the deduction for dividends paid and excluding net capital gain. There are certain items, including net income generated from the creation of MSRs, that are included in distributable earnings but are not included in the calculation of the current year’s taxable income. These differences may result in certain items that are recognized in the current period’s calculation of distributable earnings not being included in taxable income, and thus not subject to the REIT dividend distribution requirement until future years. |
|