Attached files
| file | filename |
|---|---|
| EX-99.1 - EX-99.1 - Prestige Consumer Healthcare Inc. | exhibit991fy21-q4earningsr.htm |
| 8-K - 8-K - Prestige Consumer Healthcare Inc. | pbh-20210506.htm |

Fourth Quarter & Full-Year FY 2021 Results May 6th, 2021 Exhibit 99.2

F O U R T H Q U A R T E R & F U L L - Y E A R F Y 2 1 R E S U L T S This presentation contains certain “forward-looking” statements within the meaning of the Private Securities Litigation Reform Act of 1995, such as statements regarding the Company’s expected financial performance, including revenues, EPS, free cash flow, and organic revenue growth; the Company’s ability to perform well in the currently evolving environment and execute on its brand-building strategy; the Company’s ability to reduce debt and increase profitability; the expected market share and consumption trends for the Company’s brands; and the Company’s disciplined capital allocation strategy. Words such as “trend,” “continue,” “will,” “expect,” “project,” “anticipate,” “focus,” “may,” “should,” “could,” “would,” and similar expressions identify forward-looking statements. Such forward-looking statements represent the Company’s expectations and beliefs and involve a number of known and unknown risks, uncertainties and other factors that may cause actual results to differ materially from those expressed or implied by such forward-looking statements. These factors include, among others, the impact of the COVID-19 pandemic, including on economic and business conditions, government actions, consumer trends, retail management initiatives, and disruptions to the distribution and supply chain; competitive pressures; the impact of the Company’s advertising and promotional and new product development initiatives; customer inventory management initiatives; fluctuating foreign exchange rates; and other risks set forth in Part I, Item 1A. Risk Factors in the Company’s Annual Report on Form 10-K for the year ended March 31, 2020. You are cautioned not to place undue reliance on these forward-looking statements, which speak only as of the date this presentation. Except to the extent required by applicable law, the Company undertakes no obligation to update any forward- looking statement contained in this presentation, whether as a result of new information, future events, or otherwise. All adjusted GAAP numbers presented are footnoted and reconciled to their closest GAAP measurement in the attached reconciliation schedule or in our May 6, 2021 earnings release in the “About Non-GAAP Financial Measures” section. Safe Harbor Disclosure 2

F O U R T H Q U A R T E R & F U L L - Y E A R F Y 2 1 R E S U L T S Agenda for Today’s Discussion I. FY 21 Recap II. Financial Overview III. FY 22 Outlook and The Road Ahead 3

F O U R T H Q U A R T E R & F U L L - Y E A R F Y 2 1 R E S U L T S I. FY 2021 Recap

F O U R T H Q U A R T E R & F U L L - Y E A R F Y 2 1 R E S U L T S Long-Term Strategy ◼ Brand-building designed to grow categories and connect with consumers ◼ Strategy and tactics performing well in an evolving environment Diverse Portfolio ◼ Capitalizing on current opportunities while investing for the long-term ◼ Investments in most relevant channels and media to drive consumer engagement Agile Marketing Financial Profile & Cash Flow ◼ Leading financial profile and cash flow generation ◼ Continued focus on optimizing capital allocation optionality 5 ◼ Portfolio of leading brands well-positioned in dynamic environment ◼ Trusted consumer brands driving market share growth Strategy and Execution Delivered Results
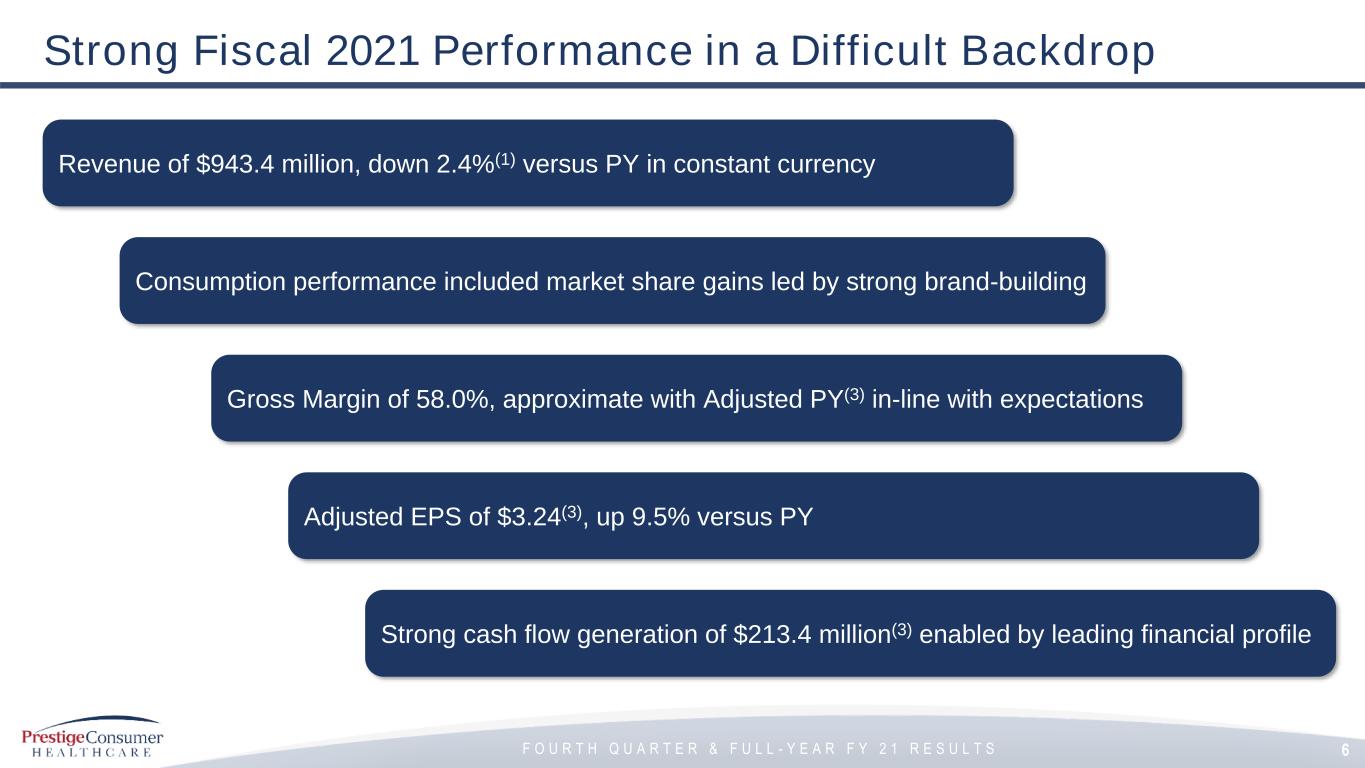
F O U R T H Q U A R T E R & F U L L - Y E A R F Y 2 1 R E S U L T S Revenue of $943.4 million, down 2.4%(1) versus PY in constant currency Gross Margin of 58.0%, approximate with Adjusted PY(3) in-line with expectations Strong cash flow generation of $213.4 million(3) enabled by leading financial profile Consumption performance included market share gains led by strong brand-building Adjusted EPS of $3.24(3), up 9.5% versus PY Strong Fiscal 2021 Performance in a Difficult Backdrop 6

F O U R T H Q U A R T E R & F U L L - Y E A R F Y 2 1 R E S U L T S Top PBH Brands Rank U.S. Market Share* FY’21 vs Category #1 50% #1 60% #1 100%/5%*** #1 35% #2 20% #1 60% #3 5% #1 55% #1 60% #1 40% #1 25% ** #1 90% *Approximate Market Share Reflects U.S. IRI MULO + C-store + Amazon for the 52 weeks ended 3-21-21 **Hydralyte is IRI Australia data for the Grocery and Pharmacy channel for the 52 weeks ended 3-14-21 ***Represents share in analgesic powders and analgesic tabs/powders respectively Majority of Brands Expanded Market-Leading Positions 10 of 12 Brands are #1 in Market Share, Many by a Wide Margin History of Winning Continued in FY’21 Continuing to Win Across Categories Through Brand Building 7

F O U R T H Q U A R T E R & F U L L - Y E A R F Y 2 1 R E S U L T S Nimble Marketing Approach Paid Off ◼ “Thank you” essential worker donations ◼ Consumer brand promise: Brighter, whiter, and more comfortable ◼ New campaign across all key touchpoints: TV, Social, YouTube, Web ◼ Leading innovation for the consumer in warts ◼ 70% of consumers who click are new to the brand ◼ Successfully shifted media mix towards digital, addressable TV ◼ Reaching consumers at home with relevant messaging during COVID-19 8 +7% vs. Category(2)+15% vs. Category(2)+5% vs. Category(2) Ship Your Cure to Your Door

F O U R T H Q U A R T E R & F U L L - Y E A R F Y 2 1 R E S U L T S Behavior Changes Began to be Lapped at Year-End CommentaryFY 21 Organic Revenue Breakdown (2.4%) 3.5% Total Excl. Impacted Brands Impacted Brands 9 Five brands drove significant impact to FY 21 revenue performance Affected brands continued to grow market share in aggregate Effects were partially offset by the diversity of leading brand portfolio FY 22 anticipates stable levels for category
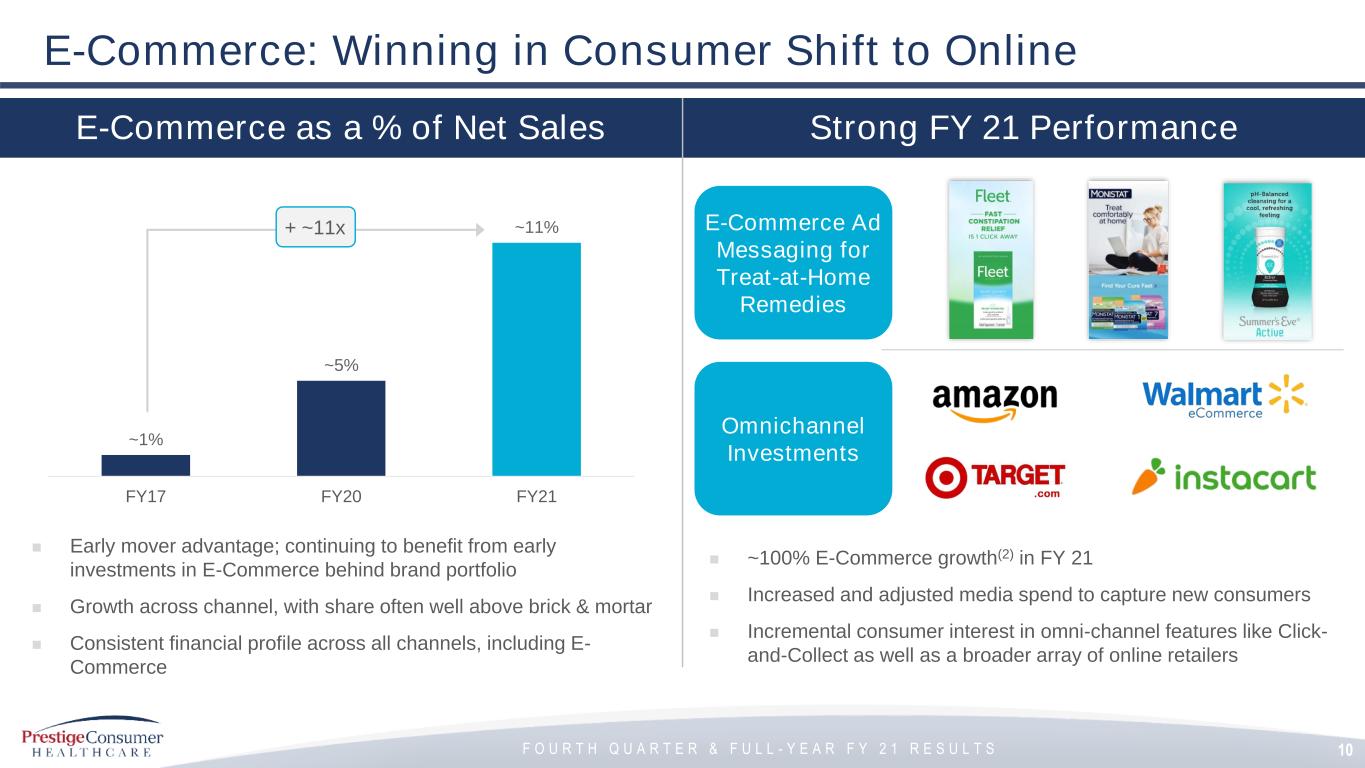
F O U R T H Q U A R T E R & F U L L - Y E A R F Y 2 1 R E S U L T S E-Commerce: Winning in Consumer Shift to Online Strong FY 21 PerformanceE-Commerce as a % of Net Sales ◼ ~100% E-Commerce growth(2) in FY 21 ◼ Increased and adjusted media spend to capture new consumers ◼ Incremental consumer interest in omni-channel features like Click- and-Collect as well as a broader array of online retailers ~1% ~5% ~11% FY17 FY20 FY21 ◼ Early mover advantage; continuing to benefit from early investments in E-Commerce behind brand portfolio ◼ Growth across channel, with share often well above brick & mortar ◼ Consistent financial profile across all channels, including E- Commerce + ~11x E-Commerce Ad Messaging for Treat-at-Home Remedies Omnichannel Investments 10

F O U R T H Q U A R T E R & F U L L - Y E A R F Y 2 1 R E S U L T S II. Financial Overview

F O U R T H Q U A R T E R & F U L L - Y E A R F Y 2 1 R E S U L T S Key Financial Results for Fourth Quarter and FY 21 Performance FY 21 FY 20 Dollar values in millions, except per share data. $237.8 $ 79.2 $0.79 $251.2 $85.9 $0.82 Revenue Adjusted EBITDA Adjusted EPS (5.4%) (7.8%) (3.9%) 12 Q 4 $943.4 $328.9 $3.24 $963.0 $328.1 $2.96 Revenue Adjusted EBITDA Adjusted EPS (2.0%) 0.3% 9.5% (3) Revenue of $237.8 million, down versus unusual PY Q4 Adjusted EPS(3) of $0.79 down slightly versus PY Q4 Q4 Adj. EBITDA(3) of $79.2 and 33.3% margin, consistent with long-term expectations F Y 2 1 (3) 12 (3) (3)
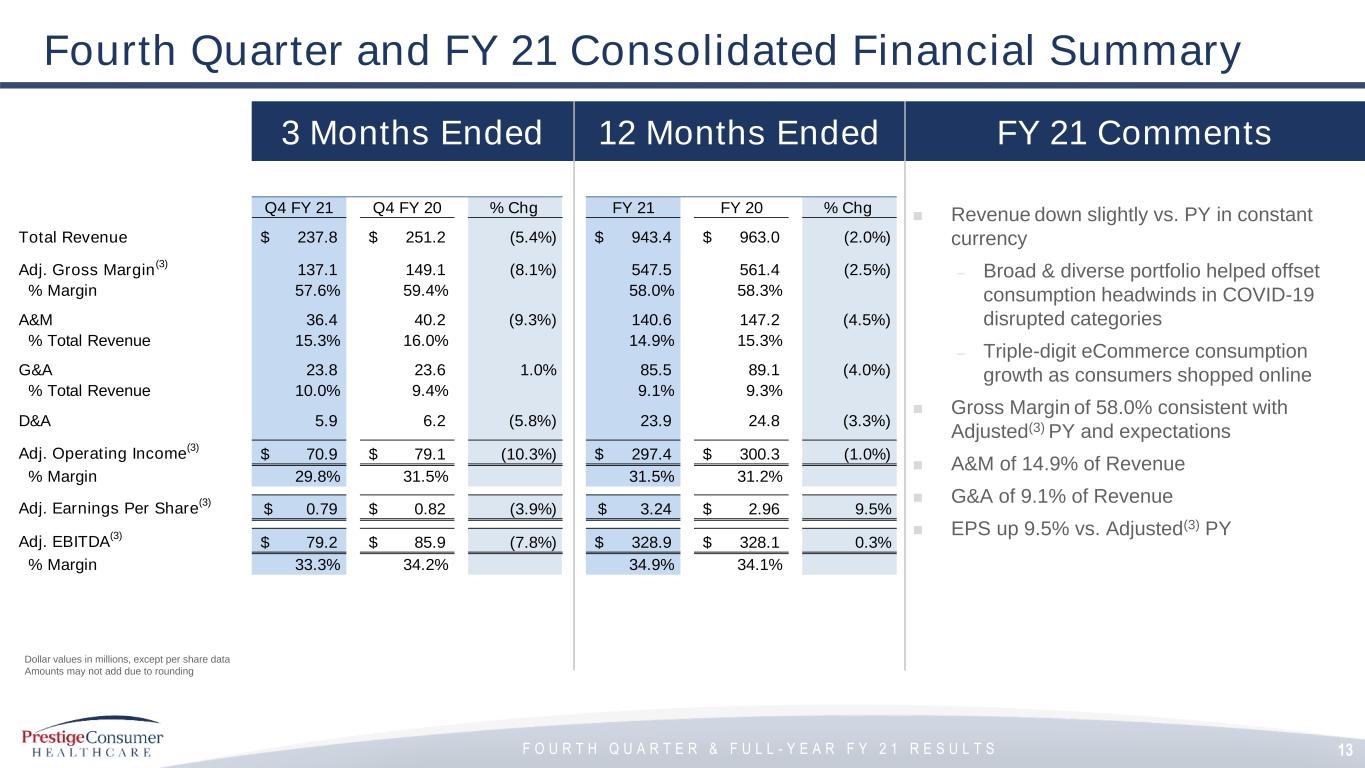
F O U R T H Q U A R T E R & F U L L - Y E A R F Y 2 1 R E S U L T S Q4 FY 21 Q4 FY 20 % Chg FY 21 FY 20 % Chg Total Revenue 237.8$ 251.2$ (5.4%) 943.4$ 963.0$ (2.0%) Adj. Gross Margin (3) 137.1 149.1 (8.1%) 547.5 561.4 (2.5%) % Margin 57.6% 59.4% 58.0% 58.3% A&M 36.4 40.2 (9.3%) 140.6 147.2 (4.5%) % Total Revenue 15.3% 16.0% 14.9% 15.3% G&A 23.8 23.6 1.0% 85.5 89.1 (4.0%) % Total Revenue 10.0% 9.4% 9.1% 9.3% D&A 5.9 6.2 (5.8%) 23.9 24.8 (3.3%) Adj. Operating Income (3) 70.9$ 79.1$ (10.3%) 297.4$ 300.3$ (1.0%) % Margin 29.8% 31.5% 31.5% 31.2% Adj. Earnings Per Share (3) 0.79$ 0.82$ (3.9%) 3.24$ 2.96$ 9.5% Adj. EBITDA (3) 79.2$ 85.9$ (7.8%) 328.9$ 328.1$ 0.3% % Margin 33.3% 34.2% 34.9% 34.1% 3 Months Ended FY 21 Comments Fourth Quarter and FY 21 Consolidated Financial Summary ◼ Revenue down slightly vs. PY in constant currency – Broad & diverse portfolio helped offset consumption headwinds in COVID-19 disrupted categories – Triple-digit eCommerce consumption growth as consumers shopped online ◼ Gross Margin of 58.0% consistent with Adjusted(3) PY and expectations ◼ A&M of 14.9% of Revenue ◼ G&A of 9.1% of Revenue ◼ EPS up 9.5% vs. Adjusted(3) PY Dollar values in millions, except per share data Amounts may not add due to rounding 13 12 Months Ended
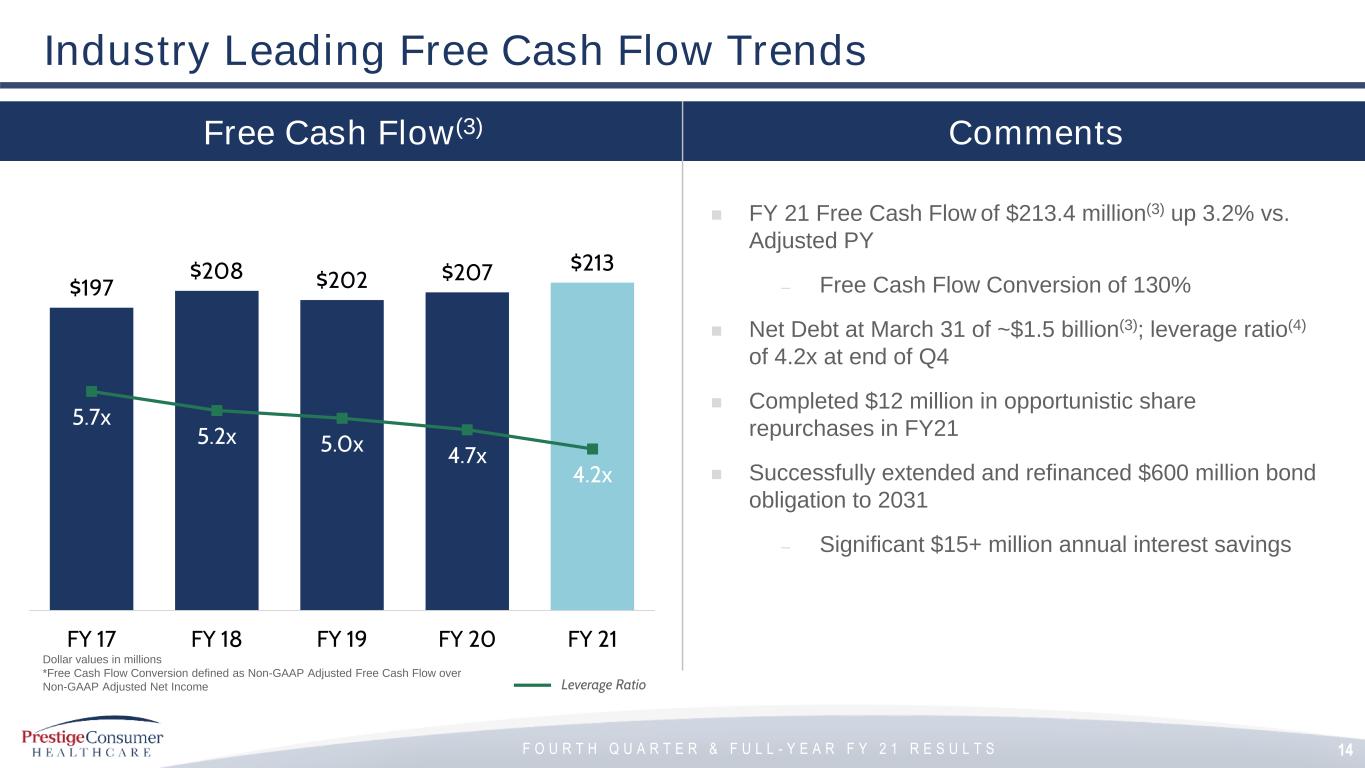
F O U R T H Q U A R T E R & F U L L - Y E A R F Y 2 1 R E S U L T S Free Cash Flow(3) Comments ◼ FY 21 Free Cash Flow of $213.4 million(3) up 3.2% vs. Adjusted PY – Free Cash Flow Conversion of 130% ◼ Net Debt at March 31 of ~$1.5 billion(3); leverage ratio(4) of 4.2x at end of Q4 ◼ Completed $12 million in opportunistic share repurchases in FY21 ◼ Successfully extended and refinanced $600 million bond obligation to 2031 – Significant $15+ million annual interest savings Industry Leading Free Cash Flow Trends Dollar values in millions *Free Cash Flow Conversion defined as Non-GAAP Adjusted Free Cash Flow over Non-GAAP Adjusted Net Income 14 $197 $208 $202 $207 $213 5.7x 5.2x 5.0x 4.7x 4.2x FY 17 FY 18 FY 19 FY 20 FY 21 Leverage Ratio

F O U R T H Q U A R T E R & F U L L - Y E A R F Y 2 1 R E S U L T S III. FY 21 Outlook
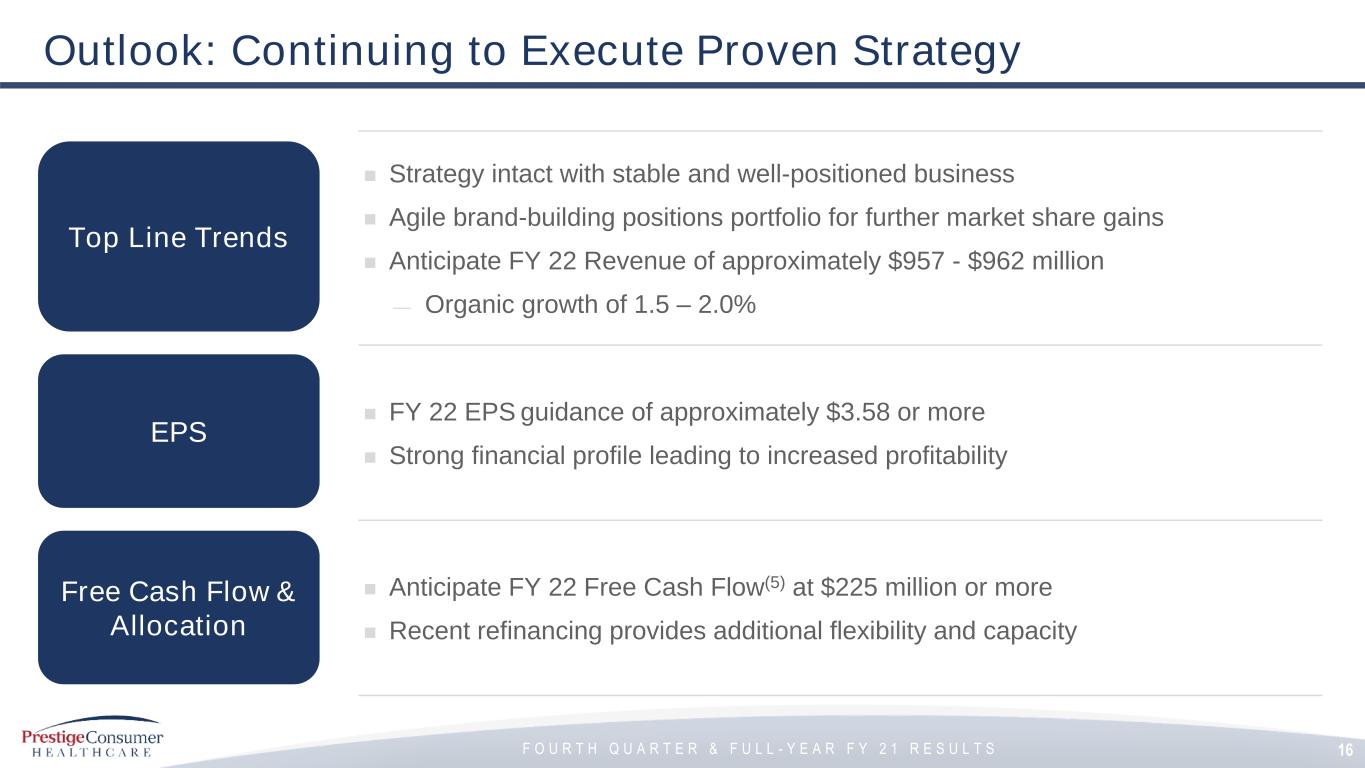
F O U R T H Q U A R T E R & F U L L - Y E A R F Y 2 1 R E S U L T S Outlook: Continuing to Execute Proven Strategy ◼ Strategy intact with stable and well-positioned business ◼ Agile brand-building positions portfolio for further market share gains ◼ Anticipate FY 22 Revenue of approximately $957 - $962 million — Organic growth of 1.5 – 2.0% ◼ FY 22 EPS guidance of approximately $3.58 or more ◼ Strong financial profile leading to increased profitability ◼ Anticipate FY 22 Free Cash Flow(5) at $225 million or more ◼ Recent refinancing provides additional flexibility and capacity Top Line Trends Free Cash Flow & Allocation EPS 16

F O U R T H Q U A R T E R & F U L L - Y E A R F Y 2 1 R E S U L T S Q&A

F O U R T H Q U A R T E R & F U L L - Y E A R F Y 2 1 R E S U L T S Appendix (1) Organic Revenue is a Non-GAAP financial measure and is reconciled to the most closely related GAAP financial measure in the attached Reconciliation Schedules and / or our earnings release dated May 6, 2021 in the “About Non-GAAP Financial Measures” section. (2) Company consumption includes data sourced from domestic IRI multi-outlet + C-Store retail sales for the period ending March 21, 2021, retail sales from other 3rd parties for certain untracked channels in North America for leading retailers, Australia consumption based on IMS data, and other international net revenues as a proxy for consumption. (3) Adjusted EPS, Adjusted Gross Margin, Adjusted Operating Income, EBITDA, EBITDA Margin, Free Cash Flow and Net Debt are Non-GAAP financial measures and are reconciled to their most closely related GAAP financial measures in the attached Reconciliation Schedules and / or in our earnings release dated May 6, 2021 in the “About Non-GAAP Financial Measures” section. (4) Leverage ratio reflects net debt / covenant defined EBITDA. (5) Adjusted Free Cash Flow for FY 22 is a projected Non-GAAP financial measure, is reconciled to projected GAAP Net Cash Provided by Operating Activities in the attached Reconciliation Schedules and / or in our earnings release in the “About Non-GAAP Financial Measures” section and is calculated based on projected Net Cash Provided by Operating Activities less projected capital expenditures. 18

F O U R T H Q U A R T E R & F U L L - Y E A R F Y 2 1 R E S U L T S Adjusted Gross Margin 19 Reconciliation Schedules Organic Revenue Change a) Items related to new warehouse represent costs to transition to the new warehouse and duplicate costs incurred during the transition. Three Months Ended March 31, Year Ended March 31, 2021 2020 2021 2020 (In Thousands) GAAP Total Revenues 237,761$ 251,235$ 943,365$ 963,010$ Revenue Change (5.4%) (2.0%) Adjustments: Impact of foreign currency exchange rates - 3,404 - 3,796 Total adjustments -$ 3,404$ -$ 3,796$ Non-GAAP Organic Revenues 237,761$ 254,639$ 943,365$ 966,806$ Non-GAAP Organic Revenue Change (6.6%) (2.4%) Three Months Ended March 31, Year Ended March 31, 2021 2020 2021 2020 (In Thousands) GAAP Total Revenues 237,761$ 251,235$ 943,365$ 963,010$ GAAP Gross Profit 137,056$ 143,910$ 547,472$ 552,223$ GAAP Gross Profit as a Percentage of GAAP Total Revenue 57.6% 57.3% 58.0% 57.3% Adjustments: Transition and other costs associated with new warehouse (a) - 5,208 - 9,170 Total adjustments - 5,208 - 9,170 Non-GAAP Adjusted Gross Margin 137,056$ 149,118$ 547,472$ 561,393$ Non-GAAP Adjusted Gross Margin as a Percentage of GAAP Total Revenues 57.6% 59.4% 58.0% 58.3%
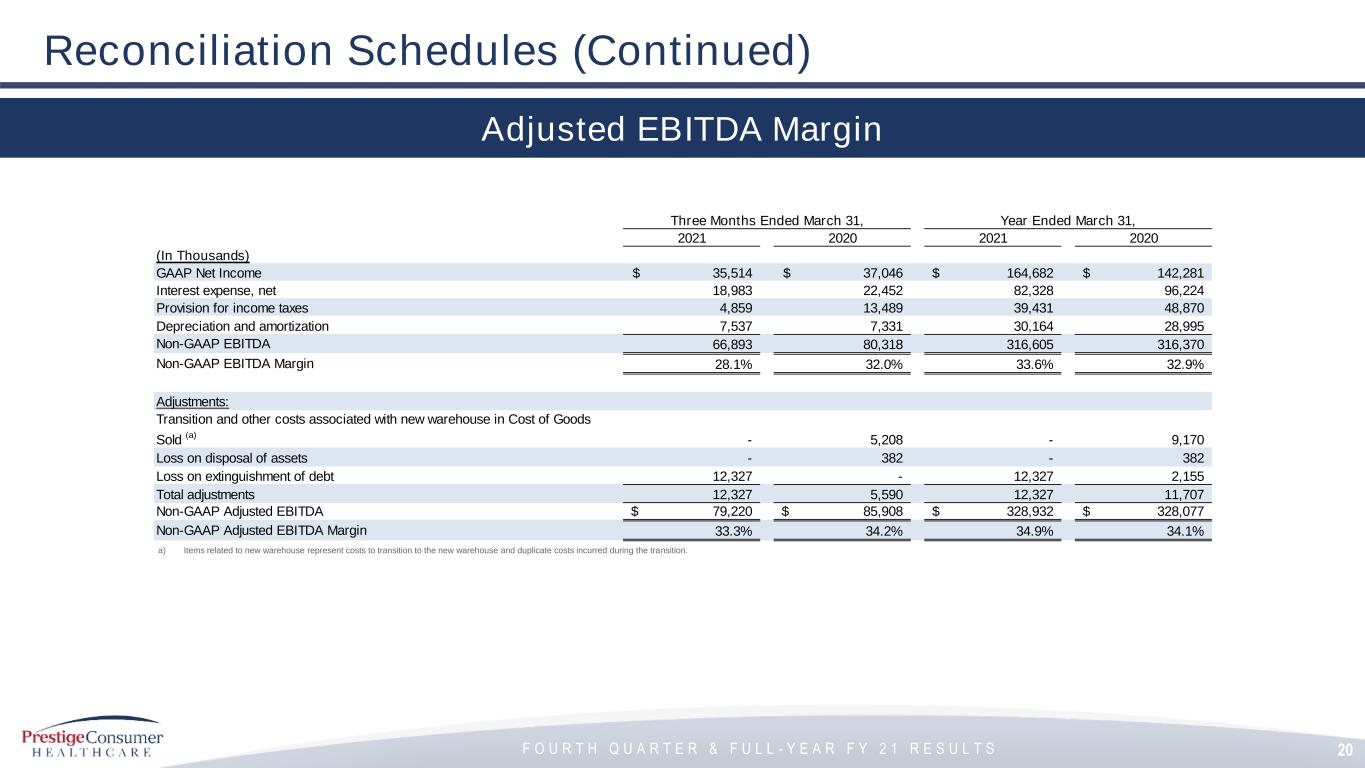
F O U R T H Q U A R T E R & F U L L - Y E A R F Y 2 1 R E S U L T S 20 Reconciliation Schedules (Continued) Adjusted EBITDA Margin a) Items related to new warehouse represent costs to transition to the new warehouse and duplicate costs incurred during the transition. Three Months Ended March 31, Year Ended March 31, 2021 2020 2021 2020 (In Thousands) GAAP Net Income 35,514$ 37,046$ 164,682$ 142,281$ Interest expense, net 18,983 22,452 82,328 96,224 Provision for income taxes 4,859 13,489 39,431 48,870 Depreciation and amortization 7,537 7,331 30,164 28,995 Non-GAAP EBITDA 66,893 80,318 316,605 316,370 Non-GAAP EBITDA Margin 28.1% 32.0% 33.6% 32.9% Adjustments: Transition and other costs associated with new warehouse in Cost of Goods Sold (a) - 5,208 - 9,170 Loss on disposal of assets - 382 - 382 Loss on extinguishment of debt 12,327 - 12,327 2,155 Total adjustments 12,327 5,590 12,327 11,707 Non-GAAP Adjusted EBITDA 79,220$ 85,908$ 328,932$ 328,077$ Non-GAAP Adjusted EBITDA Margin 33.3% 34.2% 34.9% 34.1%

F O U R T H Q U A R T E R & F U L L - Y E A R F Y 2 1 R E S U L T S Three Months Ended March 31, Year Ended March 31, 2021 2020 2021 2020 Net Income Adjusted EPS Net Income Adjusted EPS Net Income Adjusted EPS Net Income Adjusted EPS (In Thousands, except per share data) GAAP Net Income 35,514$ 0.70$ 37,046$ 0.73$ 164,682$ 3.25$ 142,281$ 2.78$ Adjustments: Transition and other costs associated with new warehouse in Cost of Goods Sold (a) - - 5,208 0.10 - - 9,170 0.18 Loss on disposal of assets - - 382 0.01 - - 382 0.01 Loss on extinguishment of debt 12,327 0.24 - - 12,327 0.24 2,155 0.04 Tax impact of adjustments (b) (2,986) (0.06) (1,420) (0.03) (2,986) (0.06) (2,974) (0.06) Normalized tax rate adjustment (c) (4,919) (0.10) 653 0.01 (10,025) (0.20) 318 0.01 Total Adjustments 4,422 0.09 4,823 0.09 (684) (0.01) 9,051 0.18 Non-GAAP Adjusted Net Income and Adjusted EPS 39,936$ 0.79$ 41,869$ 0.82$ 163,998$ 3.24$ 151,332$ 2.96$ 21 Reconciliation Schedules (Continued) Adjusted Net Income & Adjusted EPS a) Items related to new warehouse represent costs to transition to the new warehouse and duplicate costs incurred during the transition. b) The income tax adjustments are determined using applicable rates in the taxing jurisdictions in which the above adjustments relate and includes both current and deferred income tax expense (benefit) based on the specific nature of the specific Non-GAAP performance measure. c) Income tax adjustment to adjust for discrete income tax items. Note: Amounts may not add due to rounding

F O U R T H Q U A R T E R & F U L L - Y E A R F Y 2 1 R E S U L T S 22 Reconciliation Schedules (Continued) Adjusted Free Cash Flow a) Payments related to new warehouse represent costs to transition to the new warehouse and duplicate costs incurred during transition. Three Months Ended March 31, Year Ended March 31, 2021 2020 2021 2020 (In Thousands) GAAP Net Income 35,514$ 37,046$ 164,682$ 142,281$ Adjustments: Adjustments to reconcile net income to net cash provided by operating activities as shown in the Statement of Cash Flows 29,904 20,056 76,523 66,041 Changes in operating assets and liabilities as shown in the Statement of Cash Flows (6,331) (976) (5,598) 8,802 Total adjustments 23,573 19,080 70,925 74,843 GAAP Net cash provided by operating activities 59,087 56,126 235,607 217,124 Purchase of property and equipment (4,896) (5,505) (22,243) (14,560) Non-GAAP Free Cash Flow 54,191 50,621 213,364 202,564 Transition and other payments associated with new warehouse (a) - 1,876 - 4,203 Non-GAAP Adjusted Free Cash Flow 54,191$ 52,497$ 213,364$ 206,767$

F O U R T H Q U A R T E R & F U L L - Y E A R F Y 2 1 R E S U L T S 23 Reconciliation Schedules (Continued) Adjusted Free Cash Flow Projected Free Cash Flow (In millions) Projected FY'22 GAAP Net Cash provided by operating activities 240$ Additions to property and equipment for cash (15) Projected Non-GAAP Adjusted Free Cash Flow 225$ 2017 2018 2019 (In Thousands) GAAP Net Income (Loss) 69,395$ 339,570$ (35,800)$ Adjustments Adjustments to reconcile net income to net cash provided by operating activities as shown in the statement of cash flows 92,613 (113,698) 233,400 Changes in operating assets and liabilities, net of effects from acquisitions as shown in the statement of cash flows (13,336) (15,762) (8,316) Total adjustments 79,277 (129,460) 225,084 GAAP Net cash provided by operating activities 148,672 210,110 189,284 Purchases of property and equipment (2,977) (12,532) (10,480) Non-GAAP Free Cash Flow 145,695 197,578 178,804 Additional expense as a result of debt refinancing 9,184 182 - Integration, transition and other payments associated with acquisitions & divestitures 10,448 10,358 10,902 Pension contribution 6,000 - - Additional income tax payments associated with divestitures 25,545 - 12,656 Total adjustments 51,177 10,540 23,558 Non-GAAP Adjusted Free Cash Flow 196,872$ 208,118$ 202,362$
