Attached files
| file | filename |
|---|---|
| EX-99.1 - EX-99.1 - Funko, Inc. | ex-9915621.htm |
| 8-K - 8-K - Funko, Inc. | fnko-20210506.htm |
First Quarter 2021 Earnings May 6, 2021
HOLLYWOOD UPDATE 2 Cautionary Notes This presentation contains forward-looking statements within the meaning of the Private Securities Litigation Reform Act of 1995. All statements other than statements of historical facts contained in this presentation, including statements regarding our future results of operations and financial position, industry dynamics, our mission, growth opportunities, business strategy and plans and our objectives for future operations, including expanding into new product categories, our e-commerce business, the underlying trends in our business, the ongoing impact of COVID-19 on our business and expected recovery, the expected impact of our acquisition of TokenWave, and our expected liquidity are forward-looking statements. The words “may,” “will,” “should,” “expects,” “plans,” “anticipates,” “could,” “intends,” “targets,” “projects,” “contemplates,” “believes,” “estimates,” “predicts,” “potential” or “continue” or the negative of these terms and similar expressions are intended to identify forward-looking statements. The forward-looking statements in this presentation are only predictions. We have based these forward-looking statements largely on our current expectations and projections about future events and financial trends that we believe may affect our business, financial condition and results of operations. Forward-looking statements involve known and unknown risks, uncertainties and other important factors that may cause our actual results, performance or achievements to be materially different from any future results, performance or achievements expressed or implied by the forward-looking statements, including without limitation risks related to the impact of COVID-19 on our business, financial results and financial condition; our ability to execute our business strategy; our ability to maintain and realize the full value of our license agreements; changes in the retail industry and markets for our consumer products; our ability to maintain our relationships with retail customers and distributors; our ability to compete effectively; fluctuations in our gross margin; our dependence on content development and creation by third parties; the ongoing level of popularity of our products with consumers; our ability to manage our inventories; our ability to develop and introduce products in a timely and cost- effective manner; our ability to obtain, maintain and protect our intellectual property rights or those of our licensors; potential violations of the intellectual property rights of others; risks associated with counterfeit versions of our products; our ability to attract and retain qualified employees and maintain our corporate culture; our use of third-party manufacturing; risks associated with our international operations; changes in effective tax rates or tax law; foreign currency exchange rate exposure; the possibility or existence of global and regional economic downturns; our dependence on vendors and outsourcers; risks relating to government regulation; risks relating to litigation, including products liability claims and securities class action litigation; any failure to successfully integrate or realize the anticipated benefits of acquisitions or investments; reputational risk resulting from our e-commerce business and social media presence; risks relating to our indebtedness and our ability to secure additional financing; the potential for our electronic data or the electronic data of our customers to be compromised; the influence of our significant stockholder, ACON, and the possibility that ACON’s interests may conflict with the interests of our other stockholders; risks relating to our organizational structure; volatility in the price of our Class A common stock; risks associated with our internal control over financial reporting; and the important factors discussed under the caption “Risk Factors” in our Quarterly Report on Form 10-Q for the quarter ended March 31, 2021 and our other filings with the Securities and Exchange Commission. Because forward-looking statements are inherently subject to risks and uncertainties, some of which cannot be predicted or quantified, you should not rely on these forward-looking statements as predictions of future events. The events and circumstances reflected in our forward-looking statements may not be achieved or occur and actual results could differ materially from those projected in the forward-looking statements. In addition, statements that “we believe” and similar statements reflect our beliefs and opinions on the relevant subject. These statements are based upon information available to us as of the date hereof, and while we believe such information forms a reasonable basis for such statements, such information may be limited or incomplete, and our statements should not be read to indicate that we have conducted an exhaustive inquiry into, or review of, all potentially available relevant information. These statements are inherently uncertain and investors are cautioned not to unduly rely upon these statements. You should read this presentation with the understanding that our actual future results, levels of activity, performance and achievements may be materially different from what we expect. We qualify all of our forward- looking statements by these cautionary statements. These forward-looking statements speak only as of the date of this presentation, and except as otherwise required by law, we do not plan to publicly update or revise any forward-looking statements contained in this presentation, whether as a result of any new information, future events or otherwise. Unless otherwise indicated, information contained in this presentation concerning our industry, competitive position and the markets in which we operate is based on information from independent industry and research organizations, other third-party sources and management estimates. Management estimates are derived from publicly available information released by independent industry analysts and other third-party sources, as well as data from our internal research, and are based on assumptions made by us upon reviewing such data, and our experience in, and knowledge of, such industry and markets, which we believe to be reasonable. In addition, projections, assumptions and estimates of the future performance of the industry in which we operate and our future performance are necessarily subject to uncertainty and risk due to a variety of factors, including those described above. These and other factors could cause results to differ materially from those expressed in the estimates made by independent parties and by us.

3 FUNKO 2021 IS BUILT ON THE PRINCIPLE THAT EVERYONE IS A FAN OF SOMETHING…
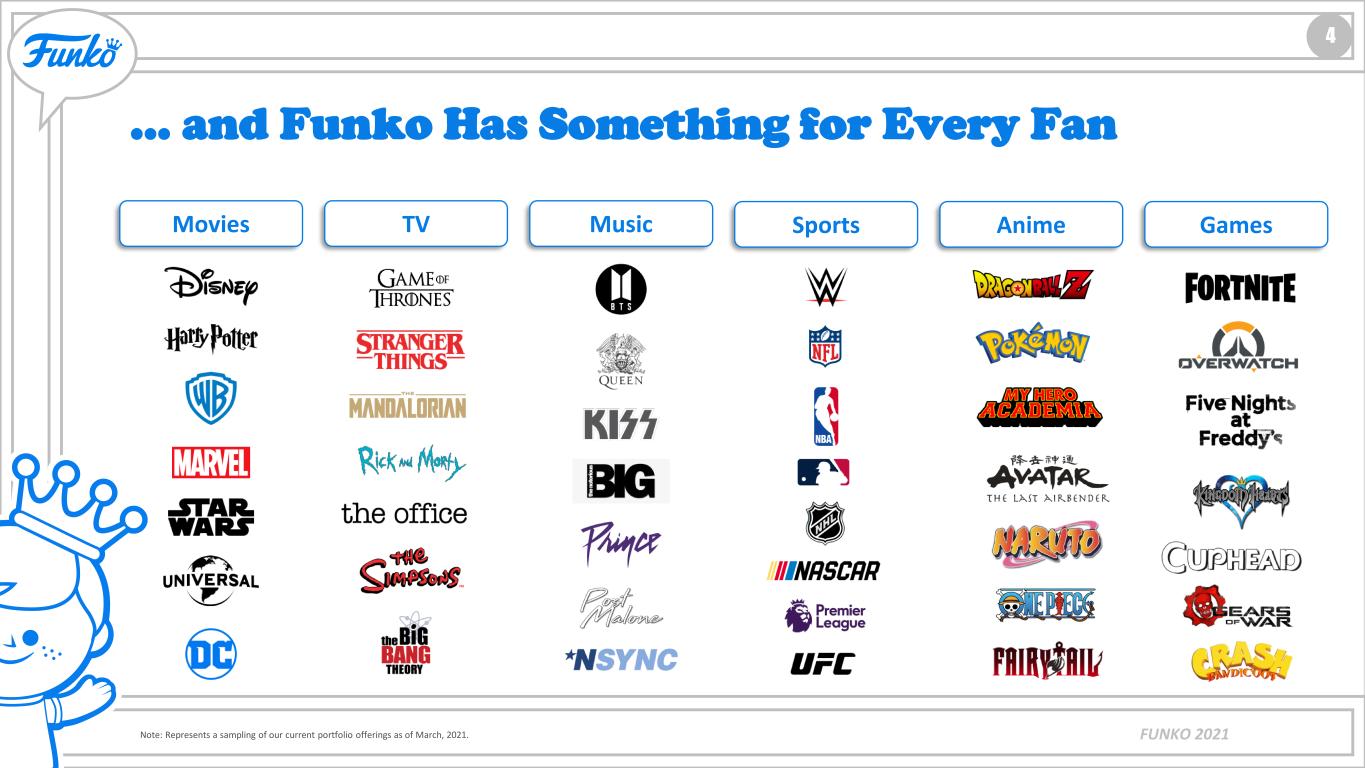
4 FUNKO 2021 … and Funko Has Something for Every Fan Movies TV Music Sports Anime Games Note: Represents a sampling of our current portfolio offerings as of March, 2021.
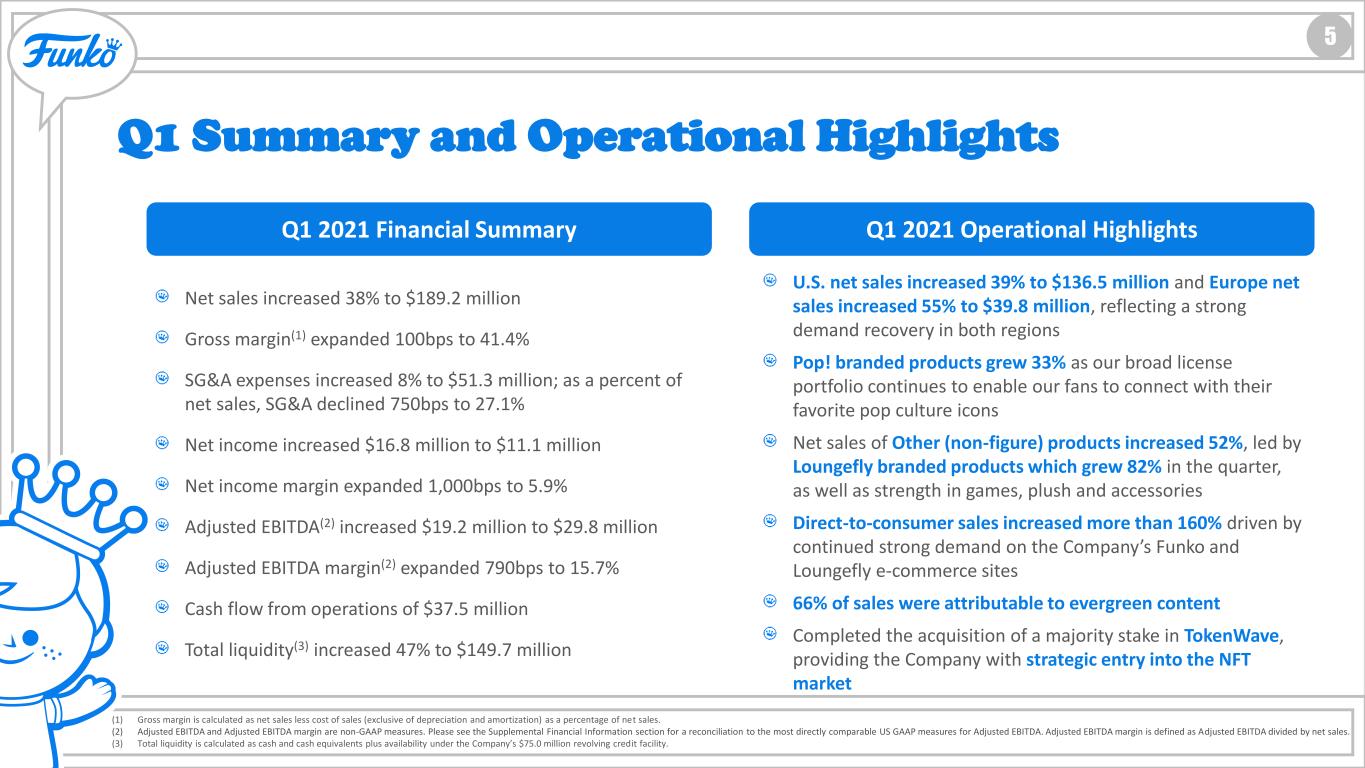
HOLLYWOOD UPDATE 5 Q1 Summary and Operational Highlights Q1 2021 Financial Summary Q1 2021 Operational Highlights Net sales increased 38% to $189.2 million Gross margin(1) expanded 100bps to 41.4% SG&A expenses increased 8% to $51.3 million; as a percent of net sales, SG&A declined 750bps to 27.1% Net income increased $16.8 million to $11.1 million Net income margin expanded 1,000bps to 5.9% Adjusted EBITDA(2) increased $19.2 million to $29.8 million Adjusted EBITDA margin(2) expanded 790bps to 15.7% Cash flow from operations of $37.5 million Total liquidity(3) increased 47% to $149.7 million U.S. net sales increased 39% to $136.5 million and Europe net sales increased 55% to $39.8 million, reflecting a strong demand recovery in both regions Pop! branded products grew 33% as our broad license portfolio continues to enable our fans to connect with their favorite pop culture icons Net sales of Other (non-figure) products increased 52%, led by Loungefly branded products which grew 82% in the quarter, as well as strength in games, plush and accessories Direct-to-consumer sales increased more than 160% driven by continued strong demand on the Company’s Funko and Loungefly e-commerce sites 66% of sales were attributable to evergreen content Completed the acquisition of a majority stake in TokenWave, providing the Company with strategic entry into the NFT market (1) Gross margin is calculated as net sales less cost of sales (exclusive of depreciation and amortization) as a percentage of net sales. (2) Adjusted EBITDA and Adjusted EBITDA margin are non-GAAP measures. Please see the Supplemental Financial Information section for a reconciliation to the most directly comparable US GAAP measures for Adjusted EBITDA. Adjusted EBITDA margin is defined as Adjusted EBITDA divided by net sales. (3) Total liquidity is calculated as cash and cash equivalents plus availability under the Company’s $75.0 million revolving credit facility.
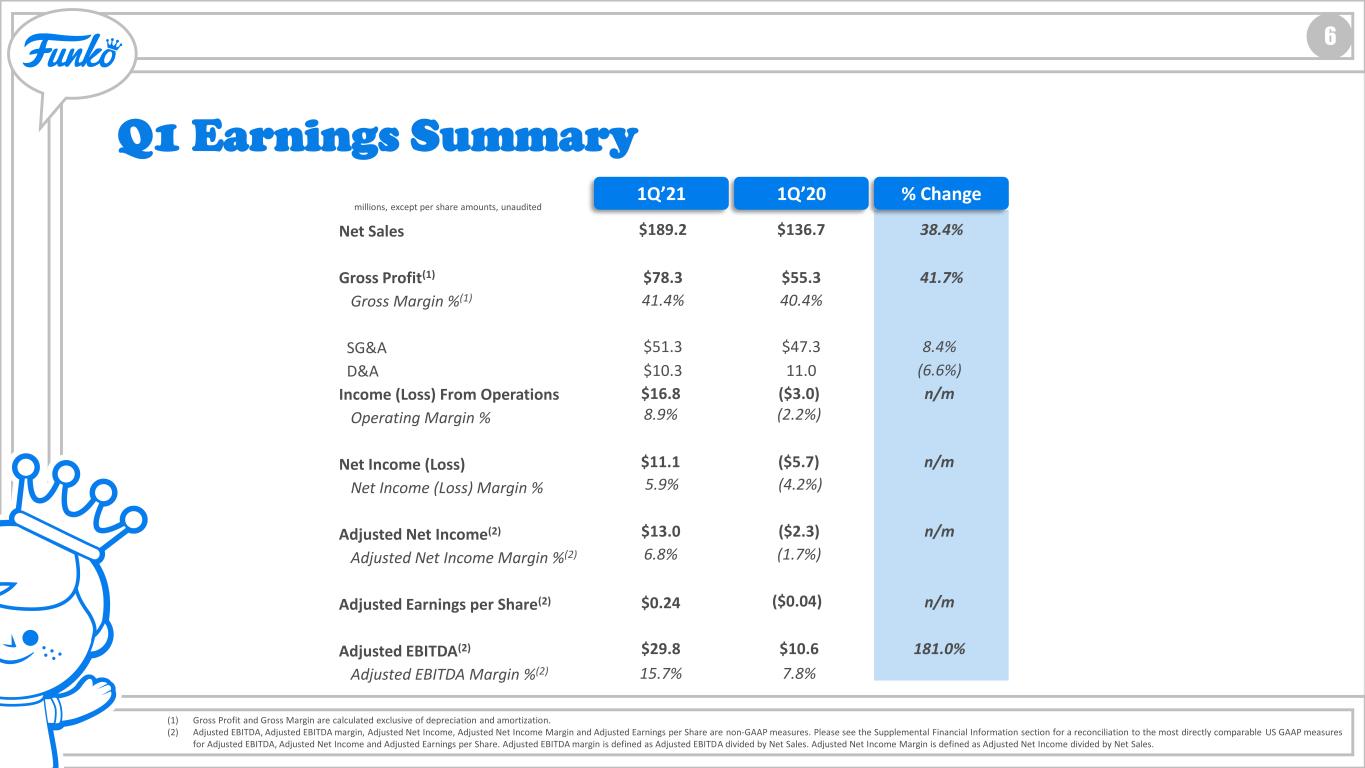
HOLLYWOOD UPDATE 6 Q1 Earnings Summary 1Q’21 1Q’20 % Change Net Sales Gross Profit(1) Gross Margin %(1) SG&A D&A Income (Loss) From Operations Operating Margin % Net Income (Loss) Net Income (Loss) Margin % Adjusted Net Income(2) Adjusted Net Income Margin %(2) Adjusted Earnings per Share(2) Adjusted EBITDA(2) Adjusted EBITDA Margin %(2) millions, except per share amounts, unaudited $189.2 $136.7 38.4% $78.3 $55.3 41.7% 41.4% 40.4% $16.8 ($3.0) n/m 8.9% (2.2%) $0.24 ($0.04) n/m $29.8 $10.6 181.0% 15.7% 7.8% $13.0 ($2.3) n/m 6.8% (1.7%) $11.1 ($5.7) n/m (1) Gross Profit and Gross Margin are calculated exclusive of depreciation and amortization. (2) Adjusted EBITDA, Adjusted EBITDA margin, Adjusted Net Income, Adjusted Net Income Margin and Adjusted Earnings per Share are non-GAAP measures. Please see the Supplemental Financial Information section for a reconciliation to the most directly comparable US GAAP measures for Adjusted EBITDA, Adjusted Net Income and Adjusted Earnings per Share. Adjusted EBITDA margin is defined as Adjusted EBITDA divided by Net Sales. Adjusted Net Income Margin is defined as Adjusted Net Income divided by Net Sales. $51.3 $47.3 $10.3 11.0 (6.6%) 8.4% 5.9% (4.2%)
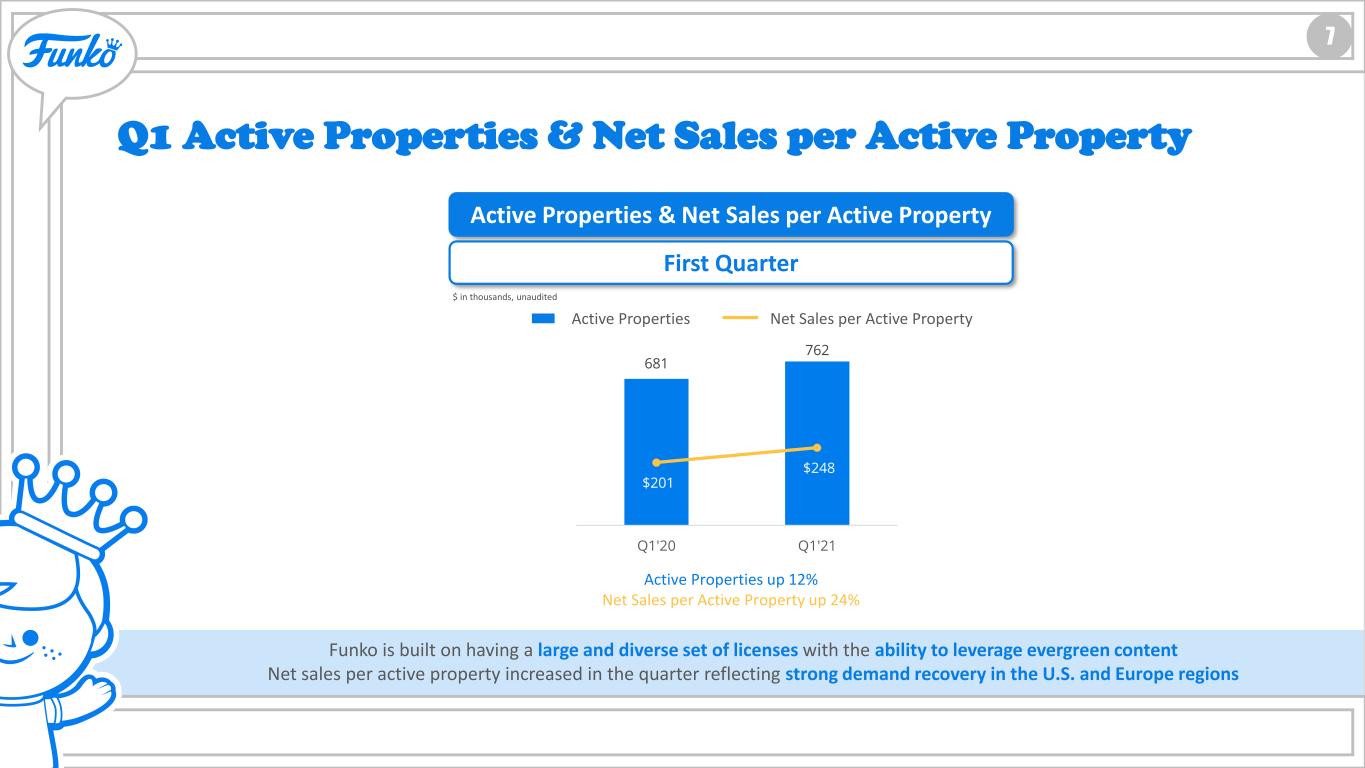
HOLLYWOOD UPDATE 7 Q1 Active Properties & Net Sales per Active Property Active Properties & Net Sales per Active Property First Quarter Active Properties up 12% Net Sales per Active Property up 24% Active Properties Net Sales per Active Property Funko is built on having a large and diverse set of licenses with the ability to leverage evergreen content Net sales per active property increased in the quarter reflecting strong demand recovery in the U.S. and Europe regions 681 762 $201 $248 $- $100 $200 $300 $400 $500 0 100 200 300 400 500 600 700 800 Q1'20 Q1'21 $ in thousands, unaudited
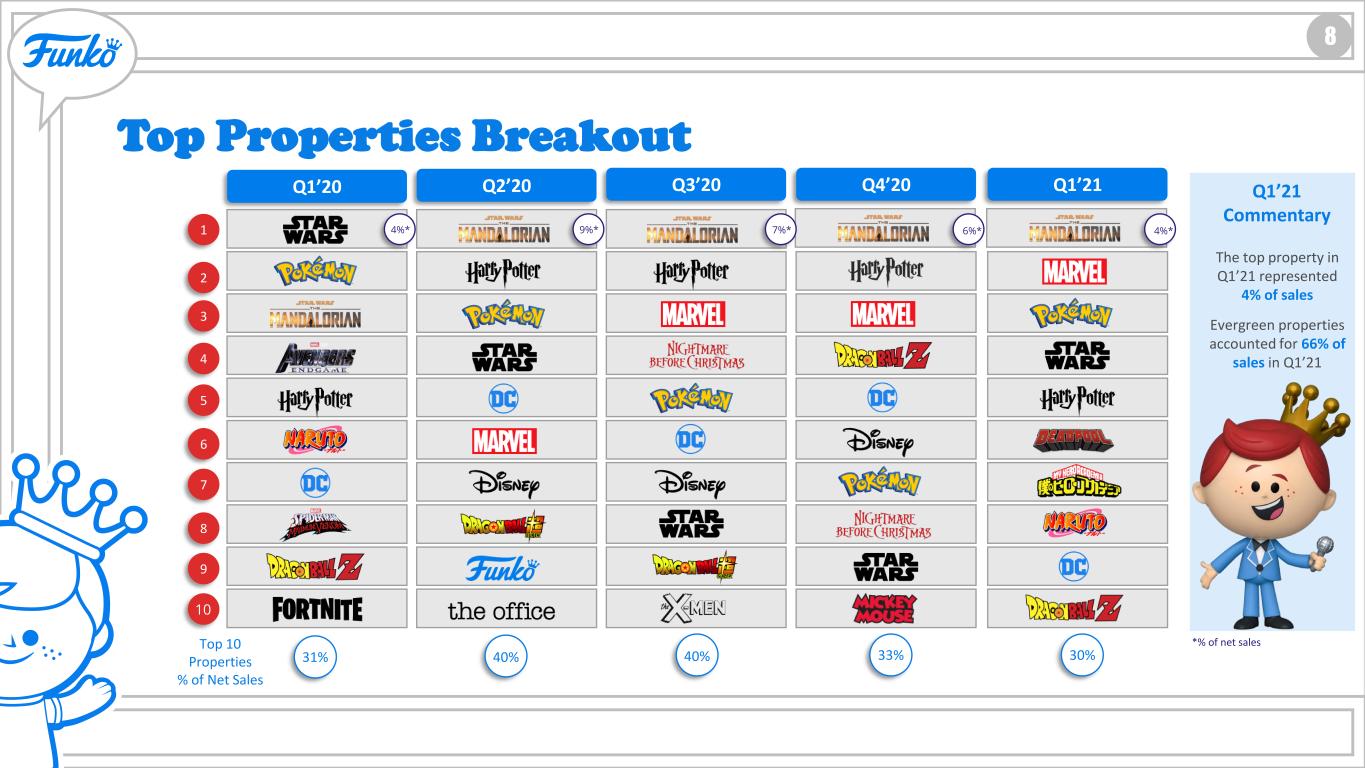
HOLLYWOOD UPDATE 8 Top Properties Breakout 1 2 3 5 7 4 6 8 9 10 Top 10 Properties % of Net Sales The top property in Q1’21 represented 4% of sales Evergreen properties accounted for 66% of sales in Q1’21 Q3’20 40% *% of net sales 7%* Q2’20 40% Q1’20 31% Q4’20 33% 6%*4%* 9%* Q1’21 Commentary Q1’21 30% 4%*
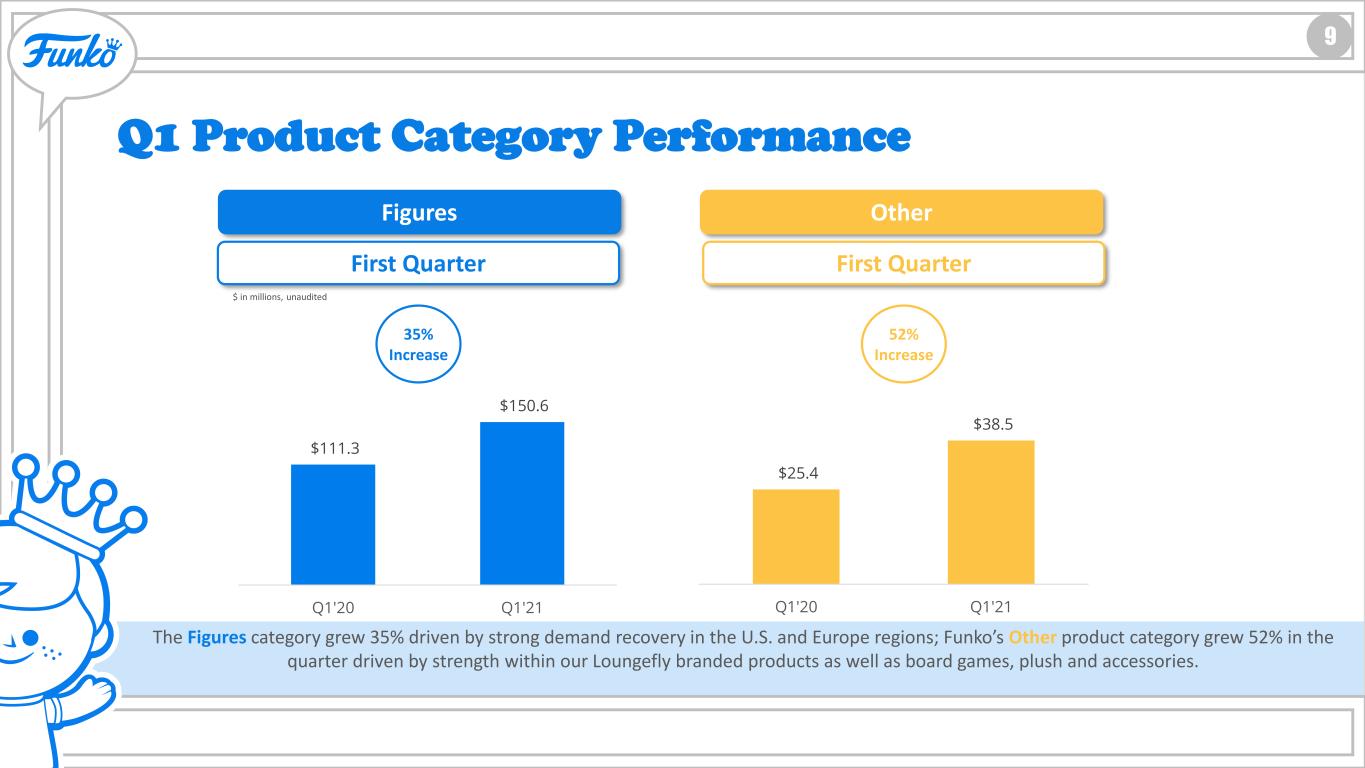
HOLLYWOOD UPDATE 9 Q1 Product Category Performance Figures First Quarter Other First Quarter 35% Increase 52% Increase The Figures category grew 35% driven by strong demand recovery in the U.S. and Europe regions; Funko’s Other product category grew 52% in the quarter driven by strength within our Loungefly branded products as well as board games, plush and accessories. $111.3 $150.6 Q1'20 Q1'21 $25.4 $38.5 Q1'20 Q1'21 $ in millions, unaudited
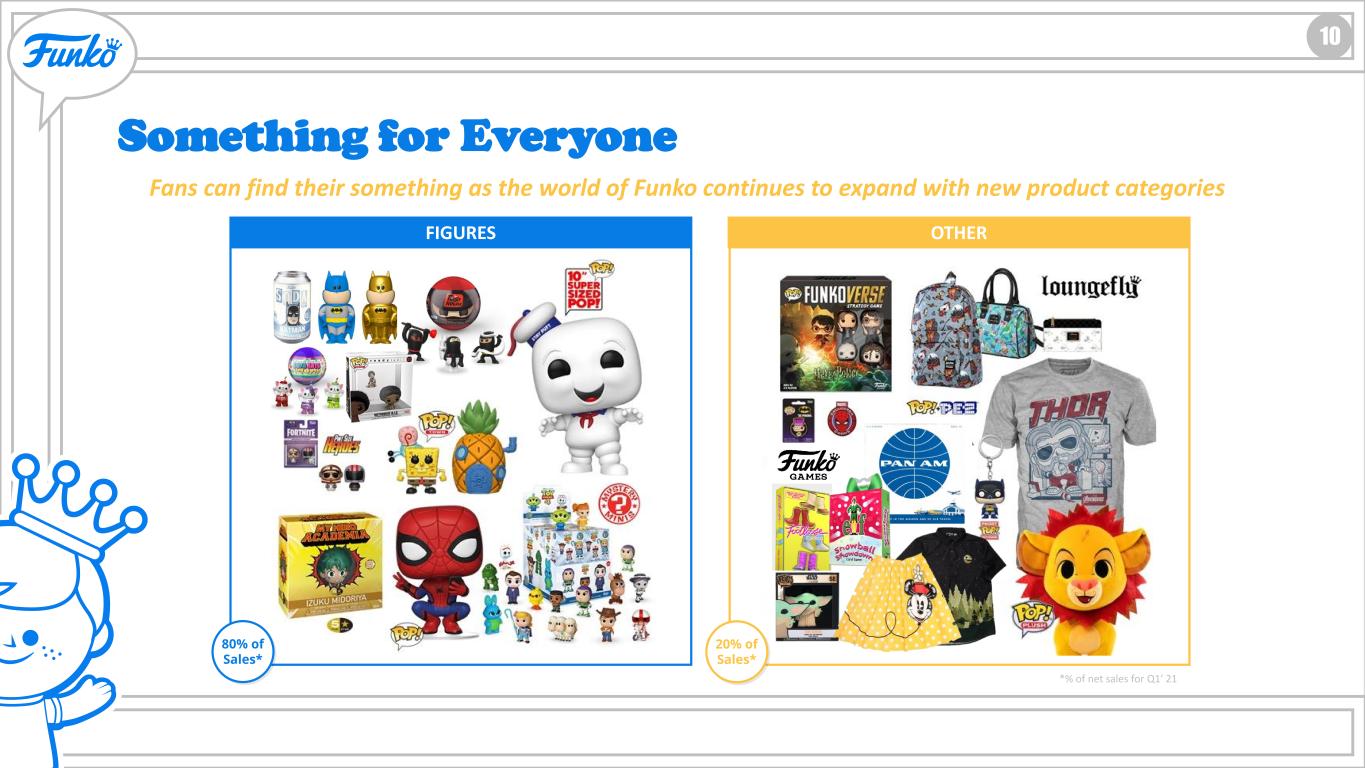
HOLLYWOOD UPDATE 10 Something for Everyone FIGURES OTHER *% of net sales for Q1’ 21 80% of Sales* 20% of Sales* Fans can find their something as the world of Funko continues to expand with new product categories
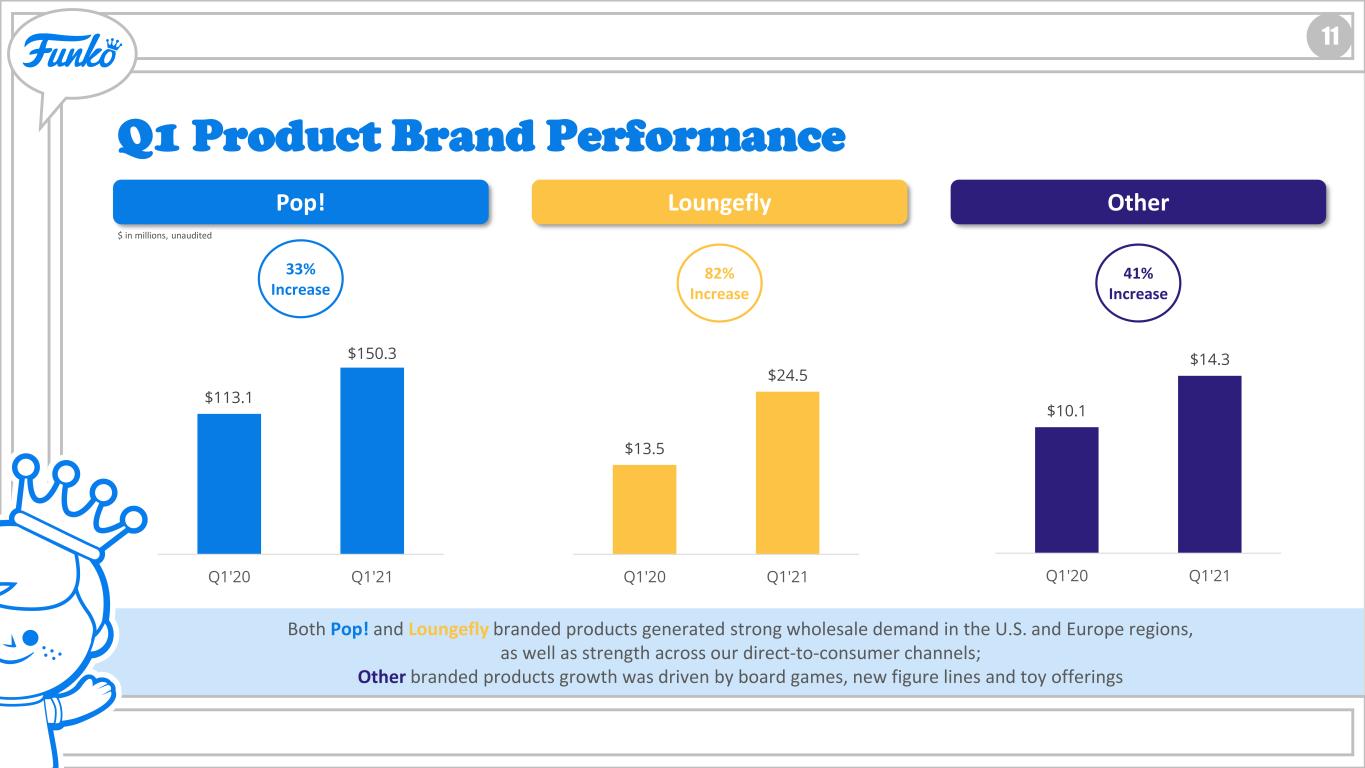
HOLLYWOOD UPDATE 11 Q1 Product Brand Performance Pop! 33% Increase Both Pop! and Loungefly branded products generated strong wholesale demand in the U.S. and Europe regions, as well as strength across our direct-to-consumer channels; Other branded products growth was driven by board games, new figure lines and toy offerings Loungefly Other 82% Increase 41% Increase $113.1 $150.3 Q1'20 Q1'21 $13.5 $24.5 Q1'20 Q1'21 $10.1 $14.3 Q1'20 Q1'21 $ in millions, unaudited
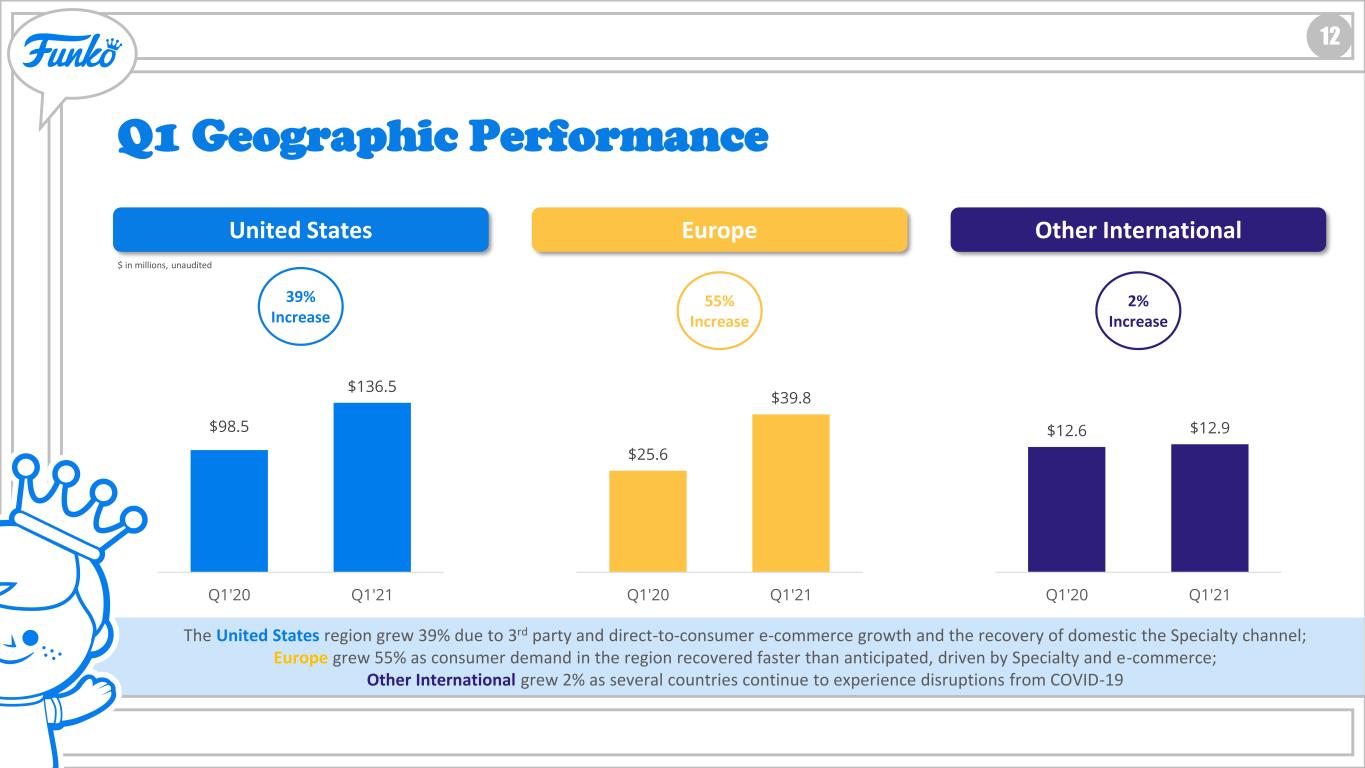
HOLLYWOOD UPDATE 12 Q1 Geographic Performance United States 39% Increase The United States region grew 39% due to 3rd party and direct-to-consumer e-commerce growth and the recovery of domestic the Specialty channel; Europe grew 55% as consumer demand in the region recovered faster than anticipated, driven by Specialty and e-commerce; Other International grew 2% as several countries continue to experience disruptions from COVID-19 Europe Other International 55% Increase 2% Increase $98.5 $136.5 Q1'20 Q1'21 $25.6 $39.8 Q1'20 Q1'21 $12.6 $12.9 Q1'20 Q1'21 $ in millions, unaudited
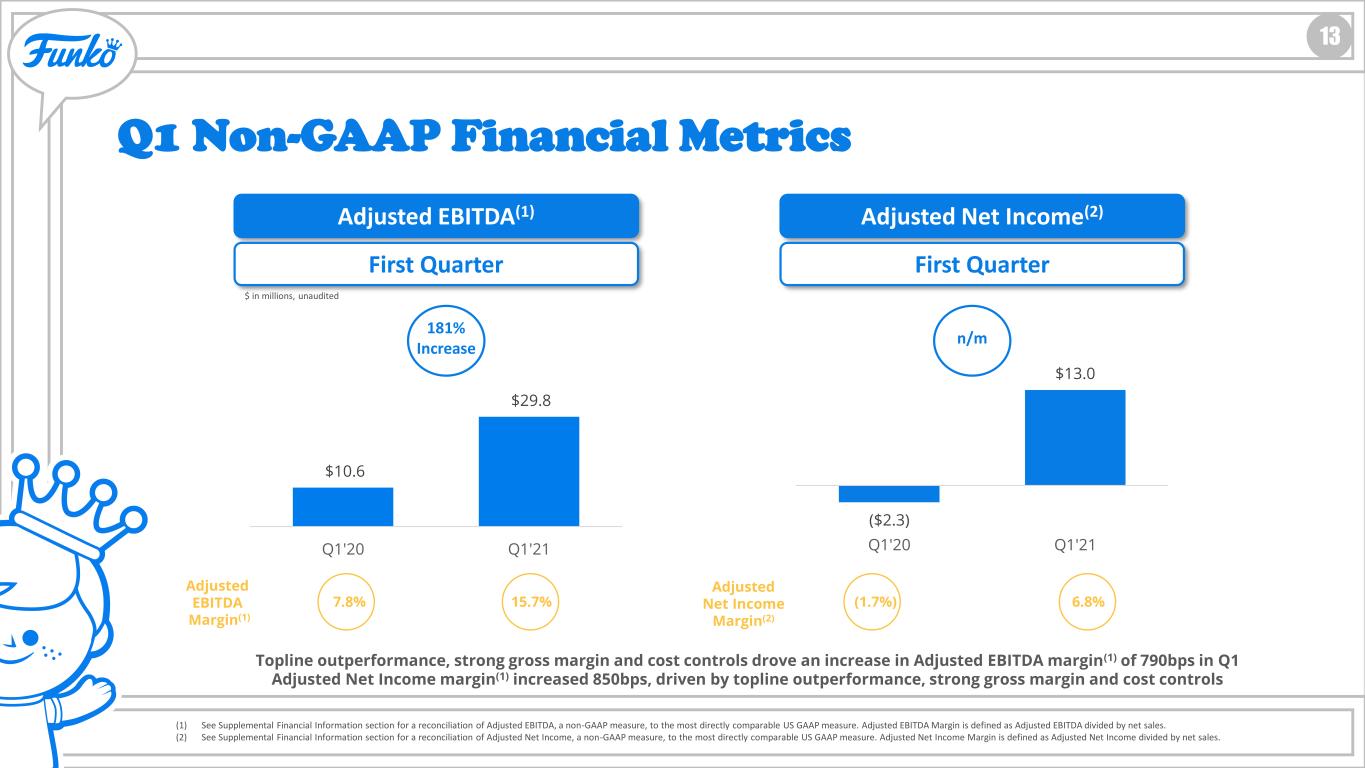
HOLLYWOOD UPDATE 13 Q1 Non-GAAP Financial Metrics Adjusted EBITDA(1) First Quarter Adjusted EBITDA Margin(1) (1) See Supplemental Financial Information section for a reconciliation of Adjusted EBITDA, a non-GAAP measure, to the most directly comparable US GAAP measure. Adjusted EBITDA Margin is defined as Adjusted EBITDA divided by net sales. (2) See Supplemental Financial Information section for a reconciliation of Adjusted Net Income, a non-GAAP measure, to the most directly comparable US GAAP measure. Adjusted Net Income Margin is defined as Adjusted Net Income divided by net sales. 7.8% 15.7% 181% Increase Topline outperformance, strong gross margin and cost controls drove an increase in Adjusted EBITDA margin(1) of 790bps in Q1 Adjusted Net Income margin(1) increased 850bps, driven by topline outperformance, strong gross margin and cost controls $10.6 $29.8 Q1'20 Q1'21 $ in millions, unaudited Adjusted Net Income(2) First Quarter n/m Adjusted Net Income Margin(2) (1.7%) 6.8% ($2.3) $13.0 Q1'20 Q1'21
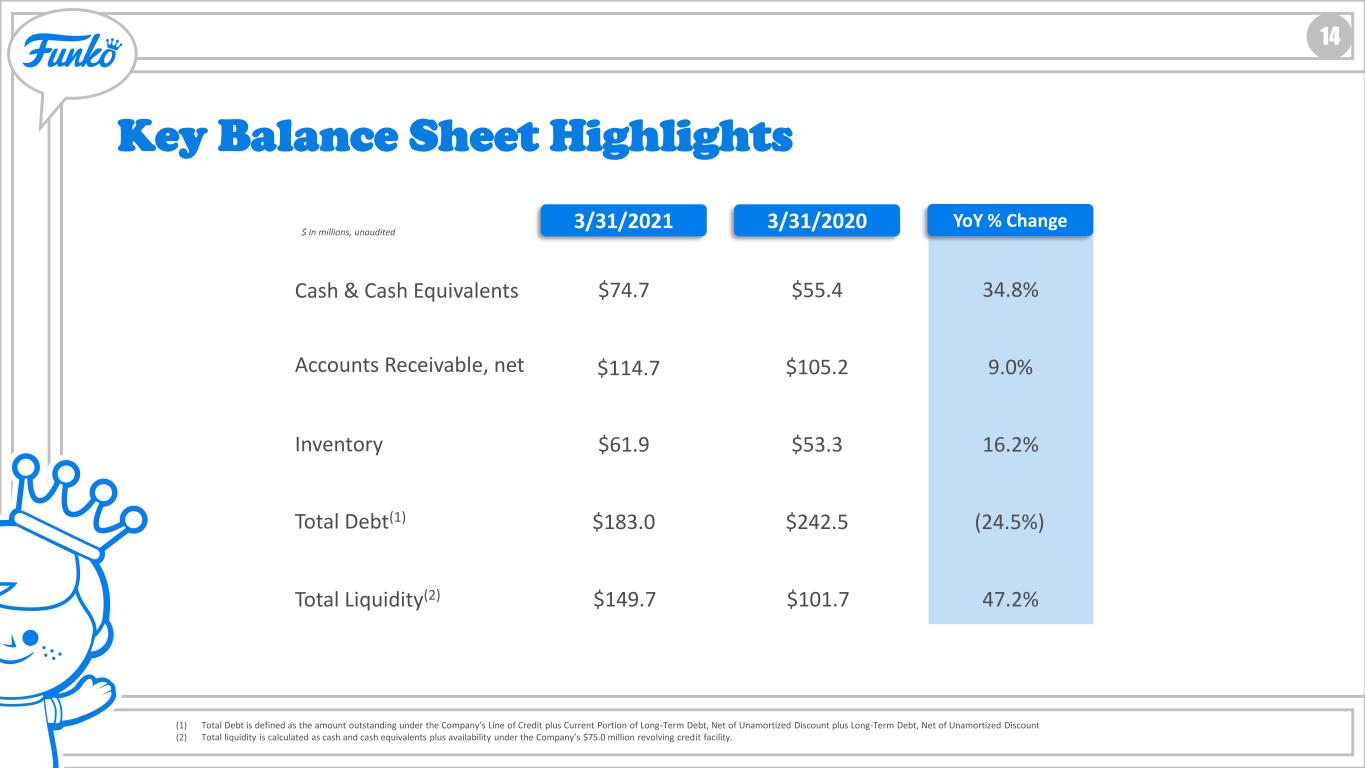
HOLLYWOOD UPDATE 14 Key Balance Sheet Highlights (1) Total Debt is defined as the amount outstanding under the Company’s Line of Credit plus Current Portion of Long-Term Debt, Net of Unamortized Discount plus Long-Term Debt, Net of Unamortized Discount (2) Total liquidity is calculated as cash and cash equivalents plus availability under the Company’s $75.0 million revolving credit facility. 3/31/2020 YoY % Change Cash & Cash Equivalents Accounts Receivable, net Inventory Total Debt(1) $55.4 $105.2 $53.3 $242.5 $ in millions, unaudited 34.8% 9.0% 16.2% (24.5%) 3/31/2021 $74.7 $114.7 $61.9 $183.0 Total Liquidity(2) $101.7 47.2%$149.7
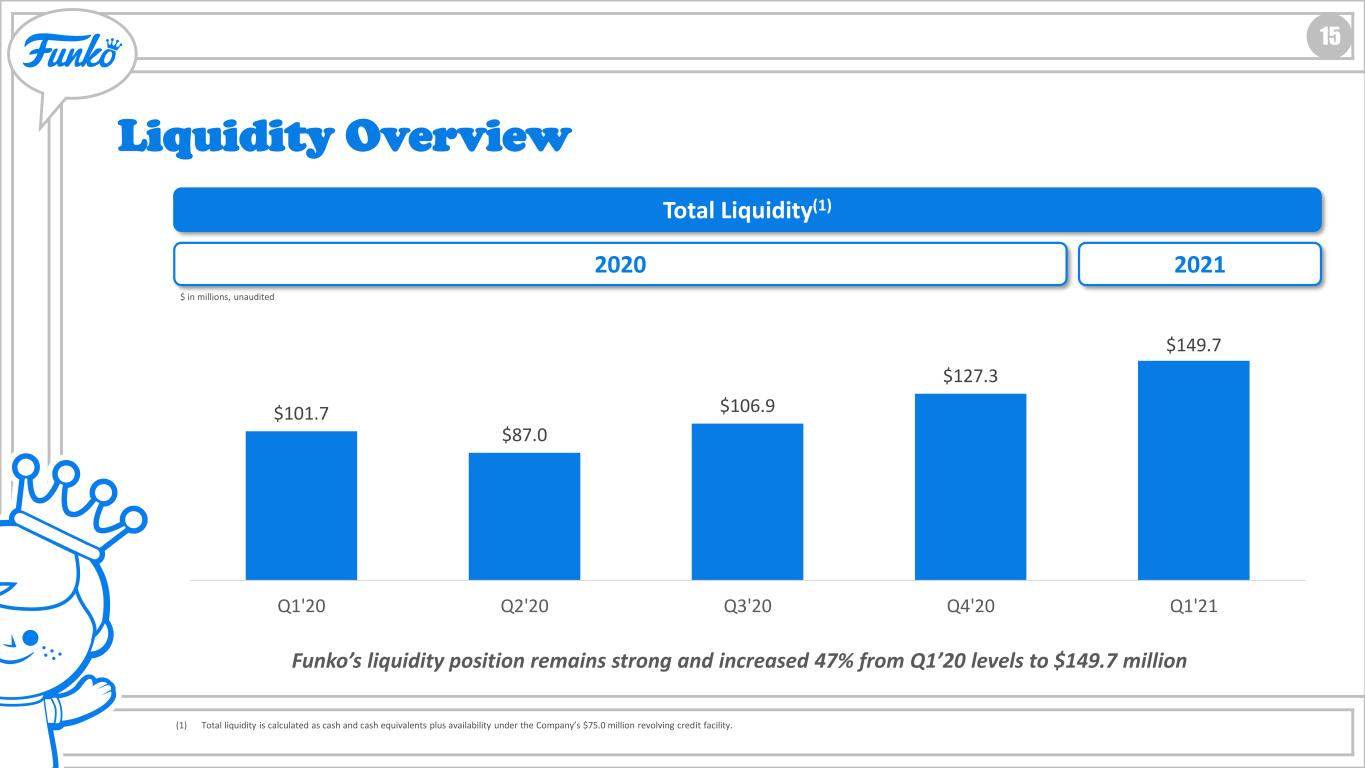
HOLLYWOOD UPDATE 15 Liquidity Overview (1) Total liquidity is calculated as cash and cash equivalents plus availability under the Company’s $75.0 million revolving credit facility. Funko’s liquidity position remains strong and increased 47% from Q1’20 levels to $149.7 million Total Liquidity(1) $101.7 $87.0 $106.9 $127.3 $149.7 Q1'20 Q2'20 Q3'20 Q4'20 Q1'21 2020 2021 $ in millions, unaudited
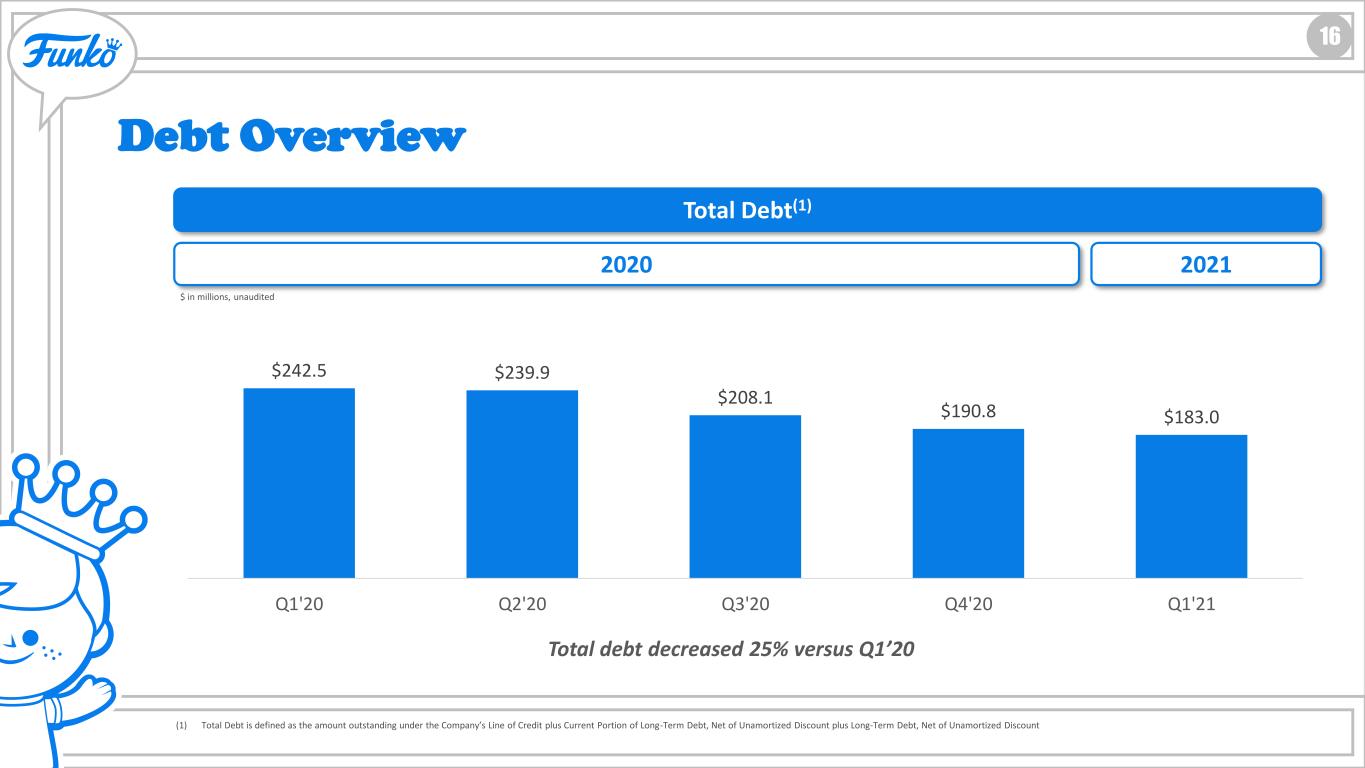
HOLLYWOOD UPDATE 16 Debt Overview (1) Total Debt is defined as the amount outstanding under the Company’s Line of Credit plus Current Portion of Long-Term Debt, Net of Unamortized Discount plus Long-Term Debt, Net of Unamortized Discount Total debt decreased 25% versus Q1’20 Total Debt(1) $242.5 $239.9 $208.1 $190.8 $183.0 Q1'20 Q2'20 Q3'20 Q4'20 Q1'21 2020 2021 $ in millions, unaudited

Supplemental Financial Information
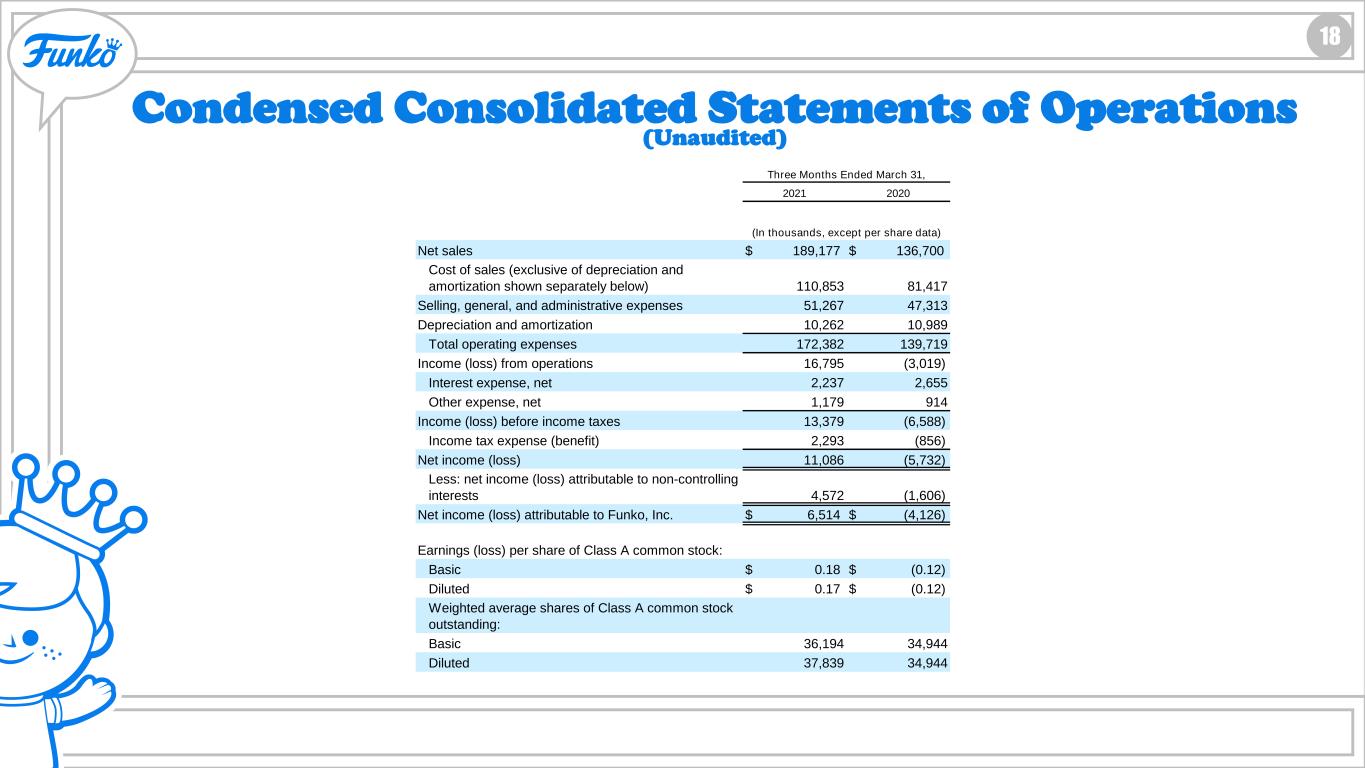
HOLLYWOOD UPDATE 18 Condensed Consolidated Statements of Operations (Unaudited) 2021 2020 Net sales $ 189,177 $ 136,700 Cost of sales (exclusive of depreciation and amortization shown separately below) 110,853 81,417 Selling, general, and administrative expenses 51,267 47,313 Depreciation and amortization 10,262 10,989 Total operating expenses 172,382 139,719 Income (loss) from operations 16,795 (3,019) Interest expense, net 2,237 2,655 Other expense, net 1,179 914 Income (loss) before income taxes 13,379 (6,588) Income tax expense (benefit) 2,293 (856) Net income (loss) 11,086 (5,732) Less: net income (loss) attributable to non-controlling interests 4,572 (1,606) Net income (loss) attributable to Funko, Inc. $ 6,514 $ (4,126) Earnings (loss) per share of Class A common stock: Basic $ 0.18 $ (0.12) Diluted $ 0.17 $ (0.12) Weighted average shares of Class A common stock outstanding: Basic 36,194 34,944 Diluted 37,839 34,944 Three Months Ended March 31, (In thousands, except per share data)
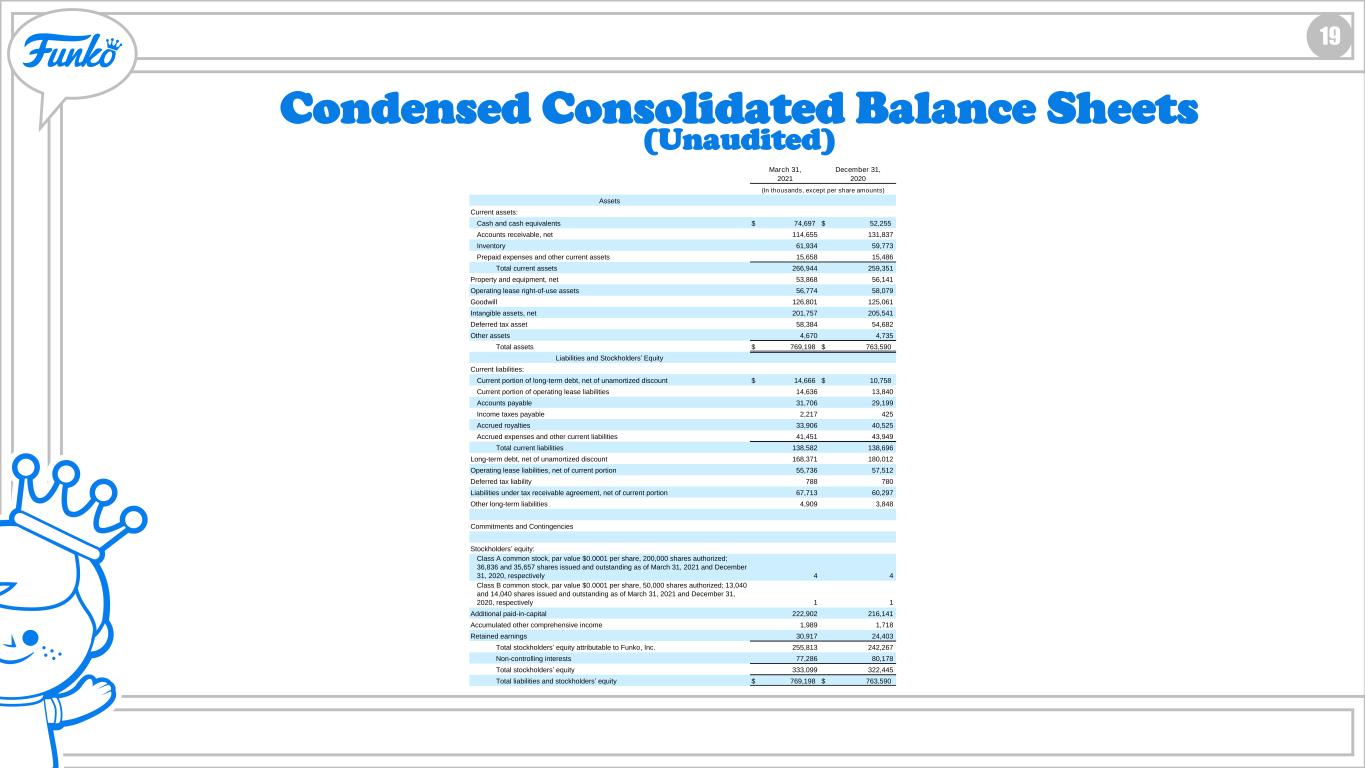
HOLLYWOOD UPDATE 19 Condensed Consolidated Balance Sheets (Unaudited) March 31, 2021 December 31, 2020 Assets Current assets: Cash and cash equivalents $ 74,697 $ 52,255 Accounts receivable, net 114,655 131,837 Inventory 61,934 59,773 Prepaid expenses and other current assets 15,658 15,486 Total current assets 266,944 259,351 Property and equipment, net 53,868 56,141 Operating lease right-of-use assets 56,774 58,079 Goodwill 126,801 125,061 Intangible assets, net 201,757 205,541 Deferred tax asset 58,384 54,682 Other assets 4,670 4,735 Total assets $ 769,198 $ 763,590 Liabilities and Stockholders’ Equity Current liabilities: Current portion of long-term debt, net of unamortized discount $ 14,666 $ 10,758 Current portion of operating lease liabilities 14,636 13,840 Accounts payable 31,706 29,199 Income taxes payable 2,217 425 Accrued royalties 33,906 40,525 Accrued expenses and other current liabilities 41,451 43,949 Total current liabilities 138,582 138,696 Long-term debt, net of unamortized discount 168,371 180,012 Operating lease liabilities, net of current portion 55,736 57,512 Deferred tax liability 788 780 Liabilities under tax receivable agreement, net of current portion 67,713 60,297 Other long-term liabilities 4,909 3,848 Commitments and Contingencies Stockholders’ equity: Class A common stock, par value $0.0001 per share, 200,000 shares authorized; 36,836 and 35,657 shares issued and outstanding as of March 31, 2021 and December 31, 2020, respectively 4 4 Class B common stock, par value $0.0001 per share, 50,000 shares authorized; 13,040 and 14,040 shares issued and outstanding as of March 31, 2021 and December 31, 2020, respectively 1 1 Additional paid-in-capital 222,902 216,141 Accumulated other comprehensive income 1,989 1,718 Retained earnings 30,917 24,403 Total stockholders’ equity attributable to Funko, Inc. 255,813 242,267 Non-controlling interests 77,286 80,178 Total stockholders’ equity 333,099 322,445 Total liabilities and stockholders’ equity $ 769,198 $ 763,590 (In thousands, except per share amounts)
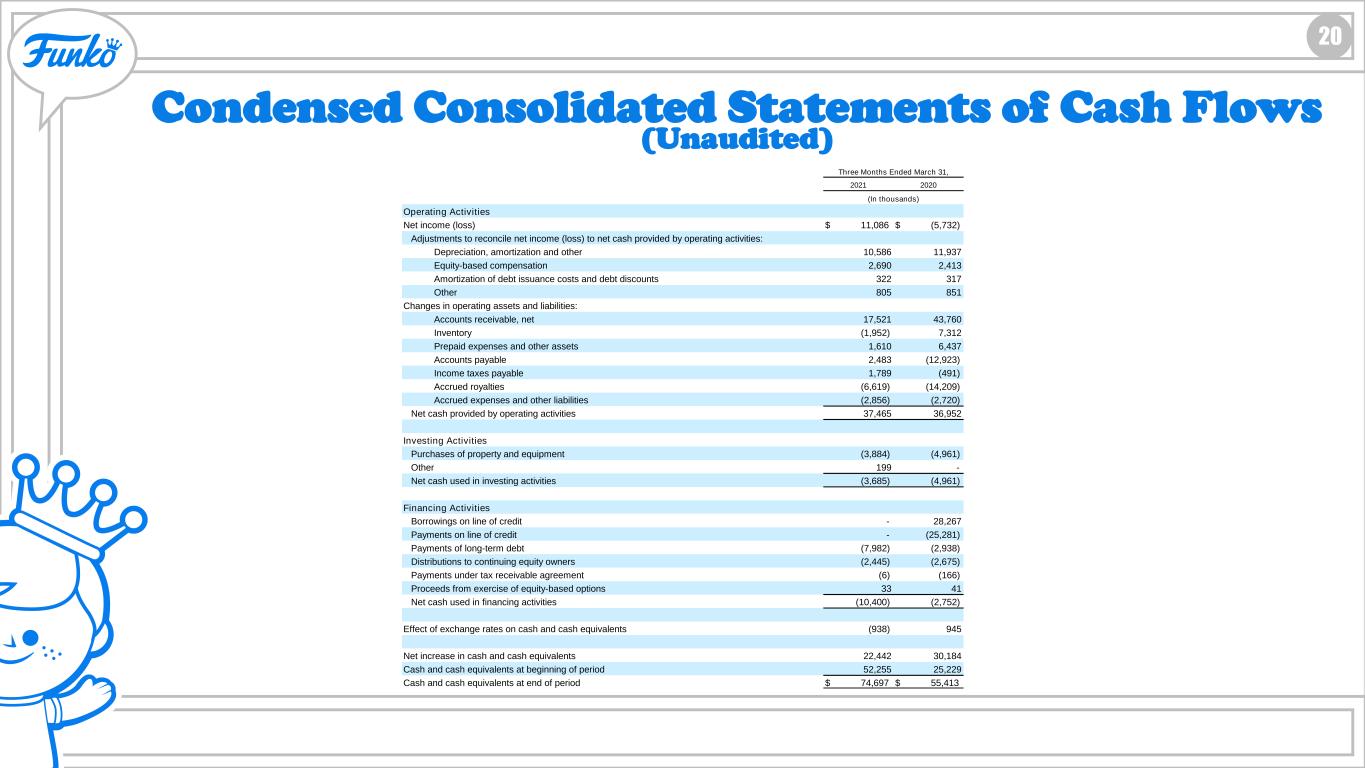
HOLLYWOOD UPDATE 20 Condensed Consolidated Statements of Cash Flows (Unaudited) 2021 2020 Operating Activities Net income (loss) $ 11,086 $ (5,732) Adjustments to reconcile net income (loss) to net cash provided by operating activities: Depreciation, amortization and other 10,586 11,937 Equity-based compensation 2,690 2,413 Amortization of debt issuance costs and debt discounts 322 317 Other 805 851 Changes in operating assets and liabilities: Accounts receivable, net 17,521 43,760 Inventory (1,952) 7,312 Prepaid expenses and other assets 1,610 6,437 Accounts payable 2,483 (12,923) Income taxes payable 1,789 (491) Accrued royalties (6,619) (14,209) Accrued expenses and other liabilities (2,856) (2,720) Net cash provided by operating activities 37,465 36,952 Investing Activities Purchases of property and equipment (3,884) (4,961) Other 199 - Net cash used in investing activities (3,685) (4,961) Financing Activities Borrowings on line of credit - 28,267 Payments on line of credit - (25,281) Payments of long-term debt (7,982) (2,938) Distributions to continuing equity owners (2,445) (2,675) Payments under tax receivable agreement (6) (166) Proceeds from exercise of equity-based options 33 41 Net cash used in financing activities (10,400) (2,752) Effect of exchange rates on cash and cash equivalents (938) 945 Net increase in cash and cash equivalents 22,442 30,184 Cash and cash equivalents at beginning of period 52,255 25,229 Cash and cash equivalents at end of period $ 74,697 $ 55,413 Three Months Ended March 31, (In thousands)
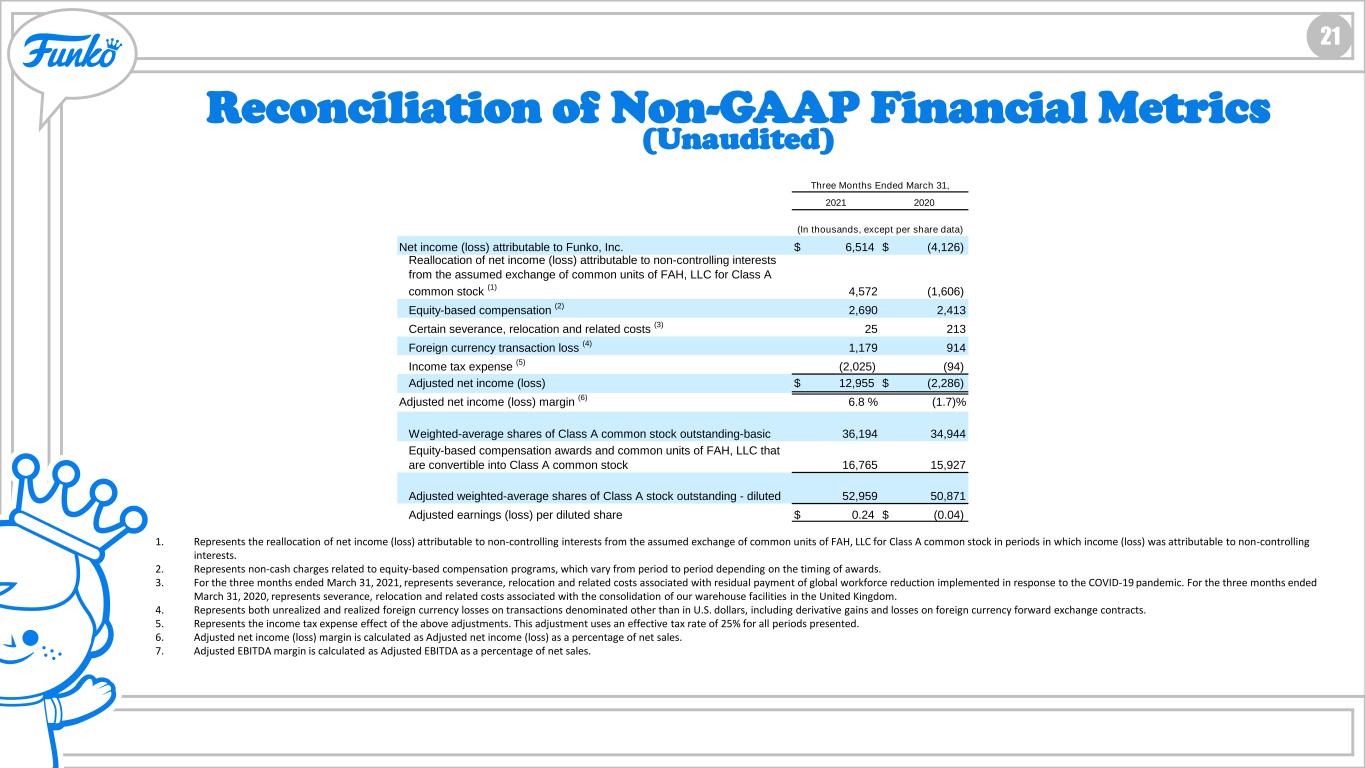
HOLLYWOOD UPDATE 21 Reconciliation of Non-GAAP Financial Metrics (Unaudited) 1. Represents the reallocation of net income (loss) attributable to non-controlling interests from the assumed exchange of common units of FAH, LLC for Class A common stock in periods in which income (loss) was attributable to non-controlling interests. 2. Represents non-cash charges related to equity-based compensation programs, which vary from period to period depending on the timing of awards. 3. For the three months ended March 31, 2021, represents severance, relocation and related costs associated with residual payment of global workforce reduction implemented in response to the COVID-19 pandemic. For the three months ended March 31, 2020, represents severance, relocation and related costs associated with the consolidation of our warehouse facilities in the United Kingdom. 4. Represents both unrealized and realized foreign currency losses on transactions denominated other than in U.S. dollars, including derivative gains and losses on foreign currency forward exchange contracts. 5. Represents the income tax expense effect of the above adjustments. This adjustment uses an effective tax rate of 25% for all periods presented. 6. Adjusted net income (loss) margin is calculated as Adjusted net income (loss) as a percentage of net sales. 7. Adjusted EBITDA margin is calculated as Adjusted EBITDA as a percentage of net sales. 2021 2020 Net income (loss) attributable to Funko, Inc. $ 6,514 $ (4,126) Reallocation of net income (loss) attributable to non-controlling interests from the assumed exchange of common units of FAH, LLC for Class A common stock (1) 4,572 (1,606) Equity-based compensation (2) 2,690 2,413 Certain severance, relocation and related costs (3) 25 213 Foreign currency transaction loss (4) 1,179 914 Income tax expense (5) (2,025) (94) Adjusted net income (loss) $ 12,955 $ (2,286) Adjusted net income (loss) margin (6) 6.8 % (1.7)% Weighted-average shares of Class A common stock outstanding-basic 36,194 34,944 Equity-based compensation awards and common units of FAH, LLC that are convertible into Class A common stock 16,765 15,927 Adjusted weighted-average shares of Class A stock outstanding - diluted 52,959 50,871 Adjusted earnings (loss) per diluted share $ 0.24 $ (0.04) Three Months Ended March 31, (In thousands, except per share data)
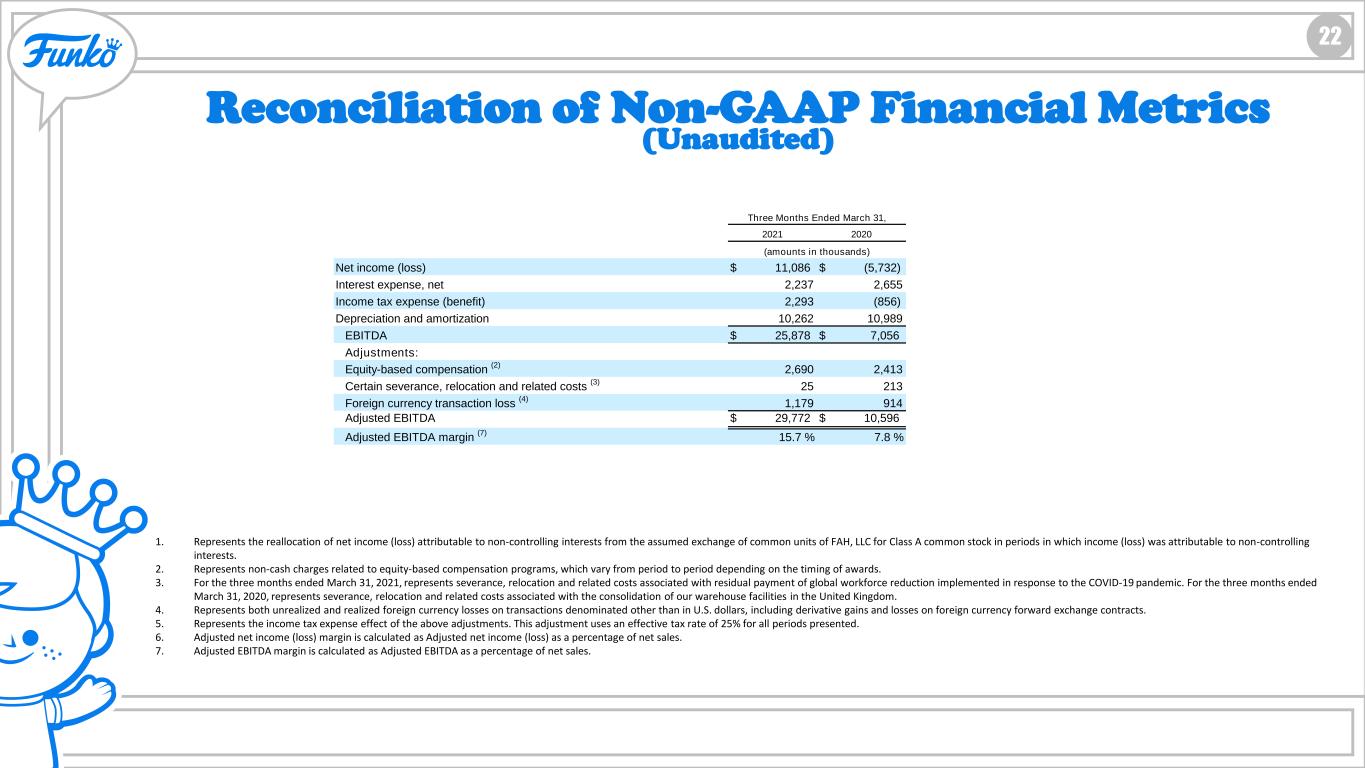
22 Reconciliation of Non-GAAP Financial Metrics (Unaudited) 1. Represents the reallocation of net income (loss) attributable to non-controlling interests from the assumed exchange of common units of FAH, LLC for Class A common stock in periods in which income (loss) was attributable to non-controlling interests. 2. Represents non-cash charges related to equity-based compensation programs, which vary from period to period depending on the timing of awards. 3. For the three months ended March 31, 2021, represents severance, relocation and related costs associated with residual payment of global workforce reduction implemented in response to the COVID-19 pandemic. For the three months ended March 31, 2020, represents severance, relocation and related costs associated with the consolidation of our warehouse facilities in the United Kingdom. 4. Represents both unrealized and realized foreign currency losses on transactions denominated other than in U.S. dollars, including derivative gains and losses on foreign currency forward exchange contracts. 5. Represents the income tax expense effect of the above adjustments. This adjustment uses an effective tax rate of 25% for all periods presented. 6. Adjusted net income (loss) margin is calculated as Adjusted net income (loss) as a percentage of net sales. 7. Adjusted EBITDA margin is calculated as Adjusted EBITDA as a percentage of net sales. 2021 2020 Net income (loss) $ 11,086 $ (5,732) Interest expense, net 2,237 2,655 Income tax expense (benefit) 2,293 (856) Depreciation and amortization 10,262 10,989 EBITDA $ 25,878 $ 7,056 Adjustments: Equity-based compensation (2) 2,690 2,413 Certain severance, relocation and related costs (3) 25 213 Foreign currency transaction loss (4) 1,179 914 Adjusted EBITDA $ 29,772 $ 10,596 Adjusted EBITDA margin (7) 15.7 % 7.8 % Three Months Ended March 31, (amounts in thousands)

