Attached files
| file | filename |
|---|---|
| EX-99.1 - EXHIBIT 99.1 - CURTISS WRIGHT CORP | a52424139ex991.htm |
| 8-K - CURTISS-WRIGHT CORPORATION 8-K - CURTISS WRIGHT CORP | a52424139.htm |
Exhibit 99.2

Q1 2021 Earnings Conference CallMay 6, 2021 NYSE: CW Listen-Only dial-in numbers:(844) 220-4970
(domestic)(262) 558-6349 (international)Conference ID: 3289007

Safe Harbor Statement Please note that the information provided in this presentation is accurate as of
the date of the original presentation. The presentation will remain posted on this website from one to twelve months following the initial presentation, but content will not be updated to reflect new information that may become available after
the original presentation posting. The presentation contains forward-looking statements within the meaning of Section 27A of the Securities Act of 1933, as amended ("Securities Act"), Section 21E of the Securities Exchange Act of 1934, as
amended ("Exchange Act"), and the Private Securities Litigation Reform Act of 1995. Such forward-looking statements only speak as of the date of this report and Curtiss-Wright Corporation assumes no obligation to update the information included
in this report. Such forward-looking statements include, among other things, management's estimates of future performance, revenue and earnings, our management's growth objectives, our management’s ability to integrate our acquisition, and our
management's ability to produce consistent operating improvements. These forward-looking statements are based on expectations as of the time the statements were made only, and are subject to a number of risks and uncertainties which could cause
us to fail to achieve our then-current financial projections and other expectations, including the impact of a global pandemic or national epidemic. Any references to organic growth exclude the effects of restructuring costs, foreign currency
fluctuations, acquisitions and divestitures, unless otherwise noted. This presentation also includes certain non-GAAP financial measures with reconciliations to GAAP financial measures being made available in the earnings release that is posted
to our website and furnished with the SEC. We undertake no duty to update this information. More information about potential factors that could affect our business and financial results is included in our filings with the Securities and
Exchange Commission, including our Annual Reports on Form 10-K and Quarterly Reports on Form 10-Q, including, among other sections, under the captions, "Risk Factors" and "Management's Discussion and Analysis of Financial Condition and Results
of Operations," which is on file with the SEC and available at the SEC's website at www.sec.gov.

Strong Start to 2021: First Quarter Performance and Full-Year Guidance Highlights First Quarter 2021
Highlights FY 2021 Adjusted Guidance Highlights Adjusted Net Sales increased 2% overall; Aerospace & Defense markets up 8%Adjusted Operating Income up 15%; Adjusted Operating Margin up 160 bps to 15.0% Driven by strong defense market
sales and benefits of cost containment and restructuring savings; Continued strategic R&D investmentsAdjusted Diluted EPS of $1.51, up 18%Driven by double-digit increase in operating income and benefit of share repurchaseReported FCF of
($35M), up 83%; Adjusted FCF up 34%New orders of $571M, up 3%, led by a strong 1.2x book to bill in our commercial marketsPacStar acquisition integration going well Raised full-year guidance for Sales, Operating Income, Operating Margin and
EPSExpect sales growth of 7% - 9%, with solid growth in both A&D and commercial end marketsSolid operating income growth of 9% - 11% outpacing sales growth, and driving continued margin expansion of 30 - 40 bps to 16.6% - 16.7%Adjusted
diluted EPS increased by $0.10 to new range of $7.10 - $7.30, up 8% - 11% Maintained FCF guidance range of $330 - $360M; Adj. FCF conversion >110% Notes: First quarter 2021 Adjusted results and full-year 2021 Adjusted guidance exclude our
build-to-print actuation product line supporting the Boeing 737 MAX program which we exited and our German valves business which was classified as held for sale, both in the fourth quarter of 2020 impacting both periods; one-time inventory
step-up, backlog amortization and transaction costs for acquisitions in both periods; and restructuring costs in the prior year period. Full-year 2021 Adjusted guidance also excludes a one-time pension settlement charge related to the
retirement of two former executives (within non-operating income).

First Quarter 2021 Financial Review ($ in millions) Q1’21 Adjusted Q1’20 Adjusted Chg vs. Q1’20 Key
Drivers Aerospace & Industrial $178 $208 (15%) Reduced YOY demand in commercial aerospace (principally widebody jets)Partially offset by higher industrial vehicle sales Defense Electronics $182 $140 31% Solid 4% organic growth,
led by aerospace defense (helicopter and UAV platforms)Strong contribution from PacStar acquisition Naval & Power $230 $228 1% Strong growth in naval defense (Virginia submarine and CVN-81 aircraft carrier platforms) Mainly offset by
lower commercial power generation and process revenues Total Sales $590 $576 2% Aerospace & IndustrialMargin $19 10.4% $28 13.7% (35%) (330 bps) Benefits of restructuring savings and ongoing cost reduction measures helped to
partially mitigate unfavorable absorption on lower sales Defense ElectronicsMargin $38 20.9% $27 19.2% 42%170 bps Favorable absorption and mix on higher organic salesAcquisition accretive to operating income, but dilutive on operating
margin Benefits of cost containment initiatives more than offset by increased R&D Naval & PowerMargin $41 17.7% $33 14.7% 21% 300 bps Favorable mix on strong naval defense revenuesBenefits of restructuring savings Corporate and
Other ($9) ($12) 27% Lower FX Total Op. IncomeCW Margin $89 15.0% $77 13.4% 15%160 bps Notes: Amounts may not add down due to rounding. First quarter 2021 Adjusted results exclude our build-to-print actuation product line
supporting the Boeing 737 MAX program which we exited and our German valves business which was classified as held for sale, both in the fourth quarter of 2020 impacting both periods; one-time inventory step-up, backlog amortization and
transaction costs for acquisitions in both periods; and restructuring costs in the prior year period. Results also reflect the first quarter 2021 segment reorganization.

2021E End Market Sales Growth (Guidance as of May 5, 2021) 2021E Growth vs 2020(Prior) 2021E Growth
vs 2020(Current) 2021E % Sales 2021 Key Drivers Aero Defense 2% - 4% 2% - 4% 19% Favorable growth on C5ISR and helicopter programs Ground Defense 100% - 105% 100% - 105% 9% Contribution from PacStar acquisition (HSD growth
rate) Naval Defense Flat Flat 28% Solid growth on aircraft carriers offset by lower sub revenues (timing)Long-term growth trend intact following 22% increase in 2020 Commercial Aero Flat Flat 10% Core OEM and Aftermarket
stabilizing Total Aerospace & Defense Markets 6% - 8% 7% - 9% 66% Stronger backlog across Defense markets Power & Process 3% - 5% 3% - 5% 19% Higher U.S. nuclear aftermarket partially offset by lower CAP1000 program
revenues (timing) Solid growth in valves sales in Process market General Industrial 9% - 11% 9% - 11% 15% Strong rebound across most industrial markets Total Commercial Markets 6% - 8% 6% - 8% 34% Total Curtiss-Wright 6% -
8% 7% - 9% 100% Organic growth up 2% - 4% Notes: Amounts may not add down due to rounding. Full-year 2021 Adjusted sales guidance excludes our build-to-print actuation product line supporting the Boeing 737 MAX program which we exited, as
well as our German valves business which was classified as held for sale, both in the fourth quarter of 2020. Updated (in blue)

($ in millions) 2021E Adjusted (1)(Prior) 2021E Adjusted (1)(Current) 2021E Change vs 2020 Adjusted
(1,2) Aerospace & Industrial $745 - 760 $745 - 760 1% - 3% Strong rebound in general industrial markets; partially offset by lower A&D Defense Electronics $740 - 755 $745 - 760 22% - 24% Solid organic growth (up 4-6%)
driven by higher Aero Defense salesPacStar contributing HSD revenue growth Naval & Power $960 - 980 $960 - 980 1% - 3% Modest sales increases in Naval and Power & Process markets Total Sales $2,445 - 2,495 $2,450 - 2,500 7% -
9% Organic growth up 2% - 4% Aerospace & IndustrialMargin $112 - 115 15.0% - 15.2% $112 - 115 15.0% - 15.2% 14% - 18%170 - 190 bps Benefit of PY restructuring savingsSegment profitability returning to 2019 levels Defense
ElectronicsMargin $157 - 162 21.2% - 21.4% $159 - 164 21.3% - 21.5% 10% - 13% (210 - 230 bps) Benefit of strong organic salesAcquisition accretive to operating income, but dilutive on operating margin Accelerated R&D investments $6M;
Unfavorable mix (more systems work) Naval & PowerMargin $172 - 177 18.0% - 18.1% $174 - 179 18.2% - 18.3% 2% - 5% 20 - 30 bps Benefit of PY restructuring savingsImproved segment profitability despite winding down on CAP1000
program Corporate and Other ($38 - 39) ($37 - 39) ~ Flat Total Op. IncomeCW Margin $404 - 41416.5% - 16.6% $408 - 41816.6% - 16.7% 9% - 11% +30 - 40 bps Remain on path to 17% margin despite R&D increase ($10M) 2021E Financial
Outlook (Guidance as of May 5, 2021) Note: Amounts may not add down due to rounding. 2020 financial results and 2021 Adjusted guidance exclude our build-to-print actuation product line supporting the Boeing 737 MAX program which we exited, as
well as our German valves business which was classified as held for sale, both in the fourth quarter of 2020.2021 Adjusted financials exclude first year purchase accounting costs associated with acquisitions.2020 Adjusted results exclude
restructuring costs, first year purchase accounting costs associated with acquisitions, a non-cash impairment of capitalized development costs related to a commercial aerospace program, and one-time transition and IT security costs related to
the relocation of the DRG business. Updated (in blue)

2021E Financial Outlook (Guidance as of May 5, 2021) ($ in millions, except EPS) 2021E Adjusted
(1)(Prior) 2021E Adjusted (1)(Current) Total Operating Income(2) $404 - 414 $408 - 418 Solid growth, up 9-11%, despite increased R&D ($10M) Other Income/(Expense) $15 - 17 $15 - 17 Interest Expense ($41 - 42) ($41 -
42) Diluted EPS(2) $7.00 - 7.20 $7.10 - 7.30 Solid growth, up 8-11%, despite increased R&D ($0.18) Diluted Shares Outstanding 41.4 41.3 Minimum $50 million in share repurchases Free Cash Flow $330 - 360 $330 - 360 Maintain
solid FCF generation following record 2020 Free Cash Flow Conversion 114% - 121% 113% - 120% Remain above 110% long-term target Capital Expenditures $50 - 60 $50 - 60 Return to normal discretionary spending Depreciation &
Amortization $115 - 125 $115 - 125 Notes: Amounts may not add down due to rounding. 2020 financial results and 2021 Adjusted guidance exclude our build-to-print actuation product line supporting the Boeing 737 MAX program which we exited,
as well as our German valves business which was classified as held for sale, both in the fourth quarter of 2020. Free Cash Flow is defined as cash flow from operations less capital expenditures. FCF Conversion is calculated as free cash flow
divided by net earnings from continuing operations. Adjusted FCF Conversion is calculated as adjusted free cash flow divided by net earnings from continuing operations.2021 Adjusted financials are defined as Reported Operating Income, Operating
Margin, Net Income and Diluted EPS under GAAP excluding first year purchase accounting costs associated with acquisitions, and a one-time, $3 million pension settlement charge related to the retirement of two former executives (within
non-operating income).2020 Adjusted results exclude restructuring costs, first year purchase accounting costs associated with acquisitions, a non-cash impairment of capitalized development costs related to a commercial aerospace program,
one-time transition and IT security costs related to the relocation of the DRG business, and a $10 million non-cash currency translation loss (within non-operating income) related to the liquidation of a foreign legal entity. Updated (in blue)
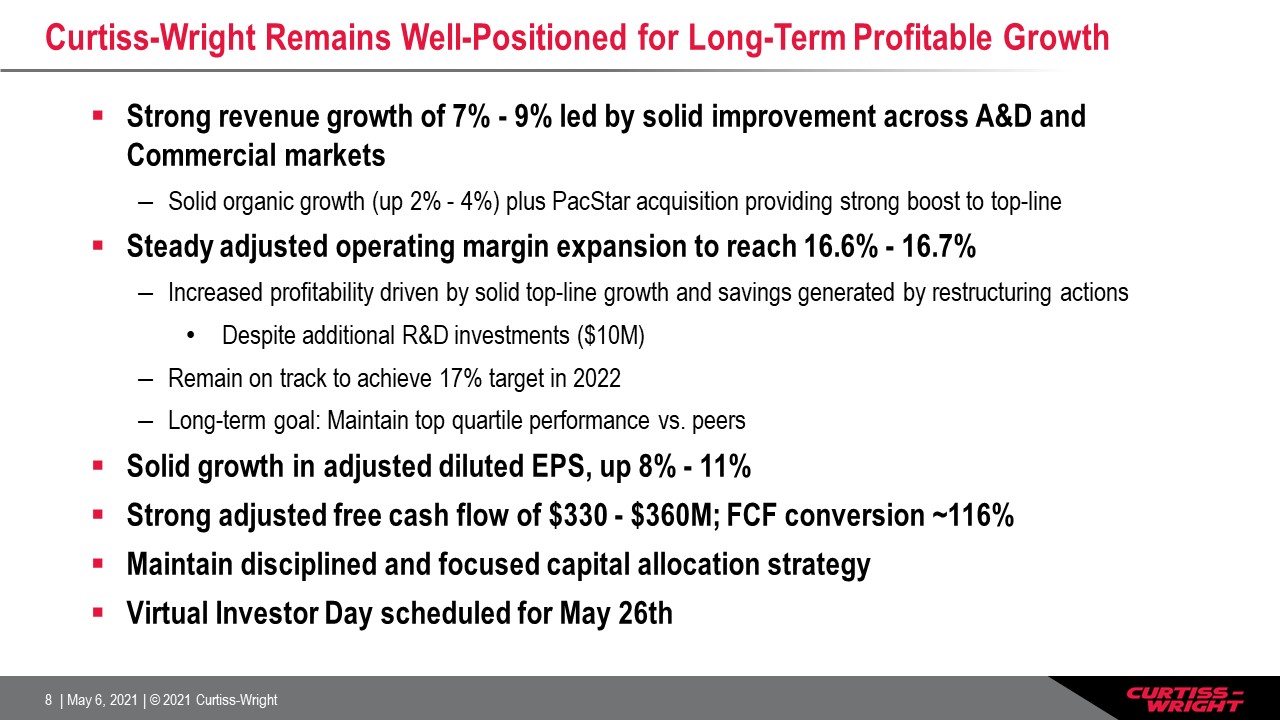
Curtiss-Wright Remains Well-Positioned for Long-Term Profitable Growth Strong revenue growth of 7% - 9%
led by solid improvement across A&D and Commercial marketsSolid organic growth (up 2% - 4%) plus PacStar acquisition providing strong boost to top-lineSteady adjusted operating margin expansion to reach 16.6% - 16.7% Increased profitability
driven by solid top-line growth and savings generated by restructuring actionsDespite additional R&D investments ($10M)Remain on track to achieve 17% target in 2022Long-term goal: Maintain top quartile performance vs. peersSolid growth in
adjusted diluted EPS, up 8% - 11%Strong adjusted free cash flow of $330 - $360M; FCF conversion ~116% Maintain disciplined and focused capital allocation strategyVirtual Investor Day scheduled for May 26th

Appendix Non-GAAP Financial Results The company reports its financial performance in accordance with
accounting principles generally accepted in the United States of America ("GAAP"). This press release refers to "Adjusted" amounts, which are Non-GAAP financial measures described below. We utilize a number of different financial measures in
analyzing and assessing the overall performance of our business, and in making operating decisions, forecasting and planning for future periods. We consider the use of the non-GAAP measures to be helpful in assessing the performance of the
ongoing operation of our business. We believe that disclosing non-GAAP financial measures provides useful supplemental data that, while not a substitute for financial measures prepared in accordance with GAAP, allows for greater transparency in
the review of our financial and operational performance. The Company’s presentation of its financials and guidance includes an Adjusted (non-GAAP) view that excludes (i) the results of a build-to-print actuation product line supporting the
Boeing 737 MAX program which we exited and a German valves business classified as held for sale, both in the fourth quarter of 2020; (ii) significant restructuring costs in 2020 associated with its operations, including one-time actions taken
in response to COVID-19; (iii) a non-cash impairment of capitalized development costs related to a commercial aerospace program in the prior period; (iv) first year purchase accounting costs associated with its acquisitions in both periods,
including one-time inventory step-up, backlog amortization, deferred revenue adjustments and transaction costs; and (v) one-time transition and IT security costs, and capital investments, specifically associated with the relocation of the DRG
business in the Naval & Power segment in the prior period. Transition costs include relocation of employees and equipment as well as overlapping facility and labor costs associated with the relocation. We believe this Adjusted view will
provide improved transparency in order to better measure Curtiss-Wright’s ongoing operating and financial performance and better comparisons of our key financial metrics to our peers. Reconciliations of “Reported” GAAP amounts to “Adjusted”
non-GAAP amounts are furnished within this presentation and in the earnings press release.Reconciliations of “Reported” GAAP amounts to “Adjusted” non-GAAP amounts are furnished with this presentation. All per share amounts are reported on a
diluted basis. The following definitions are provided: Adjusted Operating Income, Operating Margin, Net Earnings and Diluted EPSThese Adjusted financials are defined as Reported Operating Income, Operating Margin, Net Earnings and Diluted
Earnings per Share (EPS) under GAAP excluding: (i) the impact of first year purchase accounting costs associated with acquisitions for current and prior year periods, specifically one-time inventory step-up, backlog amortization and transaction
costs; (ii) one-time transition and IT security costs associated with the relocation of a business in the current year period; (iii) the non-cash impairment of capitalized development costs related to a commercial aerospace program; and (iv)
significant restructuring costs in 2020 associated with its operations, (v) a build-to-print actuation product line supporting the Boeing 737 MAX program which we exited, and (vi) the results of a German valves business classified as held for
sale in the fourth quarter of 2020.Free Cash Flow and Free Cash Flow ConversionThe Corporation discloses free cash flow because it measures cash flow available for investing and financing activities. Free cash flow represents cash available to
repay outstanding debt, invest in the business, acquire businesses, return capital to shareholders and make other strategic investments. Free cash flow is defined as cash flow provided by operating activities less capital expenditures. Adjusted
free cash flow excludes: (i) a capital investment in the Naval & Power segment related to the new, state-of-the-art naval facility principally for DRG; (ii) a voluntary contribution to the Company’s corporate defined benefit pension plan
made in the first quarter of 2020; and (iii) the cash impact from restructuring in 2020. The Corporation discloses free cash flow conversion because it measures the proportion of net earnings converted into free cash flow and is defined as free
cash flow divided by net earnings from continuing operations. Adjusted free cash flow conversion is defined as Adjusted free cash flow divided by Adjusted net earnings.

First Quarter 2021 End Market Sales Growth Notes: Percentages in chart relate to First Quarter 2021
sales compared to the prior year quarter. Amounts may not add due to rounding. Q1’21Change % of Total Sales Aero Defense 9% 19% Ground Defense 151% 10% Naval Defense 7% 30% Commercial Aero (33%) 9% Total Aerospace &
Defense Markets 8% 68% Power & Process (15%) 17% General Industrial 4% 15% Total Commercial Markets (7%) 32% Total Curtiss-Wright 2% 100% Commercial Markets: Power & Process: Lower domestic aftermarket power
generation revenues; Reduced valves sales to energy marketsGeneral Industrial: Improved demand for industrial vehicles products mainly offset by reduced automation and services sales Key DriversAerospace & Defense Markets:Aerospace
Defense: Higher defense electronics revenues on helicopter and UAV programs Ground Defense: Higher tactical battlefield communications equipment revenues (PacStar)Naval Defense: Higher revenues on Virginia class submarine and CVN-81 aircraft
carrier programs, and higher service center revenues; Partially offset by lower CVN-80 revenuesCommercial Aerospace: Lower sales of equipment and surface treatment services, principally on widebody platforms

2021E End Market Sales Waterfall (as of May 5, 2021) FY’21 Guidance:Overall UP 7 - 9%A&D Markets UP
7 - 9%Comm’l Markets UP 6 - 8% Notes:Power & Process market sales concentrated in Naval & Power segmentGeneral Industrial sales concentrated in Aerospace & Industrial segment

Non-GAAP Reconciliation – 2020 vs 2021 (Adjusted)

Non-GAAP Reconciliation – 2020 vs 2021 (Adjusted)

Non-GAAP Reconciliations – Q1 2021 Results (In millions, except EPS) Q1-2021 Q1-2020 Change Net
sales $ 597.1 $ 601.2 (1%) Adjustments (1) (7.1) (25.6) Adjusted net sales $ 590.0 $ 575.7 2% Reported operating income (GAAP) $ 85.1 $ 72.4 17% Adjustments (1) 3.7 4.5 Adjusted operating income (Non-GAAP) $ 88.8 $
76.9 15% Adjusted operating margin (Non-GAAP) 15.0% 13.4% 160 bps Reported net earnings (GAAP) $ 59.5 $ 51.8 15% Adjustments, net of tax (1) 2.8 3.3 Adjusted net earnings (Non-GAAP) $ 62.3 $ 55.1 13% Reported diluted
EPS (GAAP) $ 1.45 $ 1.21 20% Adjustments, net of tax (1) 0.07 0.08 Adjusted diluted EPS (Non-GAAP) $ 1.51 $ 1.29 18% Amounts may not add due to rounding.(1) First quarter 2021 Adjusted results exclude our build-to-print
actuation product line supporting the Boeing 737 MAX program which we exited and our German valves business which was classified as held for sale, both in the fourth quarter of 2020 impacting both periods; one-time inventory step-up, backlog
amortization and transaction costs for acquisitions in both periods; and one-time transition and IT security costs associated with the relocation of our DRG business and restructuring costs in the prior year period.

Non-GAAP Reconciliation – Organic Results Organic Sales and Organic Operating IncomeThe Corporation
discloses organic sales and organic operating income because the Corporation believes it provides investors with insight as to the Company’s ongoing business performance. Organic sales and organic operating income are defined as revenue and
operating income excluding the impact of restructuring costs, impairment of assets held for sale, foreign currency fluctuations and contributions from acquisitions made during the last twelve months.Note: Amounts may not add due to rounding