Attached files
| file | filename |
|---|---|
| 8-K - 8-K - CHESAPEAKE UTILITIES CORP | d941855d8k.htm |
Exhibit 99.1 First Quarter 2021 Earnings Call May 5, 2021Exhibit 99.1 First Quarter 2021 Earnings Call May 5, 2021

Jeff Householder President & CEO Presenters Beth Cooper Executive Vice President, CFO and Asst. Secretary Jim Moriarty Executive Vice President, General Counsel , Corporate Secretary and Chief Policy and Risk Officer 2Jeff Householder President & CEO Presenters Beth Cooper Executive Vice President, CFO and Asst. Secretary Jim Moriarty Executive Vice President, General Counsel , Corporate Secretary and Chief Policy and Risk Officer 2
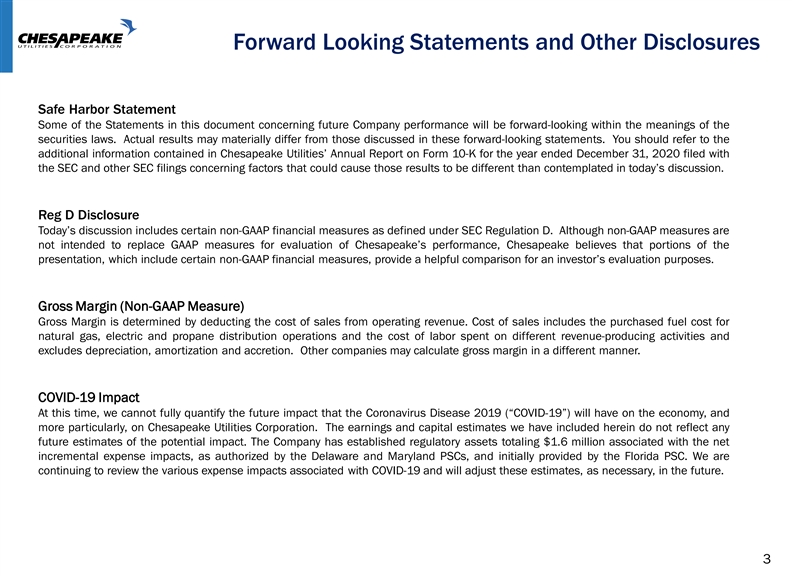
Forward Looking Statements and Other Disclosures Safe Harbor Statement Some of the Statements in this document concerning future Company performance will be forward-looking within the meanings of the securities laws. Actual results may materially differ from those discussed in these forward-looking statements. You should refer to the additional information contained in Chesapeake Utilities’ Annual Report on Form 10-K for the year ended December 31, 2020 filed with the SEC and other SEC filings concerning factors that could cause those results to be different than contemplated in today’s discussion. Reg D Disclosure Today’s discussion includes certain non-GAAP financial measures as defined under SEC Regulation D. Although non-GAAP measures are not intended to replace GAAP measures for evaluation of Chesapeake’s performance, Chesapeake believes that portions of the presentation, which include certain non-GAAP financial measures, provide a helpful comparison for an investor’s evaluation purposes. Gross Margin (Non-GAAP Measure) Gross Margin is determined by deducting the cost of sales from operating revenue. Cost of sales includes the purchased fuel cost for natural gas, electric and propane distribution operations and the cost of labor spent on different revenue-producing activities and excludes depreciation, amortization and accretion. Other companies may calculate gross margin in a different manner. COVID-19 Impact At this time, we cannot fully quantify the future impact that the Coronavirus Disease 2019 (“COVID-19”) will have on the economy, and more particularly, on Chesapeake Utilities Corporation. The earnings and capital estimates we have included herein do not reflect any future estimates of the potential impact. The Company has established regulatory assets totaling $1.6 million associated with the net incremental expense impacts, as authorized by the Delaware and Maryland PSCs, and initially provided by the Florida PSC. We are continuing to review the various expense impacts associated with COVID-19 and will adjust these estimates, as necessary, in the future. 3Forward Looking Statements and Other Disclosures Safe Harbor Statement Some of the Statements in this document concerning future Company performance will be forward-looking within the meanings of the securities laws. Actual results may materially differ from those discussed in these forward-looking statements. You should refer to the additional information contained in Chesapeake Utilities’ Annual Report on Form 10-K for the year ended December 31, 2020 filed with the SEC and other SEC filings concerning factors that could cause those results to be different than contemplated in today’s discussion. Reg D Disclosure Today’s discussion includes certain non-GAAP financial measures as defined under SEC Regulation D. Although non-GAAP measures are not intended to replace GAAP measures for evaluation of Chesapeake’s performance, Chesapeake believes that portions of the presentation, which include certain non-GAAP financial measures, provide a helpful comparison for an investor’s evaluation purposes. Gross Margin (Non-GAAP Measure) Gross Margin is determined by deducting the cost of sales from operating revenue. Cost of sales includes the purchased fuel cost for natural gas, electric and propane distribution operations and the cost of labor spent on different revenue-producing activities and excludes depreciation, amortization and accretion. Other companies may calculate gross margin in a different manner. COVID-19 Impact At this time, we cannot fully quantify the future impact that the Coronavirus Disease 2019 (“COVID-19”) will have on the economy, and more particularly, on Chesapeake Utilities Corporation. The earnings and capital estimates we have included herein do not reflect any future estimates of the potential impact. The Company has established regulatory assets totaling $1.6 million associated with the net incremental expense impacts, as authorized by the Delaware and Maryland PSCs, and initially provided by the Florida PSC. We are continuing to review the various expense impacts associated with COVID-19 and will adjust these estimates, as necessary, in the future. 3
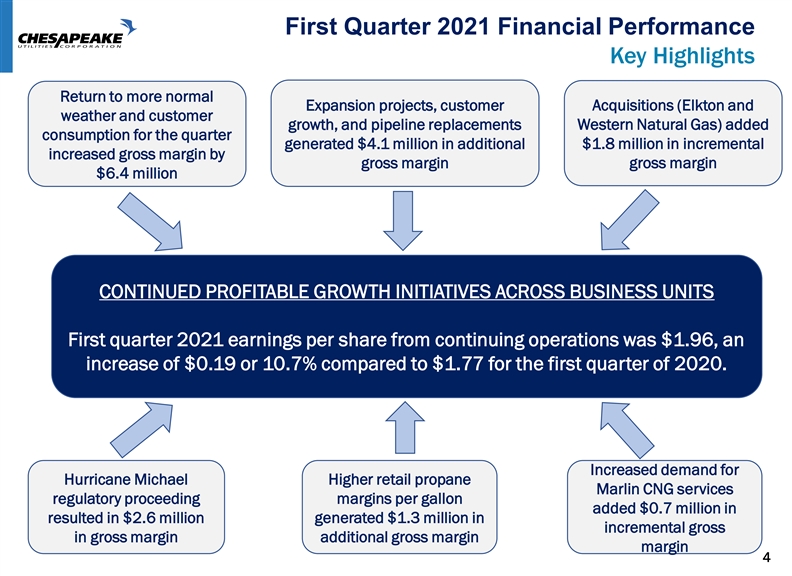
First Quarter 2021 Financial Performance Key Highlights Return to more normal Acquisitions (Elkton and Expansion projects, customer weather and customer growth, and pipeline replacements Western Natural Gas) added consumption for the quarter generated $4.1 million in additional $1.8 million in incremental increased gross margin by gross margin gross margin $6.4 million CONTINUED PROFITABLE GROWTH INITIATIVES ACROSS BUSINESS UNITS First quarter 2021 earnings per share from continuing operations was $1.96, an increase of $0.19 or 10.7% compared to $1.77 for the first quarter of 2020. Increased demand for Hurricane Michael Higher retail propane Marlin CNG services regulatory proceeding margins per gallon added $0.7 million in resulted in $2.6 million generated $1.3 million in incremental gross in gross margin additional gross margin margin 4First Quarter 2021 Financial Performance Key Highlights Return to more normal Acquisitions (Elkton and Expansion projects, customer weather and customer growth, and pipeline replacements Western Natural Gas) added consumption for the quarter generated $4.1 million in additional $1.8 million in incremental increased gross margin by gross margin gross margin $6.4 million CONTINUED PROFITABLE GROWTH INITIATIVES ACROSS BUSINESS UNITS First quarter 2021 earnings per share from continuing operations was $1.96, an increase of $0.19 or 10.7% compared to $1.77 for the first quarter of 2020. Increased demand for Hurricane Michael Higher retail propane Marlin CNG services regulatory proceeding margins per gallon added $0.7 million in resulted in $2.6 million generated $1.3 million in incremental gross in gross margin additional gross margin margin 4
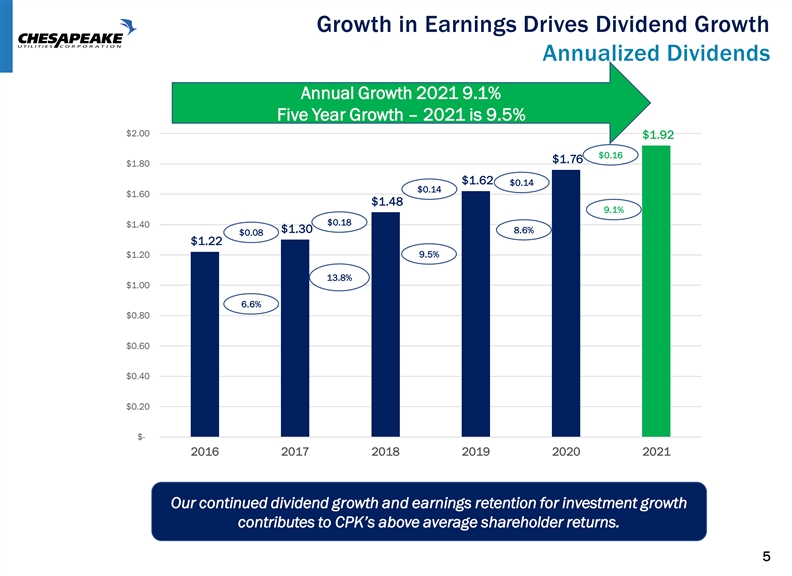
Growth in Earnings Drives Dividend Growth Annualized Dividends Annual Growth 2021 9.1% Five Year Growth – 2021 is 9.5% $2.00 $1.92 $0.16 $1.76 $1.80 $1.62 $0.14 $0.14 $1.60 $1.48 9.1% $0.18 $1.40 $1.30 8.6% $0.08 $1.22 9.5% $1.20 13.8% $1.00 6.6% $0.80 $0.60 $0.40 $0.20 $- 2016 2017 2018 2019 2020 2021 Our continued dividend growth and earnings retention for investment growth contributes to CPK’s above average shareholder returns. 5Growth in Earnings Drives Dividend Growth Annualized Dividends Annual Growth 2021 9.1% Five Year Growth – 2021 is 9.5% $2.00 $1.92 $0.16 $1.76 $1.80 $1.62 $0.14 $0.14 $1.60 $1.48 9.1% $0.18 $1.40 $1.30 8.6% $0.08 $1.22 9.5% $1.20 13.8% $1.00 6.6% $0.80 $0.60 $0.40 $0.20 $- 2016 2017 2018 2019 2020 2021 Our continued dividend growth and earnings retention for investment growth contributes to CPK’s above average shareholder returns. 5
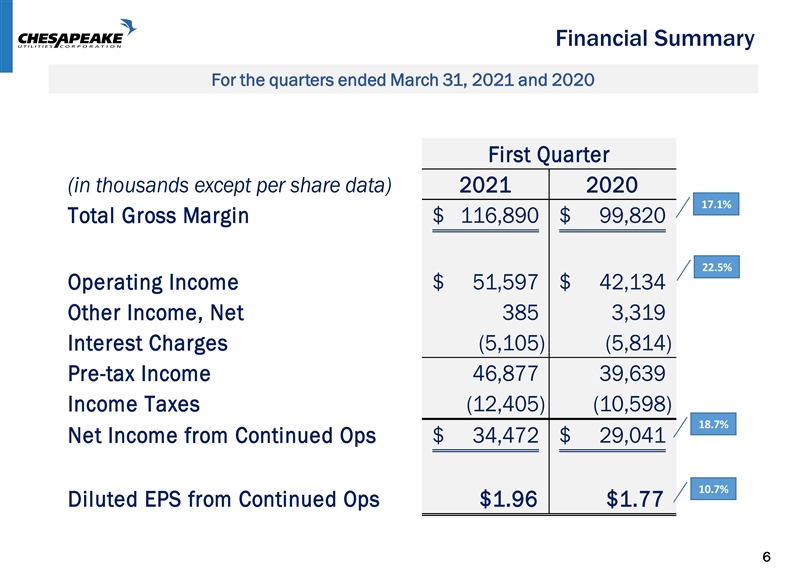
Financial Summary For the quarters ended March 31, 2021 and 2020 First Quarter (in thousands except per share data) 2021 2020 17.1% Total Gross Margin $ 116,890 $ 99,820 22.5% Operating Income $ 51,597 $ 42,134 Other Income, Net 385 3,319 Interest Charges (5,105) (5,814) Pre-tax Income 46,877 39,639 Income Taxes (12,405) (10,598) 18.7% Net Income from Continued Ops $ 34,472 $ 29,041 10.7% Diluted EPS from Continued Ops $1.96 $1.77 6Financial Summary For the quarters ended March 31, 2021 and 2020 First Quarter (in thousands except per share data) 2021 2020 17.1% Total Gross Margin $ 116,890 $ 99,820 22.5% Operating Income $ 51,597 $ 42,134 Other Income, Net 385 3,319 Interest Charges (5,105) (5,814) Pre-tax Income 46,877 39,639 Income Taxes (12,405) (10,598) 18.7% Net Income from Continued Ops $ 34,472 $ 29,041 10.7% Diluted EPS from Continued Ops $1.96 $1.77 6
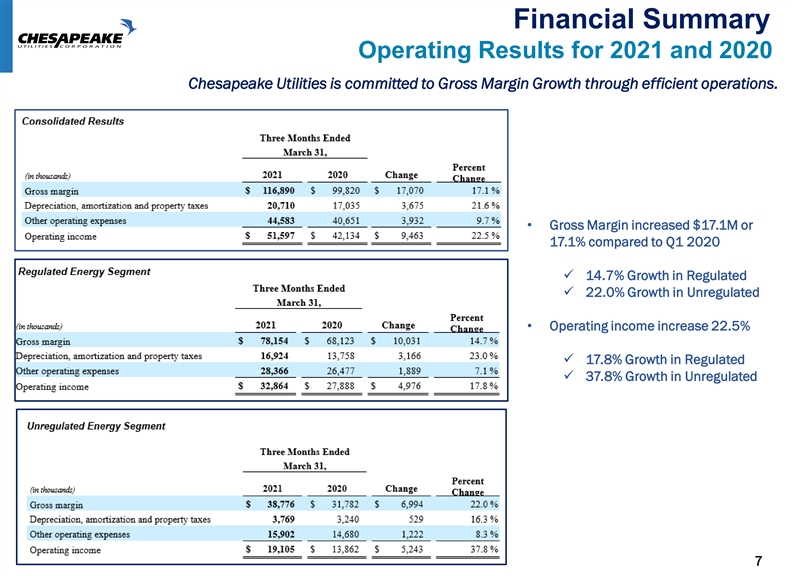
Financial Summary Operating Results for 2021 and 2020 Chesapeake Utilities is committed to Gross Margin Growth through efficient operations. • Gross Margin increased $17.1M or 17.1% compared to Q1 2020 ✓ 14.7% Growth in Regulated ✓ 22.0% Growth in Unregulated • Operating income increase 22.5% ✓ 17.8% Growth in Regulated ✓ 37.8% Growth in Unregulated 7Financial Summary Operating Results for 2021 and 2020 Chesapeake Utilities is committed to Gross Margin Growth through efficient operations. • Gross Margin increased $17.1M or 17.1% compared to Q1 2020 ✓ 14.7% Growth in Regulated ✓ 22.0% Growth in Unregulated • Operating income increase 22.5% ✓ 17.8% Growth in Regulated ✓ 37.8% Growth in Unregulated 7
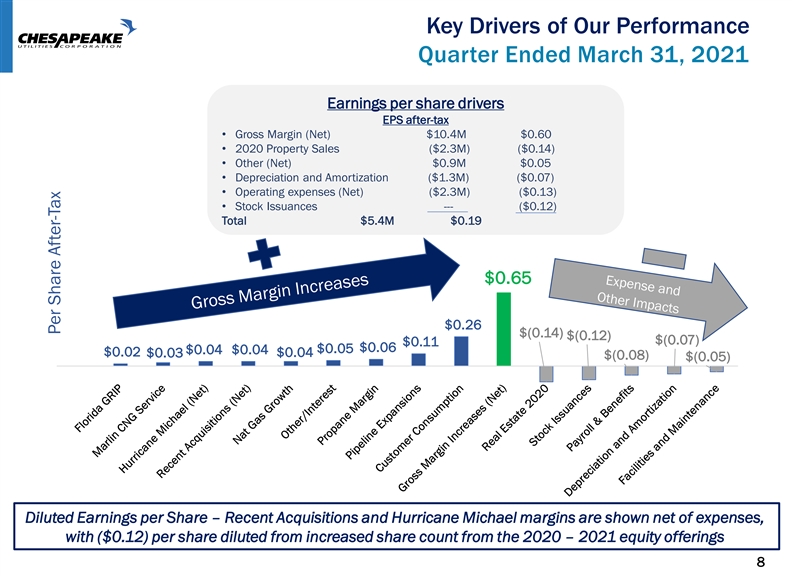
Key Drivers of Our Performance Quarter Ended March 31, 2021 Earnings per share drivers EPS after-tax • Gross Margin (Net) $10.4M $0.60 • 2020 Property Sales ($2.3M) ($0.14) • Other (Net) $0.9M $0.05 • Depreciation and Amortization ($1.3M) ($0.07) • Operating expenses (Net) ($2.3M) ($0.13) • Stock Issuances --- ($0.12) Total $5.4M $0.19 $0.65 $0.26 $(0.14) $(0.12) $(0.07) $0.11 $0.06 $0.05 $0.04 $0.04 $0.02 $0.03 $0.04 $(0.08) $(0.05) Diluted Earnings per Share – Recent Acquisitions and Hurricane Michael margins are shown net of expenses, with ($0.12) per share diluted from increased share count from the 2020 – 2021 equity offerings 8 Per Share After-TaxKey Drivers of Our Performance Quarter Ended March 31, 2021 Earnings per share drivers EPS after-tax • Gross Margin (Net) $10.4M $0.60 • 2020 Property Sales ($2.3M) ($0.14) • Other (Net) $0.9M $0.05 • Depreciation and Amortization ($1.3M) ($0.07) • Operating expenses (Net) ($2.3M) ($0.13) • Stock Issuances --- ($0.12) Total $5.4M $0.19 $0.65 $0.26 $(0.14) $(0.12) $(0.07) $0.11 $0.06 $0.05 $0.04 $0.04 $0.02 $0.03 $0.04 $(0.08) $(0.05) Diluted Earnings per Share – Recent Acquisitions and Hurricane Michael margins are shown net of expenses, with ($0.12) per share diluted from increased share count from the 2020 – 2021 equity offerings 8 Per Share After-Tax
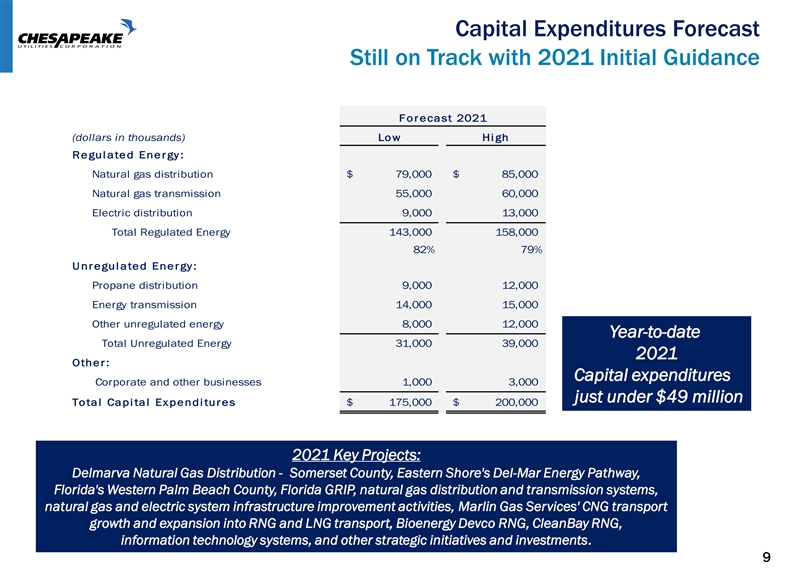
Capital Expenditures Forecast Still on Track with 2021 Initial Guidance F orecast 2021 (dollars in thousands) Low Hi gh Regul ated Energy : Natural gas distribution $ 79,000 $ 85,000 Natural gas transmission 55,000 60,000 Electric distribution 9,000 13,000 Total Regulated Energy 143,000 158,000 82% 79% Unregul ated Energy : Propane distribution 9,000 12,000 Energy transmission 14,000 15,000 Other unregulated energy 8,000 12,000 Year-to-date Total Unregulated Energy 31,000 39,000 2021 Other: Capital expenditures Corporate and other businesses 1,000 3,000 just under $49 million Total Capi tal Expendi tures $ 175,000 $ 200,000 2021 Key Projects: Delmarva Natural Gas Distribution - Somerset County, Eastern Shore's Del-Mar Energy Pathway, Florida's Western Palm Beach County, Florida GRIP, natural gas distribution and transmission systems, natural gas and electric system infrastructure improvement activities, Marlin Gas Services' CNG transport growth and expansion into RNG and LNG transport, Bioenergy Devco RNG, CleanBay RNG, information technology systems, and other strategic initiatives and investments. 9Capital Expenditures Forecast Still on Track with 2021 Initial Guidance F orecast 2021 (dollars in thousands) Low Hi gh Regul ated Energy : Natural gas distribution $ 79,000 $ 85,000 Natural gas transmission 55,000 60,000 Electric distribution 9,000 13,000 Total Regulated Energy 143,000 158,000 82% 79% Unregul ated Energy : Propane distribution 9,000 12,000 Energy transmission 14,000 15,000 Other unregulated energy 8,000 12,000 Year-to-date Total Unregulated Energy 31,000 39,000 2021 Other: Capital expenditures Corporate and other businesses 1,000 3,000 just under $49 million Total Capi tal Expendi tures $ 175,000 $ 200,000 2021 Key Projects: Delmarva Natural Gas Distribution - Somerset County, Eastern Shore's Del-Mar Energy Pathway, Florida's Western Palm Beach County, Florida GRIP, natural gas distribution and transmission systems, natural gas and electric system infrastructure improvement activities, Marlin Gas Services' CNG transport growth and expansion into RNG and LNG transport, Bioenergy Devco RNG, CleanBay RNG, information technology systems, and other strategic initiatives and investments. 9
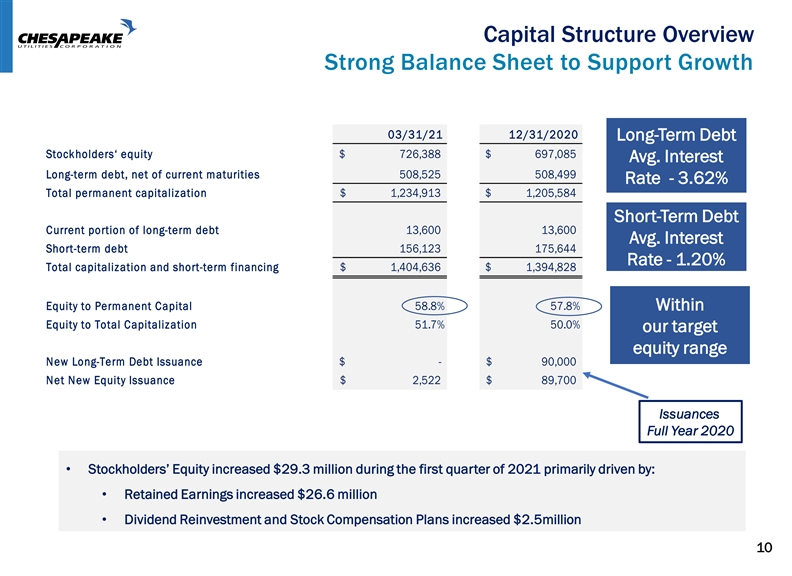
Capital Structure Overview Strong Balance Sheet to Support Growth 03/31/21 12/31/2020 Long-Term Debt Stockholders‘ equity $ 7 26,388 $ 697,085 Avg. Interest Long-term debt, net of current maturities 5 08,525 508,499 Rate - 3.62% Total permanent capitalization $ 1 ,234,913 $ 1 ,205,584 Short-Term Debt Current portion of long-term debt 1 3,600 1 3,600 Avg. Interest Short-term debt 1 56,123 175,644 Rate - 1.20% Total capitalization and short-term financing $ 1,404,636 $ 1 ,394,828 Equity to Permanent Capital 58.8% 57.8% Within Equity to Total Capitalization 51.7% 50.0% our target equity range New Long-Term Debt Issuance $ - $ 90,000 Net New Equity Issuance $ 2 ,522 $ 89,700 Issuances Full Year 2020 • Stockholders’ Equity increased $29.3 million during the first quarter of 2021 primarily driven by: • Retained Earnings increased $26.6 million • Dividend Reinvestment and Stock Compensation Plans increased $2.5million 10Capital Structure Overview Strong Balance Sheet to Support Growth 03/31/21 12/31/2020 Long-Term Debt Stockholders‘ equity $ 7 26,388 $ 697,085 Avg. Interest Long-term debt, net of current maturities 5 08,525 508,499 Rate - 3.62% Total permanent capitalization $ 1 ,234,913 $ 1 ,205,584 Short-Term Debt Current portion of long-term debt 1 3,600 1 3,600 Avg. Interest Short-term debt 1 56,123 175,644 Rate - 1.20% Total capitalization and short-term financing $ 1,404,636 $ 1 ,394,828 Equity to Permanent Capital 58.8% 57.8% Within Equity to Total Capitalization 51.7% 50.0% our target equity range New Long-Term Debt Issuance $ - $ 90,000 Net New Equity Issuance $ 2 ,522 $ 89,700 Issuances Full Year 2020 • Stockholders’ Equity increased $29.3 million during the first quarter of 2021 primarily driven by: • Retained Earnings increased $26.6 million • Dividend Reinvestment and Stock Compensation Plans increased $2.5million 10
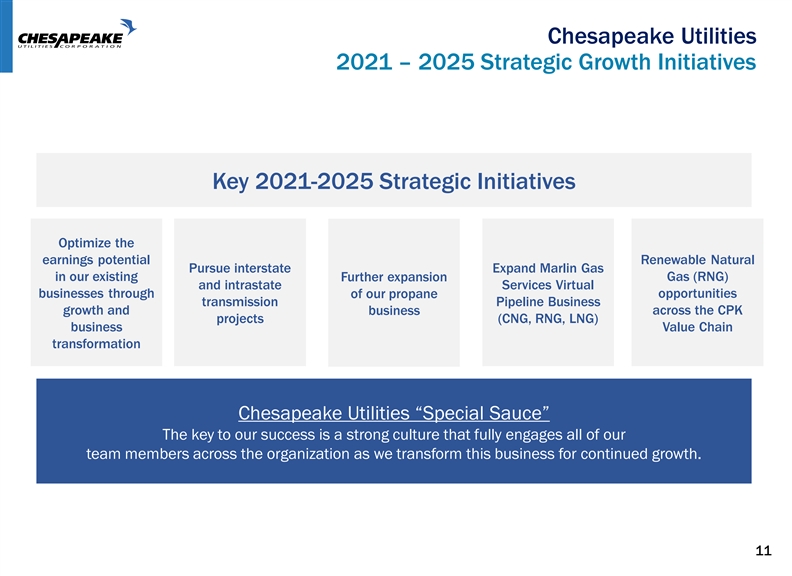
Chesapeake Utilities 2021 – 2025 Strategic Growth Initiatives Key 2021-2025 Strategic Initiatives Optimize the earnings potential Renewable Natural Pursue interstate Expand Marlin Gas in our existing Further expansion Gas (RNG) and intrastate Services Virtual businesses through of our propane opportunities transmission Pipeline Business growth and business across the CPK projects (CNG, RNG, LNG) business Value Chain transformation Chesapeake Utilities “Special Sauce” The key to our success is a strong culture that fully engages all of our team members across the organization as we transform this business for continued growth. 11Chesapeake Utilities 2021 – 2025 Strategic Growth Initiatives Key 2021-2025 Strategic Initiatives Optimize the earnings potential Renewable Natural Pursue interstate Expand Marlin Gas in our existing Further expansion Gas (RNG) and intrastate Services Virtual businesses through of our propane opportunities transmission Pipeline Business growth and business across the CPK projects (CNG, RNG, LNG) business Value Chain transformation Chesapeake Utilities “Special Sauce” The key to our success is a strong culture that fully engages all of our team members across the organization as we transform this business for continued growth. 11
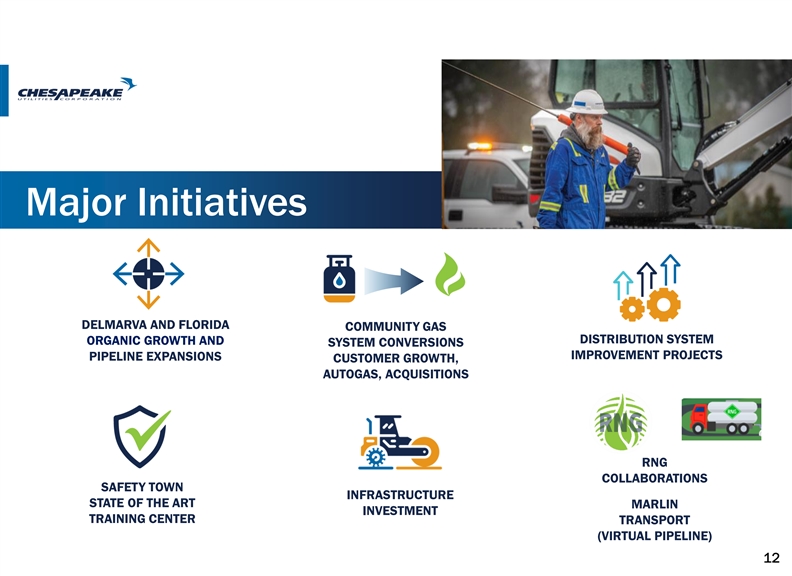
Major Initiatives DELMARVA AND FLORIDA COMMUNITY GAS DISTRIBUTION SYSTEM ORGANIC GROWTH AND SYSTEM CONVERSIONS IMPROVEMENT PROJECTS PIPELINE EXPANSIONS CUSTOMER GROWTH, AUTOGAS, ACQUISITIONS RNG COLLABORATIONS SAFETY TOWN INFRASTRUCTURE STATE OF THE ART MARLIN INVESTMENT TRAINING CENTER TRANSPORT (VIRTUAL PIPELINE) 12Major Initiatives DELMARVA AND FLORIDA COMMUNITY GAS DISTRIBUTION SYSTEM ORGANIC GROWTH AND SYSTEM CONVERSIONS IMPROVEMENT PROJECTS PIPELINE EXPANSIONS CUSTOMER GROWTH, AUTOGAS, ACQUISITIONS RNG COLLABORATIONS SAFETY TOWN INFRASTRUCTURE STATE OF THE ART MARLIN INVESTMENT TRAINING CENTER TRANSPORT (VIRTUAL PIPELINE) 12
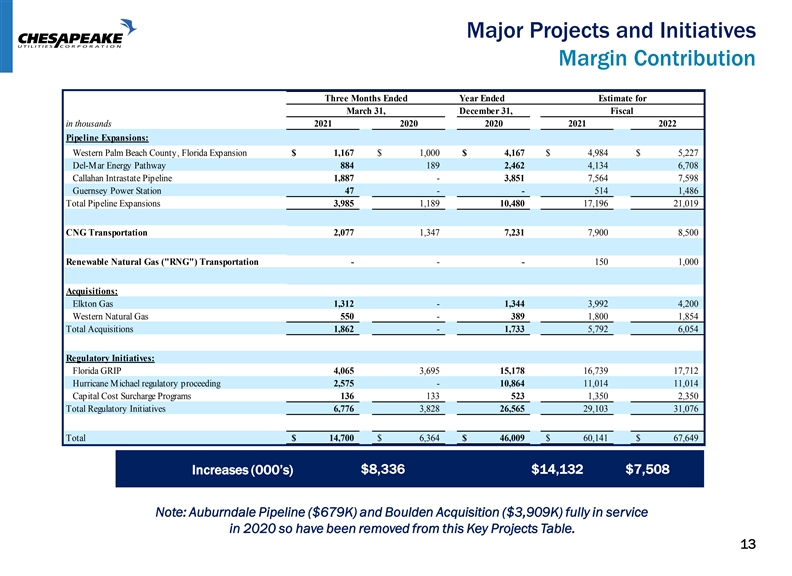
Major Projects and Initiatives Margin Contribution Three Months Ended Year Ended Estimate for March 31, December 31, Fiscal in thousands 2021 2020 2020 2021 2022 Pipeline Expansions: Western Palm Beach County, Florida Expansion $ 1,167 $ 1,000 $ 4,167 $ 4,984 $ 5,227 Del-Mar Energy Pathway 884 189 2,462 4,134 6,708 Callahan Intrastate Pipeline 1,887 - 3,851 7,564 7,598 Guernsey Power Station 47 - - 514 1,486 Total Pipeline Expansions 3,985 1,189 10,480 17,196 21,019 CNG Transportation 2,077 1,347 7,231 7,900 8,500 Renewable Natural Gas ( RNG ) Transportation - - - 150 1,000 Acquisitions: Elkton Gas 1,312 - 1,344 3,992 4,200 Western Natural Gas 550 - 389 1,800 1,854 Total Acquisitions 1,862 - 1,733 5,792 6,054 Regulatory Initiatives: Florida GRIP 4,065 3,695 15,178 16,739 17,712 Hurricane Michael regulatory proceeding 2,575 - 10,864 11,014 11,014 Capital Cost Surcharge Programs 136 133 523 1,350 2,350 Total Regulatory Initiatives 6,776 3,828 26,565 29,103 31,076 Total $ 14,700 $ 6,364 $ 46,009 $ 60,141 $ 67,649 Increases (000’s) $8,336 $14,132 $7,508 Note: Auburndale Pipeline ($679K) and Boulden Acquisition ($3,909K) fully in service in 2020 so have been removed from this Key Projects Table. 13Major Projects and Initiatives Margin Contribution Three Months Ended Year Ended Estimate for March 31, December 31, Fiscal in thousands 2021 2020 2020 2021 2022 Pipeline Expansions: Western Palm Beach County, Florida Expansion $ 1,167 $ 1,000 $ 4,167 $ 4,984 $ 5,227 Del-Mar Energy Pathway 884 189 2,462 4,134 6,708 Callahan Intrastate Pipeline 1,887 - 3,851 7,564 7,598 Guernsey Power Station 47 - - 514 1,486 Total Pipeline Expansions 3,985 1,189 10,480 17,196 21,019 CNG Transportation 2,077 1,347 7,231 7,900 8,500 Renewable Natural Gas ( RNG ) Transportation - - - 150 1,000 Acquisitions: Elkton Gas 1,312 - 1,344 3,992 4,200 Western Natural Gas 550 - 389 1,800 1,854 Total Acquisitions 1,862 - 1,733 5,792 6,054 Regulatory Initiatives: Florida GRIP 4,065 3,695 15,178 16,739 17,712 Hurricane Michael regulatory proceeding 2,575 - 10,864 11,014 11,014 Capital Cost Surcharge Programs 136 133 523 1,350 2,350 Total Regulatory Initiatives 6,776 3,828 26,565 29,103 31,076 Total $ 14,700 $ 6,364 $ 46,009 $ 60,141 $ 67,649 Increases (000’s) $8,336 $14,132 $7,508 Note: Auburndale Pipeline ($679K) and Boulden Acquisition ($3,909K) fully in service in 2020 so have been removed from this Key Projects Table. 13
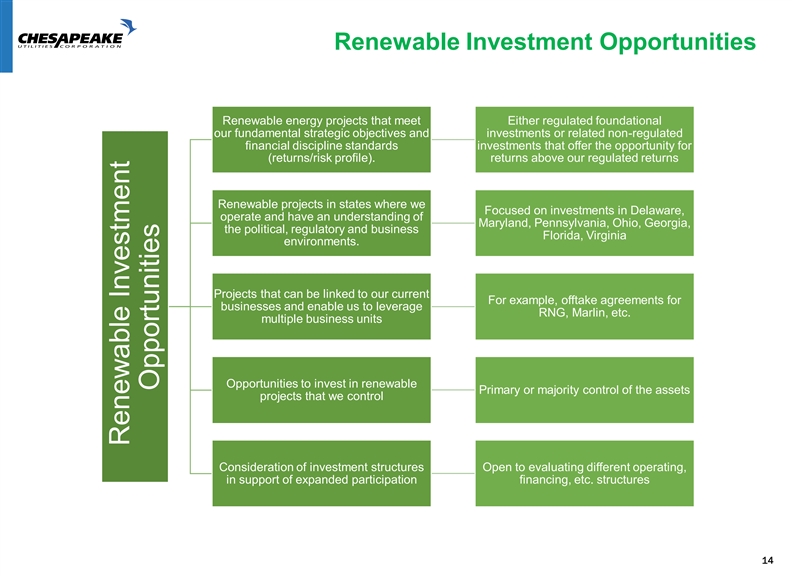
Renewable Investment Opportunities Renewable energy projects that meet Either regulated foundational our fundamental strategic objectives and investments or related non-regulated financial discipline standards investments that offer the opportunity for (returns/risk profile). returns above our regulated returns Renewable projects in states where we Focused on investments in Delaware, operate and have an understanding of Maryland, Pennsylvania, Ohio, Georgia, the political, regulatory and business Florida, Virginia environments. Projects that can be linked to our current For example, offtake agreements for businesses and enable us to leverage RNG, Marlin, etc. multiple business units Opportunities to invest in renewable Primary or majority control of the assets projects that we control Consideration of investment structures Open to evaluating different operating, in support of expanded participation financing, etc. structures 14 Renewable Investment OpportunitiesRenewable Investment Opportunities Renewable energy projects that meet Either regulated foundational our fundamental strategic objectives and investments or related non-regulated financial discipline standards investments that offer the opportunity for (returns/risk profile). returns above our regulated returns Renewable projects in states where we Focused on investments in Delaware, operate and have an understanding of Maryland, Pennsylvania, Ohio, Georgia, the political, regulatory and business Florida, Virginia environments. Projects that can be linked to our current For example, offtake agreements for businesses and enable us to leverage RNG, Marlin, etc. multiple business units Opportunities to invest in renewable Primary or majority control of the assets projects that we control Consideration of investment structures Open to evaluating different operating, in support of expanded participation financing, etc. structures 14 Renewable Investment Opportunities
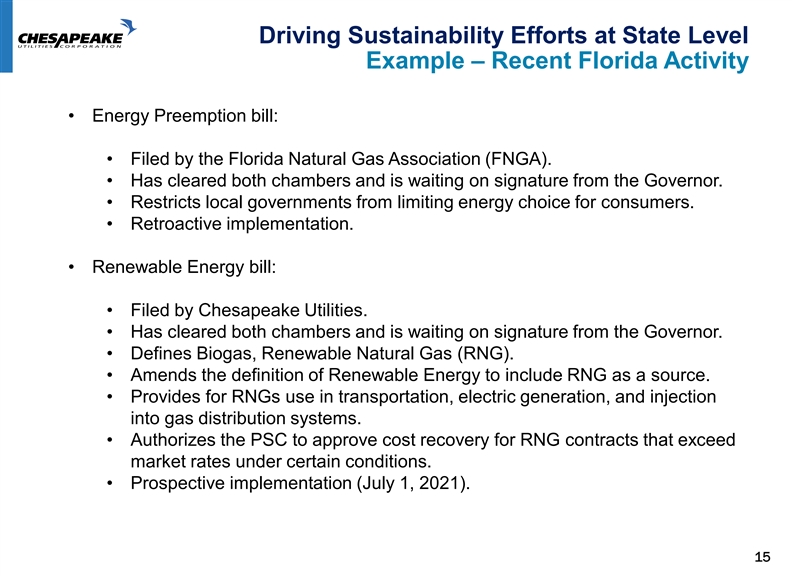
Driving Sustainability Efforts at State Level Example – Recent Florida Activity • Energy Preemption bill: • Filed by the Florida Natural Gas Association (FNGA). • Has cleared both chambers and is waiting on signature from the Governor. • Restricts local governments from limiting energy choice for consumers. • Retroactive implementation. • Renewable Energy bill: • Filed by Chesapeake Utilities. • Has cleared both chambers and is waiting on signature from the Governor. • Defines Biogas, Renewable Natural Gas (RNG). • Amends the definition of Renewable Energy to include RNG as a source. • Provides for RNGs use in transportation, electric generation, and injection into gas distribution systems. • Authorizes the PSC to approve cost recovery for RNG contracts that exceed market rates under certain conditions. • Prospective implementation (July 1, 2021). 15Driving Sustainability Efforts at State Level Example – Recent Florida Activity • Energy Preemption bill: • Filed by the Florida Natural Gas Association (FNGA). • Has cleared both chambers and is waiting on signature from the Governor. • Restricts local governments from limiting energy choice for consumers. • Retroactive implementation. • Renewable Energy bill: • Filed by Chesapeake Utilities. • Has cleared both chambers and is waiting on signature from the Governor. • Defines Biogas, Renewable Natural Gas (RNG). • Amends the definition of Renewable Energy to include RNG as a source. • Provides for RNGs use in transportation, electric generation, and injection into gas distribution systems. • Authorizes the PSC to approve cost recovery for RNG contracts that exceed market rates under certain conditions. • Prospective implementation (July 1, 2021). 15
ESG Stewardship • We take seriously our responsibility to be a good, trusted and ethical corporate citizen, and doing all we can to contribute, through investment, charitable contributions and volunteerism, to greater sustainability, environmental benefits and societal advancement. • For more than 160 years, we have delivered affordable and sustainable energy solutions that respond timely to the evolving needs of our customers and the communities we serve. • We take positive and informed steps to continue our tradition of reducing our direct methane emissions, while at the same time helping our customers and communities to reduce their emissions. • We are committed to ensuring that safety, equity, diversity and inclusion are at the center of our culture. • Each and every day, we proudly deliver essential, safe, reliable, affordable, sustainable and efficient energy solutions to our customers in Florida, Ohio and across the Delmarva Peninsula. • We are committed to sustainable growth with financial discipline that generates long-term value for our stakeholders. • Our success rests on the strength and dedication of our team, our diverse, inclusive and collaborative culture, and our award winning corporate governance practices, all of which contribute to our strong financial performance. 16ESG Stewardship • We take seriously our responsibility to be a good, trusted and ethical corporate citizen, and doing all we can to contribute, through investment, charitable contributions and volunteerism, to greater sustainability, environmental benefits and societal advancement. • For more than 160 years, we have delivered affordable and sustainable energy solutions that respond timely to the evolving needs of our customers and the communities we serve. • We take positive and informed steps to continue our tradition of reducing our direct methane emissions, while at the same time helping our customers and communities to reduce their emissions. • We are committed to ensuring that safety, equity, diversity and inclusion are at the center of our culture. • Each and every day, we proudly deliver essential, safe, reliable, affordable, sustainable and efficient energy solutions to our customers in Florida, Ohio and across the Delmarva Peninsula. • We are committed to sustainable growth with financial discipline that generates long-term value for our stakeholders. • Our success rests on the strength and dedication of our team, our diverse, inclusive and collaborative culture, and our award winning corporate governance practices, all of which contribute to our strong financial performance. 16
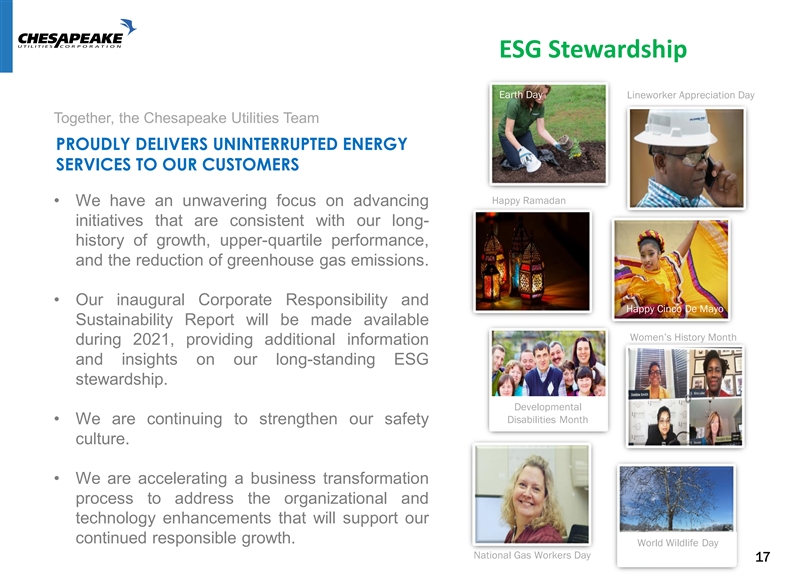
ESG Stewardship Earth Day Lineworker Appreciation Day Together, the Chesapeake Utilities Team PROUDLY DELIVERS UNINTERRUPTED ENERGY SERVICES TO OUR CUSTOMERS Happy Ramadan • We have an unwavering focus on advancing initiatives that are consistent with our long- history of growth, upper-quartile performance, and the reduction of greenhouse gas emissions. • Our inaugural Corporate Responsibility and Happy Cinco De Mayo Sustainability Report will be made available Women’s History Month during 2021, providing additional information and insights on our long-standing ESG stewardship. Developmental Disabilities Month • We are continuing to strengthen our safety culture. • We are accelerating a business transformation process to address the organizational and technology enhancements that will support our continued responsible growth. World Wildlife Day National Gas Workers Day 17ESG Stewardship Earth Day Lineworker Appreciation Day Together, the Chesapeake Utilities Team PROUDLY DELIVERS UNINTERRUPTED ENERGY SERVICES TO OUR CUSTOMERS Happy Ramadan • We have an unwavering focus on advancing initiatives that are consistent with our long- history of growth, upper-quartile performance, and the reduction of greenhouse gas emissions. • Our inaugural Corporate Responsibility and Happy Cinco De Mayo Sustainability Report will be made available Women’s History Month during 2021, providing additional information and insights on our long-standing ESG stewardship. Developmental Disabilities Month • We are continuing to strengthen our safety culture. • We are accelerating a business transformation process to address the organizational and technology enhancements that will support our continued responsible growth. World Wildlife Day National Gas Workers Day 17
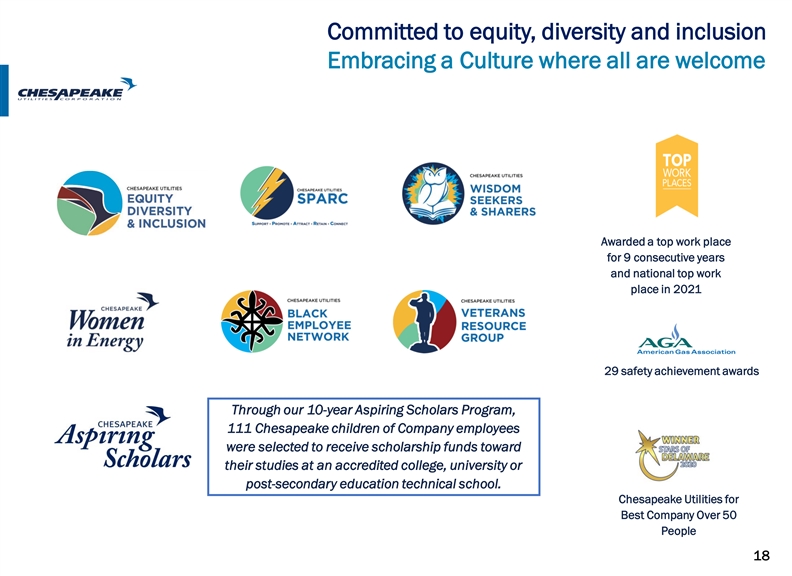
Committed to equity, diversity and inclusion Embracing a Culture where all are welcome Corporate Culture Awarded a top work place for 9 consecutive years and national top work place in 2021 29 safety achievement awards Through our 10-year Aspiring Scholars Program, 111 Chesapeake children of Company employees were selected to receive scholarship funds toward their studies at an accredited college, university or post-secondary education technical school. Chesapeake Utilities for Best Company Over 50 People 18Committed to equity, diversity and inclusion Embracing a Culture where all are welcome Corporate Culture Awarded a top work place for 9 consecutive years and national top work place in 2021 29 safety achievement awards Through our 10-year Aspiring Scholars Program, 111 Chesapeake children of Company employees were selected to receive scholarship funds toward their studies at an accredited college, university or post-secondary education technical school. Chesapeake Utilities for Best Company Over 50 People 18
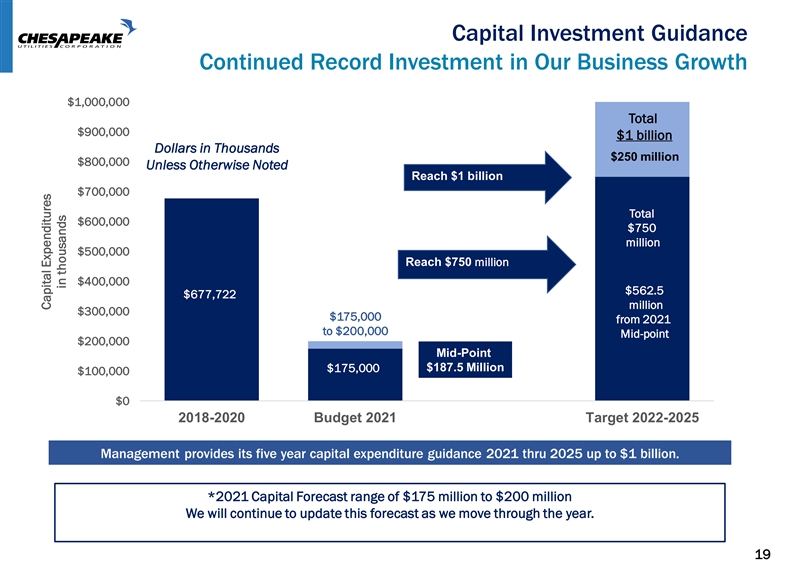
Capital Investment Guidance Continued Record Investment in Our Business Growth $1,000,000 Total $900,000 $1 billion Dollars in Thousands $250 million $800,000 Unless Otherwise Noted Reach $1 billion $700,000 Total $600,000 $750 million $500,000 Reach $750 million $400,000 $562.5 $677,722 million $300,000 $175,000 from 2021 to $200,000 Mid-point $200,000 Mid-Point $187.5 Million $175,000 $100,000 $0 2018-2020 Budget 2021 Target 2022-2025 Management provides its five year capital expenditure guidance 2021 thru 2025 up to $1 billion. *2021 Capital Forecast range of $175 million to $200 million We will continue to update this forecast as we move through the year. 19 Capital Expenditures in thousandsCapital Investment Guidance Continued Record Investment in Our Business Growth $1,000,000 Total $900,000 $1 billion Dollars in Thousands $250 million $800,000 Unless Otherwise Noted Reach $1 billion $700,000 Total $600,000 $750 million $500,000 Reach $750 million $400,000 $562.5 $677,722 million $300,000 $175,000 from 2021 to $200,000 Mid-point $200,000 Mid-Point $187.5 Million $175,000 $100,000 $0 2018-2020 Budget 2021 Target 2022-2025 Management provides its five year capital expenditure guidance 2021 thru 2025 up to $1 billion. *2021 Capital Forecast range of $175 million to $200 million We will continue to update this forecast as we move through the year. 19 Capital Expenditures in thousands
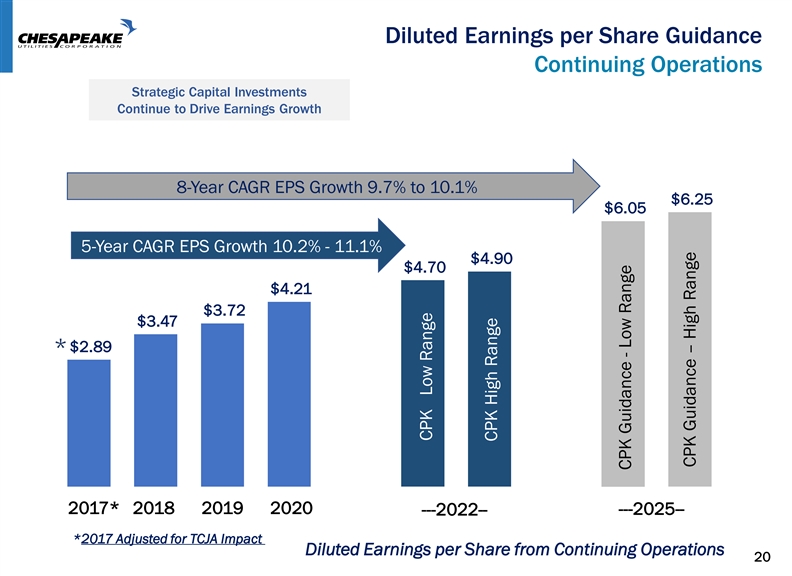
Diluted Earnings per Share Guidance Continuing Operations Strategic Capital Investments Continue to Drive Earnings Growth 8-Year CAGR EPS Growth 9.7% to 10.1% $6.25 $6.05 5-Year CAGR EPS Growth 10.2% - 11.1% $4.90 $4.70 $4.21 $3.72 $3.47 $2.89 * 2017* 2018 2019 2020 ---2022-- ---2025-- *2017 Adjusted for TCJA Impact Diluted Earnings per Share from Continuing Operations 20 CPK Low Range Previous CPK Low Range CPK High Range Previous CPK High Range CPK Guidance - Low Range CPK Guidance – Low Range CPK Guidance – High Range CPK Guidance – High RangeDiluted Earnings per Share Guidance Continuing Operations Strategic Capital Investments Continue to Drive Earnings Growth 8-Year CAGR EPS Growth 9.7% to 10.1% $6.25 $6.05 5-Year CAGR EPS Growth 10.2% - 11.1% $4.90 $4.70 $4.21 $3.72 $3.47 $2.89 * 2017* 2018 2019 2020 ---2022-- ---2025-- *2017 Adjusted for TCJA Impact Diluted Earnings per Share from Continuing Operations 20 CPK Low Range Previous CPK Low Range CPK High Range Previous CPK High Range CPK Guidance - Low Range CPK Guidance – Low Range CPK Guidance – High Range CPK Guidance – High Range
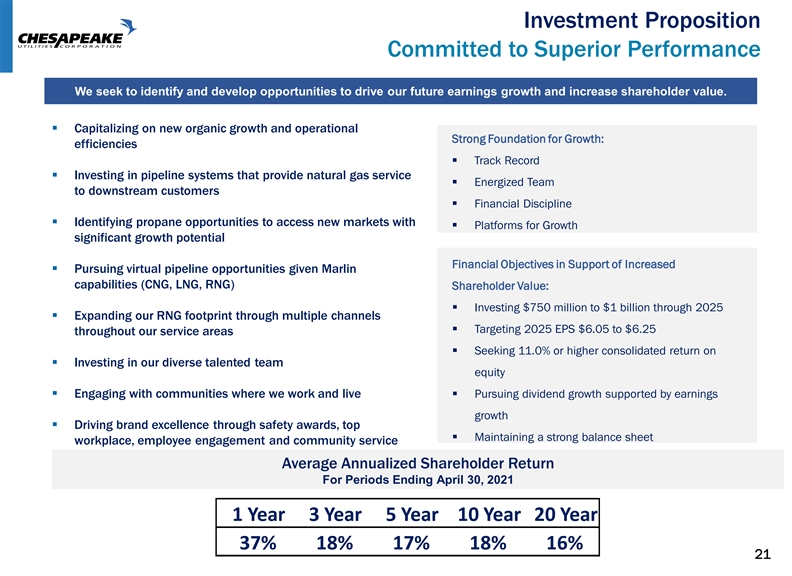
Investment Proposition Committed to Superior Performance We seek to identify and develop opportunities to drive our future earnings growth and increase shareholder value. ▪ Capitalizing on new organic growth and operational Strong Foundation for Growth: efficiencies ▪ Track Record ▪ Investing in pipeline systems that provide natural gas service ▪ Energized Team to downstream customers ▪ Financial Discipline ▪ Identifying propane opportunities to access new markets with ▪ Platforms for Growth significant growth potential Financial Objectives in Support of Increased ▪ Pursuing virtual pipeline opportunities given Marlin capabilities (CNG, LNG, RNG) Shareholder Value: ▪ Investing $750 million to $1 billion through 2025 ▪ Expanding our RNG footprint through multiple channels ▪ Targeting 2025 EPS $6.05 to $6.25 throughout our service areas ▪ Seeking 11.0% or higher consolidated return on ▪ Investing in our diverse talented team equity ▪ Engaging with communities where we work and live▪ Pursuing dividend growth supported by earnings growth ▪ Driving brand excellence through safety awards, top ▪ Maintaining a strong balance sheet workplace, employee engagement and community service Average Annualized Shareholder Return For Periods Ending April 30, 2021 1 Year 3 Year 5 Year 10 Year 20 Year 37% 18% 17% 18% 16% 21Investment Proposition Committed to Superior Performance We seek to identify and develop opportunities to drive our future earnings growth and increase shareholder value. ▪ Capitalizing on new organic growth and operational Strong Foundation for Growth: efficiencies ▪ Track Record ▪ Investing in pipeline systems that provide natural gas service ▪ Energized Team to downstream customers ▪ Financial Discipline ▪ Identifying propane opportunities to access new markets with ▪ Platforms for Growth significant growth potential Financial Objectives in Support of Increased ▪ Pursuing virtual pipeline opportunities given Marlin capabilities (CNG, LNG, RNG) Shareholder Value: ▪ Investing $750 million to $1 billion through 2025 ▪ Expanding our RNG footprint through multiple channels ▪ Targeting 2025 EPS $6.05 to $6.25 throughout our service areas ▪ Seeking 11.0% or higher consolidated return on ▪ Investing in our diverse talented team equity ▪ Engaging with communities where we work and live▪ Pursuing dividend growth supported by earnings growth ▪ Driving brand excellence through safety awards, top ▪ Maintaining a strong balance sheet workplace, employee engagement and community service Average Annualized Shareholder Return For Periods Ending April 30, 2021 1 Year 3 Year 5 Year 10 Year 20 Year 37% 18% 17% 18% 16% 21
Thank You Thank You