Attached files
| file | filename |
|---|---|
| EX-99.1 - EX-99.1 - CENTERPOINT ENERGY INC | d242724dex991.htm |
| 8-K - 8-K - CENTERPOINT ENERGY INC | d242724d8k.htm |
FIRST QUARTER 2021 INVESTOR UPDATE May 6, 2021 Exhibit 99.2
Cautionary Statement and Other Disclaimers This presentation and the oral statements made in connection herewith contain “forward-looking statements” within the meaning of Section 27A of the Securities Act of 1933 and Section 21E of the Securities Exchange Act of 1934. All statements other than statements of historical fact included in this presentation and the oral statements made in connection herewith are forward-looking statements made in good faith by CenterPoint Energy, Inc. (“CenterPoint Energy” or the “Company”) and are intended to qualify for the safe harbor from liability established by the Private Securities Litigation Reform Act of 1995, including statements concerning CenterPoint Energy’s expectations, beliefs, plans, objectives, goals, strategies, future operations, events, financial position, earnings and guidance, growth, impact of COVID-19, costs, prospects, capital investments or performance or underlying assumptions and other statements that are not historical facts. You should not place undue reliance on forward-looking statements. You can generally identify our forward-looking statements by the words “anticipate,” “believe,” “continue,” “could,” “estimate,” “expect,” “forecast,” “goal,” “intend,” “may,” “objective,” “plan,” “potential,” “predict,” “projection,” “should,” “target,” “will,” or other similar words. The absence of these words, however, does not mean that the statements are not forward-looking. Examples of forward-looking statements in this presentation include statements about our growth and guidance (including earnings and customer growth, capital investment and related opportunities, utility and rate base growth expectations, taking into account assumptions and scenarios related to COVID-19), the impacts of COVID-19 on our business, the impacts of the February 2021 winter storm event on our business and service territories, O&M expense management initiatives and projected savings therefrom, the performance of Enable Midstream Partners, LP (“Enable”), including anticipated distributions received on its common units, the announced merger of Enable and Energy Transfer LP (“Energy Transfer”) and minimizing our exposure to midstream, our regulatory filings and projections (including timing and amount of recovery of natural gas costs associated with the February 2021 winter storm event), our credit quality, financing plan and balance sheet expectations, the announced sale of our Natural Gas businesses in Arkansas and Oklahoma, environmental, social and governance related matters, including our carbon emissions reduction targets. We have based our forward-looking statements on our management’s beliefs and assumptions based on information currently available to our management at the time the statements are made. We caution you that assumptions, beliefs, expectations, intentions, and projections about future events may and often do vary materially from actual results. Therefore, we cannot assure you that actual results will not differ materially from those expressed or implied by our forward-looking statements. Some of the factors that could cause actual results to differ from those expressed or implied by our forward-looking statements include, but are not limited to, risks and uncertainties relating to: (1) the performance of Enable, the amount of cash distributions CenterPoint Energy receives from Enable, and the value of CenterPoint Energy’s interest in Enable; (2) the integration of the businesses acquired in the merger with Vectren Corporation (Vectren), including the integration of technology systems, and the ability to realize additional benefits and commercial opportunities from the merger; (3) financial market and general economic conditions, including access to debt and equity capital and the effect on sales, prices and costs; (4) industrial, commercial and residential growth in CenterPoint Energy’s service territories and changes in market demand; (5) actions by credit rating agencies, including any potential downgrades to credit ratings; (6) the timing and impact of regulatory proceedings and actions and legal proceedings, including those related to the February 2021 winter storm event; (7) legislative decisions, including tax and developments related to the environment such as global climate change, air emissions, carbon, waste water discharges and the handling of coal combustion residuals, among others, and CenterPoint Energy’s carbon reduction targets; (8) the impact of the COVID-19 pandemic; (9) the recording of impairment charges, including any impairments related to CenterPoint Energy’s investment in Enable; (10) weather variations and CenterPoint Energy’s ability to mitigate weather impacts, including impacts from the February 2021 winter storm event; (11) changes in business plans; (12) CenterPoint Energy's ability to fund and invest planned capital, and timely and appropriate rate actions that allow recovery of costs and a reasonable return on investment, including costs associated with the February 2021 winter storm event; (13) CenterPoint Energy’s or Enable’s potential business strategies and strategic initiatives, restructurings, joint ventures and acquisitions or dispositions of assets or businesses, including the announced sale of our Natural Gas businesses in Arkansas and Oklahoma, which may not be completed or result in the benefits anticipated by CenterPoint Energy, and the proposed merger between Enable and Energy Transfer, which may not be completed or result in the benefits anticipated by CenterPoint Energy or Enable; (14) CenterPoint Energy’s ability to execute operations and maintenance management initiatives; and (15) other factors described CenterPoint Energy’s Form 10-Q for the period ended March 31, 2021 and Form 10-K for the year ended December 31, 2020, including under “Risk Factors,” “Cautionary Statements Regarding Forward-Looking Information” and “Management’s Discussion and Analysis of Financial Condition and Results of Operations—Certain Factors Affecting Future Earnings” in such reports and in other filings with the Securities and Exchange Commission’s (“SEC”) by the Company, which can be found at www.centerpointenergy.com on the Investor Relations page or on the SEC website at www.sec.gov. This presentation contains time sensitive information that is accurate as of the date hereof (unless otherwise specified as accurate as of another date). Some of the information in this presentation is unaudited and may be subject to change. We undertake no obligation to update the information presented herein except as required by law. Investors and others should note that we may announce material information using SEC filings, press releases, public conference calls, webcasts and the Investor Relations page of our website. In the future, we will continue to use these channels to distribute material information about the Company and to communicate important information about the Company, key personnel, corporate initiatives, regulatory updates and other matters. Information that we post on our website could be deemed material; therefore, we encourage investors, the media, our customers, business partners and others interested in our Company to review the information we post on our website. Use of Non-GAAP Financial Measures In addition to presenting its financial results in accordance with generally accepted accounting principles (GAAP), including presentation of income (loss) available to common shareholders and diluted earnings (loss) per share, the Company also provides guidance based on non-GAAP income and non-GAAP diluted earnings per share. Generally, a non-GAAP financial measure is a numerical measure of a company’s historical or future financial performance that excludes or includes amounts that are not normally excluded or included in the most directly comparable GAAP financial measure. Please refer to the Appendix for detailed discussion of the use of non-GAAP financial measures presented herein Additional Information Please refer to the Appendix for further information under the headings “Important Information for Investors and Unitholders” and “Participants in the Solicitation.”
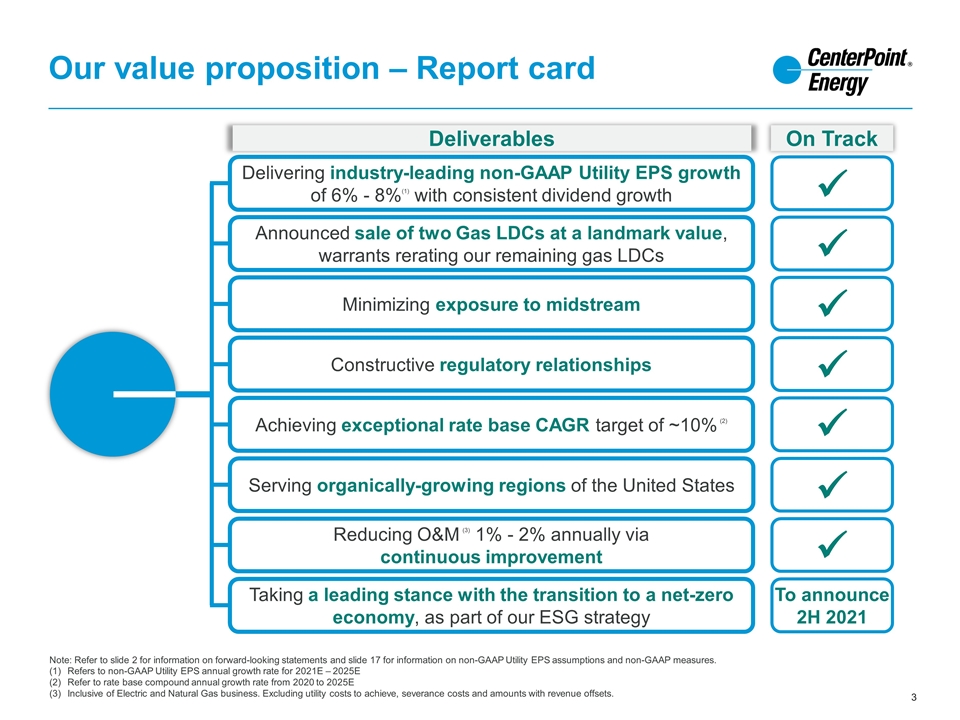
Our value proposition – Report card Note: Refer to slide 2 for information on forward-looking statements and slide 17 for information on non-GAAP Utility EPS assumptions and non-GAAP measures. Refers to non-GAAP Utility EPS annual growth rate for 2021E – 2025E Refer to rate base compound annual growth rate from 2020 to 2025E Inclusive of Electric and Natural Gas business. Excluding utility costs to achieve, severance costs and amounts with revenue offsets. Delivering industry-leading non-GAAP Utility EPS growth of 6% - 8%(1) with consistent dividend growth Announced sale of two Gas LDCs at a landmark value, warrants rerating our remaining gas LDCs Minimizing exposure to midstream Achieving exceptional rate base CAGR target of ~10% (2) Taking a leading stance with the transition to a net-zero economy, as part of our ESG strategy Reducing O&M (3) 1% - 2% annually via continuous improvement Serving organically-growing regions of the United States Constructive regulatory relationships On Track Deliverables To announce 2H 2021 ü ü ü ü ü ü ü
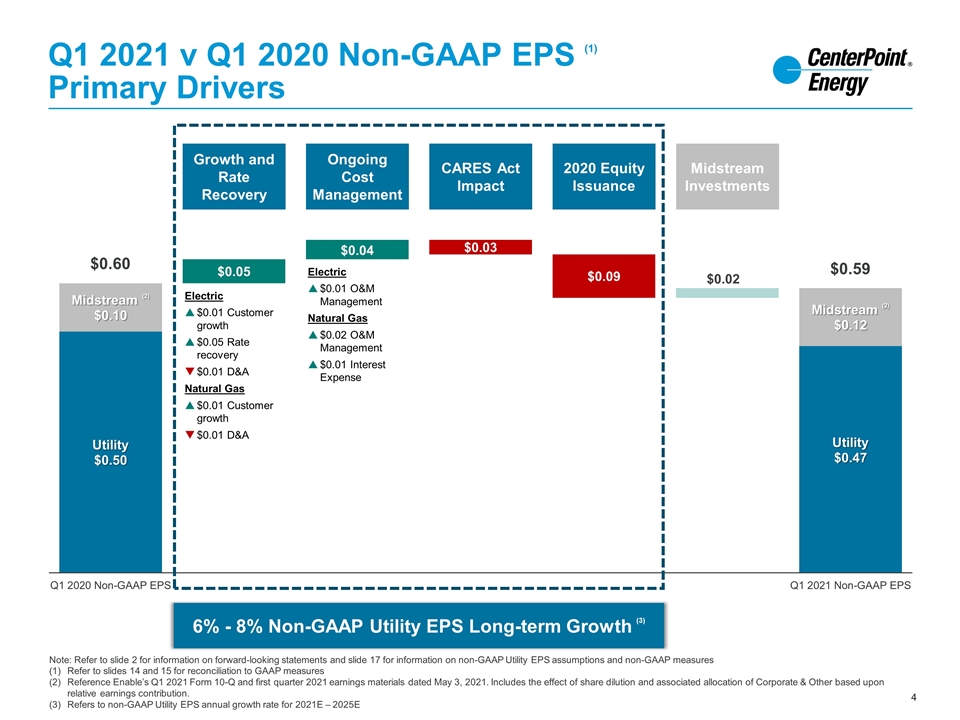
Q1 2021 v Q1 2020 Non-GAAP EPS (1) Primary Drivers Note: Refer to slide 2 for information on forward-looking statements and slide 17 for information on non-GAAP Utility EPS assumptions and non-GAAP measures Refer to slides 14 and 15 for reconciliation to GAAP measures Reference Enable’s Q1 2021 Form 10-Q and first quarter 2021 earnings materials dated May 3, 2021. Includes the effect of share dilution and associated allocation of Corporate & Other based upon relative earnings contribution. Refers to non-GAAP Utility EPS annual growth rate for 2021E – 2025E $0.60 $0.59 Growth and Rate Recovery Ongoing Cost Management CARES Act Impact 2020 Equity Issuance Midstream Investments 6% - 8% Non-GAAP Utility EPS Long-term Growth (3) Electric $0.01 Customer growth $0.05 Rate recovery $0.01 D&A Natural Gas $0.01 Customer growth $0.01 D&A Electric $0.01 O&M Management Natural Gas $0.02 O&M Management $0.01 Interest Expense
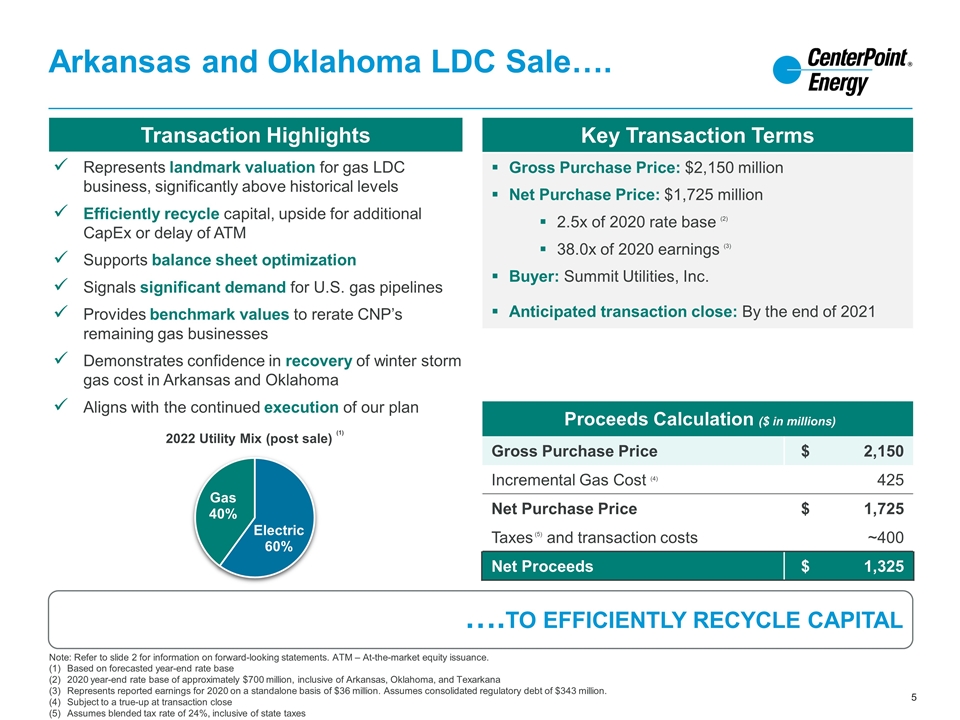
….TO EFFICIENTLY RECYCLE CAPITAL Note: Refer to slide 2 for information on forward-looking statements. ATM – At-the-market equity issuance. Based on forecasted year-end rate base 2020 year-end rate base of approximately $700 million, inclusive of Arkansas, Oklahoma, and Texarkana Represents reported earnings for 2020 on a standalone basis of $36 million. Assumes consolidated regulatory debt of $343 million. Subject to a true-up at transaction close Assumes blended tax rate of 24%, inclusive of state taxes Transaction Highlights Represents landmark valuation for gas LDC business, significantly above historical levels Efficiently recycle capital, upside for additional CapEx or delay of ATM Supports balance sheet optimization Signals significant demand for U.S. gas pipelines Provides benchmark values to rerate CNP’s remaining gas businesses Demonstrates confidence in recovery of winter storm gas cost in Arkansas and Oklahoma Aligns with the continued execution of our plan Key Transaction Terms Gross Purchase Price: $2,150 million Net Purchase Price: $1,725 million 2.5x of 2020 rate base (2) 38.0x of 2020 earnings (3) Buyer: Summit Utilities, Inc. Anticipated transaction close: By the end of 2021 Arkansas and Oklahoma LDC Sale…. Proceeds Calculation ($ in millions) Gross Purchase Price $ 2,150 Incremental Gas Cost (4) 425 Net Purchase Price $ 1,725 Taxes (5) and transaction costs ~400 Net Proceeds $ 1,325
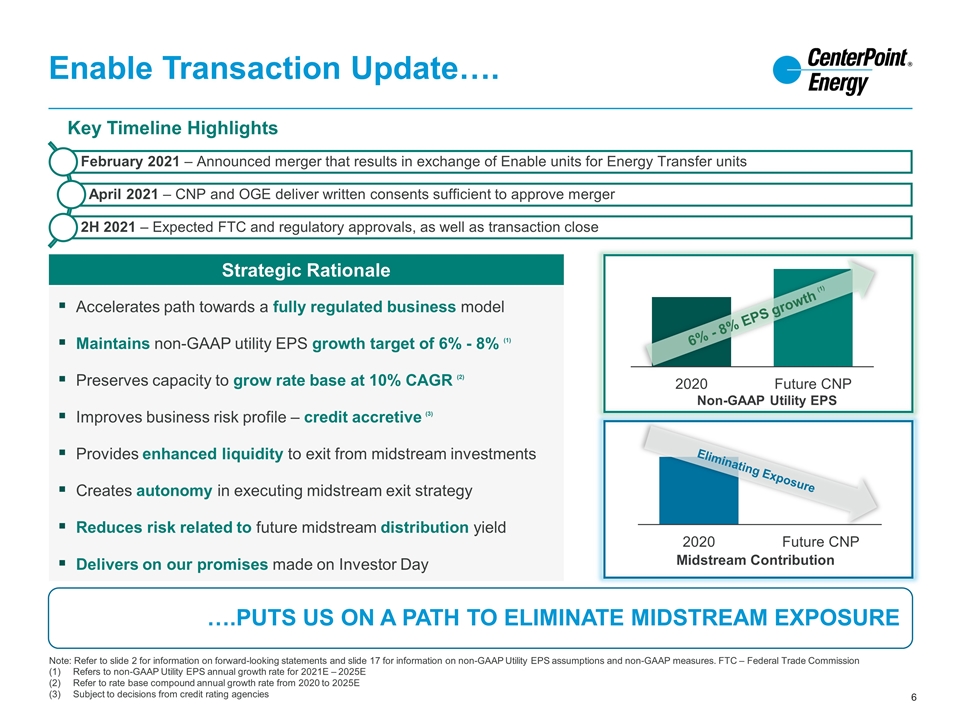
Enable Transaction Update…. ….PUTS US ON A PATH TO ELIMINATE MIDSTREAM EXPOSURE Note: Refer to slide 2 for information on forward-looking statements and slide 17 for information on non-GAAP Utility EPS assumptions and non-GAAP measures. FTC – Federal Trade Commission Refers to non-GAAP Utility EPS annual growth rate for 2021E – 2025E Refer to rate base compound annual growth rate from 2020 to 2025E Subject to decisions from credit rating agencies Key Timeline Highlights Midstream Contribution Eliminating Exposure Non-GAAP Utility EPS 6% - 8% EPS growth (1) Strategic Rationale Accelerates path towards a fully regulated business model Maintains non-GAAP utility EPS growth target of 6% - 8% (1) Preserves capacity to grow rate base at 10% CAGR (2) Improves business risk profile – credit accretive (3) Provides enhanced liquidity to exit from midstream investments Creates autonomy in executing midstream exit strategy Reduces risk related to future midstream distribution yield Delivers on our promises made on Investor Day February 2021 – Announced merger that results in exchange of Enable units for Energy Transfer units April 2021 – CNP and OGE deliver written consents sufficient to approve merger 2H 2021 – Expected FTC and regulatory approvals, as well as transaction close
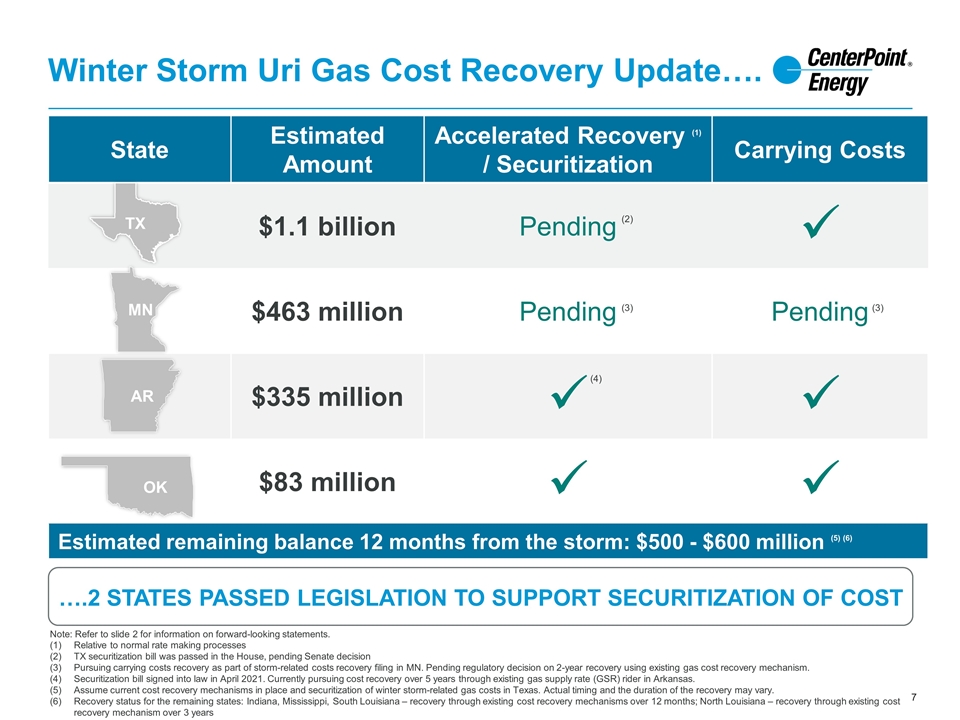
….2 STATES PASSED LEGISLATION TO SUPPORT SECURITIZATION OF COST Note: Refer to slide 2 for information on forward-looking statements. Relative to normal rate making processes TX securitization bill was passed in the House, pending Senate decision Pursuing carrying costs recovery as part of storm-related costs recovery filing in MN. Pending regulatory decision on 2-year recovery using existing gas cost recovery mechanism. Securitization bill signed into law in April 2021. Currently pursuing cost recovery over 5 years through existing gas supply rate (GSR) rider in Arkansas. Assume current cost recovery mechanisms in place and securitization of winter storm-related gas costs in Texas. Actual timing and the duration of the recovery may vary. Recovery status for the remaining states: Indiana, Mississippi, South Louisiana – recovery through existing cost recovery mechanisms over 12 months; North Louisiana – recovery through existing cost recovery mechanism over 3 years Winter Storm Uri Gas Cost Recovery Update…. State Estimated Amount Accelerated Recovery (1) / Securitization Carrying Costs $1.1 billion Pending ü $463 million Pending Pending $335 million ü ü $83 million ü ü Estimated remaining balance 12 months from the storm: $500 - $600 million (5) (6) TX MN AR OK (4) (3) (3) (2)
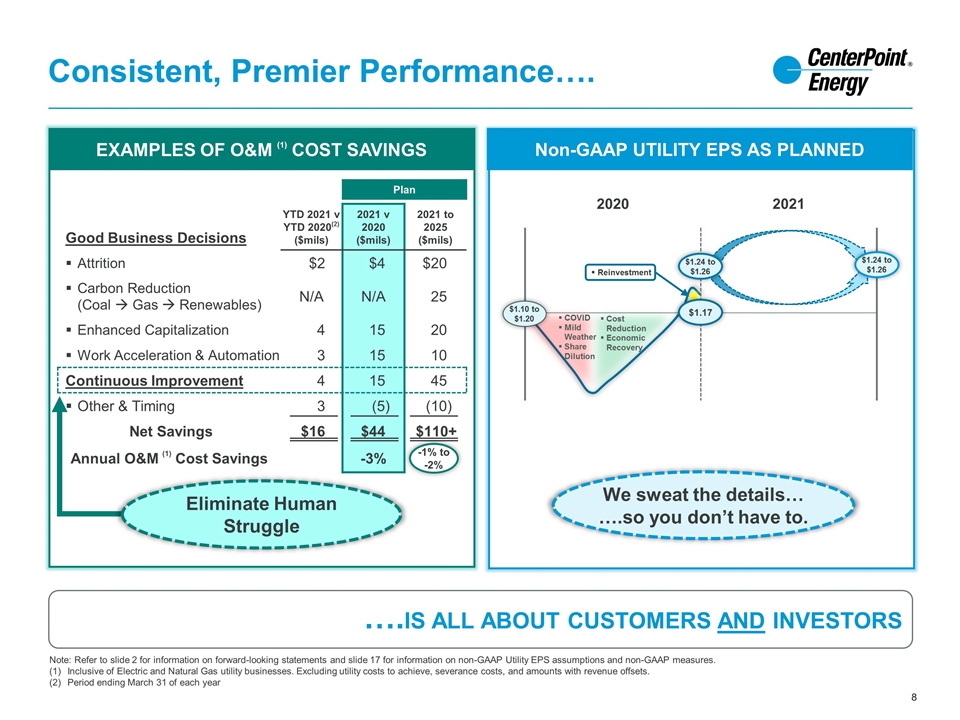
Consistent, Premier Performance…. Non-GAAP UTILITY EPS AS PLANNED We sweat the details… ….so you don’t have to. ….IS ALL ABOUT CUSTOMERS AND INVESTORS Note: Refer to slide 2 for information on forward-looking statements and slide 17 for information on non-GAAP Utility EPS assumptions and non-GAAP measures. Inclusive of Electric and Natural Gas utility businesses. Excluding utility costs to achieve, severance costs, and amounts with revenue offsets. Period ending March 31 of each year EXAMPLES OF O&M (1) COST SAVINGS Plan Good Business Decisions YTD 2021 v YTD 2020(2) ($mils) 2021 v 2020 ($mils) 2021 to 2025 ($mils) Attrition $2 $4 $20 Carbon Reduction (Coal à Gas à Renewables) N/A N/A 25 Enhanced Capitalization 4 15 20 Work Acceleration & Automation 3 15 10 Continuous Improvement 4 15 45 Other & Timing 3 (5) (10) Net Savings $16 $44 $110+ Annual O&M (1) Cost Savings -3% -1% to -2% COVID Mild Weather Share Dilution $1.10 to $1.20 Cost Reduction Economic Recovery $1.17 Reinvestment 2020 2021 $1.24 to $1.26 $1.24 to $1.26 Eliminate Human Struggle
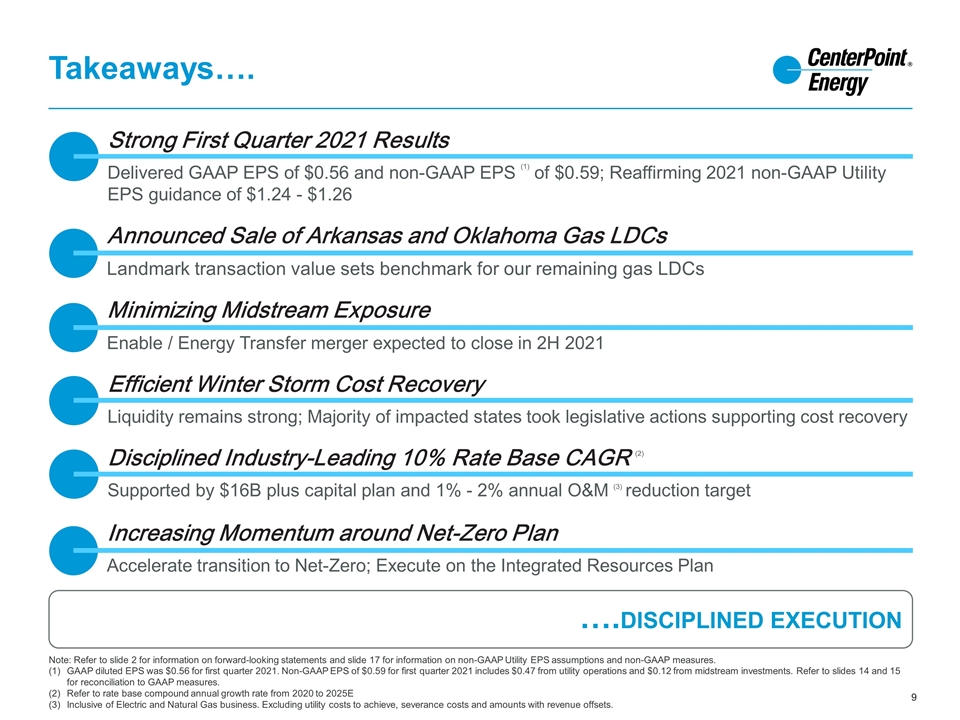
Takeaways…. Strong First Quarter 2021 Results Delivered GAAP EPS of $0.56 and non-GAAP EPS (1) of $0.59; Reaffirming 2021 non-GAAP Utility EPS guidance of $1.24 - $1.26 Minimizing Midstream Exposure Enable / Energy Transfer merger expected to close in 2H 2021 Announced Sale of Arkansas and Oklahoma Gas LDCs Landmark transaction value sets benchmark for our remaining gas LDCs Note: Refer to slide 2 for information on forward-looking statements and slide 17 for information on non-GAAP Utility EPS assumptions and non-GAAP measures. GAAP diluted EPS was $0.56 for first quarter 2021. Non-GAAP EPS of $0.59 for first quarter 2021 includes $0.47 from utility operations and $0.12 from midstream investments. Refer to slides 14 and 15 for reconciliation to GAAP measures. Refer to rate base compound annual growth rate from 2020 to 2025E Inclusive of Electric and Natural Gas business. Excluding utility costs to achieve, severance costs and amounts with revenue offsets. ….DISCIPLINED EXECUTION Increasing Momentum around Net-Zero Plan Accelerate transition to Net-Zero; Execute on the Integrated Resources Plan Disciplined Industry-Leading 10% Rate Base CAGR (2) Supported by $16B plus capital plan and 1% - 2% annual O&M (3) reduction target Efficient Winter Storm Cost Recovery Liquidity remains strong; Majority of impacted states took legislative actions supporting cost recovery
THANK YOU FOR YOUR SUPPORT Contacts Philip Holder Senior Vice President Strategic Planning and Investor Relations Tel. (713) 207 – 7792 philip.holder@centerpointenergy.com Panpim Lohachala Manager Investor Relations Tel. (713) 207 – 7961 panpim.lohachala@centerpointenergy.com Jackie Richert Director Investor Relations Tel. (713) 207 – 9380 jackie.richert@centerpointenergy.com
Appendix
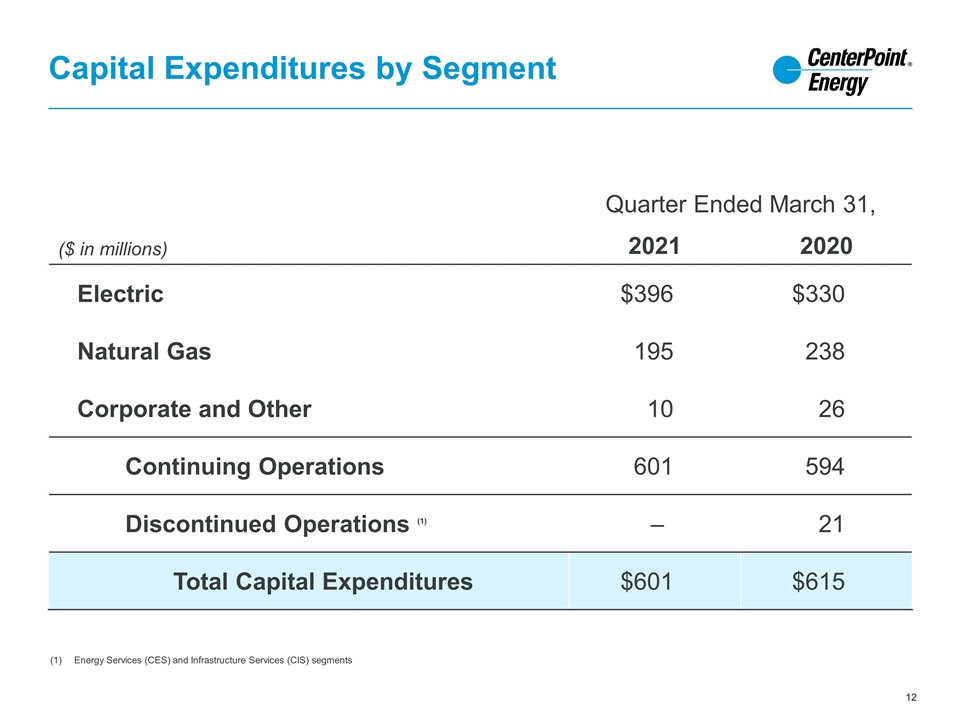
Capital Expenditures by Segment Quarter Ended March 31, ($ in millions) 2021 2020 Electric $396 $330 Natural Gas 195 238 Corporate and Other 10 26 Continuing Operations 601 594 Discontinued Operations (1) – 21 Total Capital Expenditures $601 $615 Energy Services (CES) and Infrastructure Services (CIS) segments
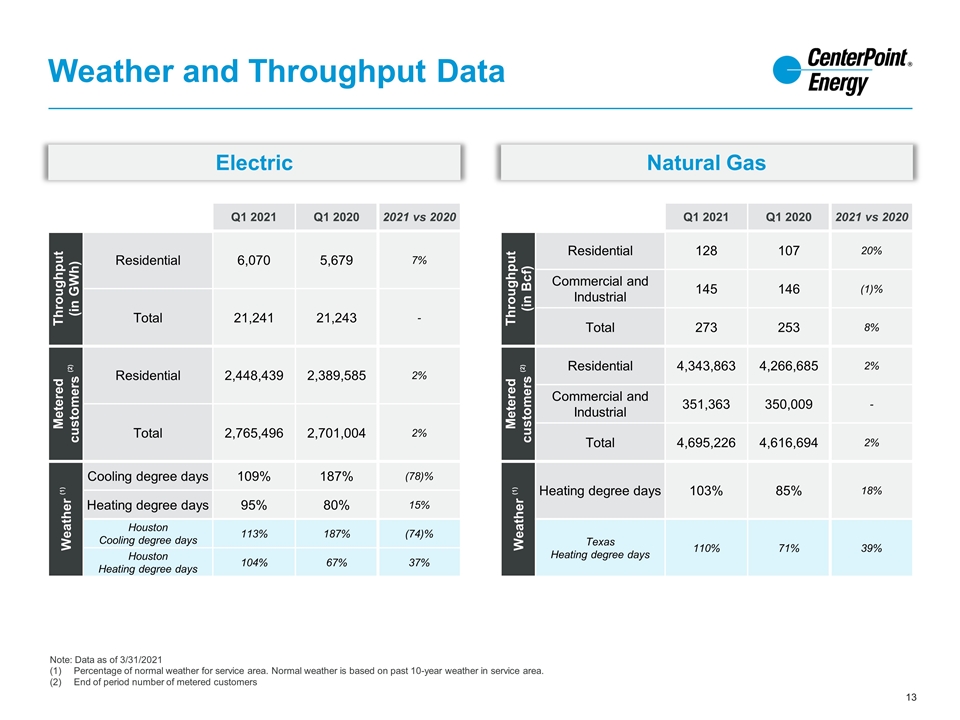
Weather and Throughput Data Note: Data as of 3/31/2021 Percentage of normal weather for service area. Normal weather is based on past 10-year weather in service area. End of period number of metered customers Q1 2021 Q1 2020 2021 vs 2020 Throughput (in GWh) Residential 6,070 5,679 7% Total 21,241 21,243 - Metered customers (2) Residential 2,448,439 2,389,585 2% Total 2,765,496 2,701,004 2% Weather (1) Cooling degree days 109% 187% (78)% Heating degree days 95% 80% 15% Houston Cooling degree days 113% 187% (74)% Houston Heating degree days 104% 67% 37% Q1 2021 Q1 2020 2021 vs 2020 Throughput (in Bcf) Residential 128 107 20% Commercial and Industrial 145 146 (1)% Total 273 253 8% Metered customers (2) Residential 4,343,863 4,266,685 2% Commercial and Industrial 351,363 350,009 - Total 4,695,226 4,616,694 2% Weather (1) Heating degree days 103% 85% 18% Texas Heating degree days 110% 71% 39% Electric Natural Gas
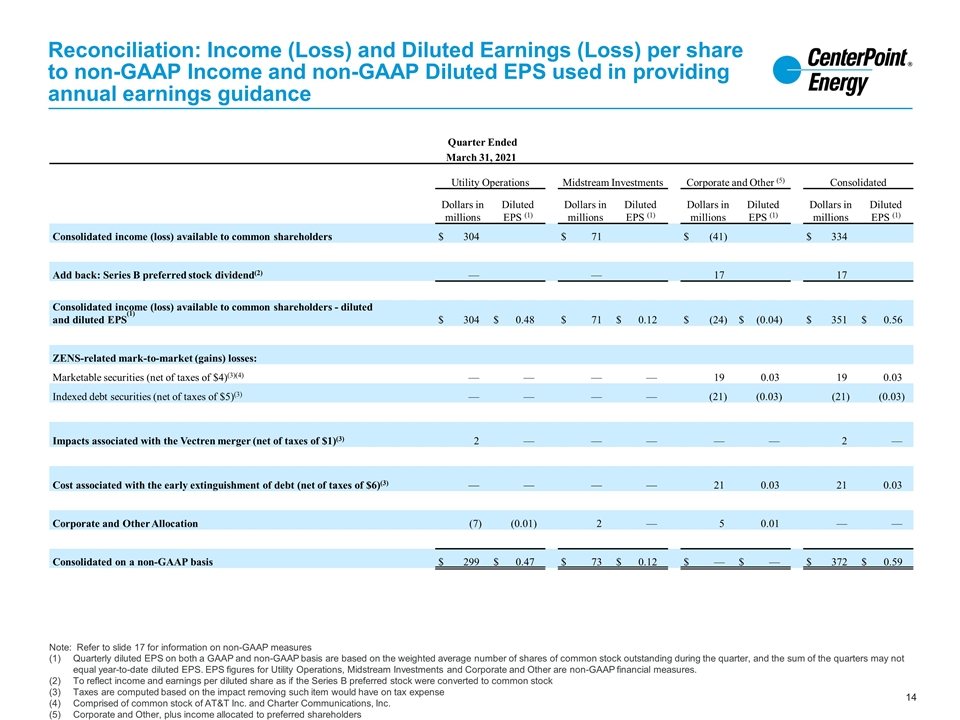
Reconciliation: Income (Loss) and Diluted Earnings (Loss) per share to non-GAAP Income and non-GAAP Diluted EPS used in providing annual earnings guidance Note: Refer to slide 17 for information on non-GAAP measures Quarterly diluted EPS on both a GAAP and non-GAAP basis are based on the weighted average number of shares of common stock outstanding during the quarter, and the sum of the quarters may not equal year-to-date diluted EPS. EPS figures for Utility Operations, Midstream Investments and Corporate and Other are non-GAAP financial measures. To reflect income and earnings per diluted share as if the Series B preferred stock were converted to common stock Taxes are computed based on the impact removing such item would have on tax expense Comprised of common stock of AT&T Inc. and Charter Communications, Inc. Corporate and Other, plus income allocated to preferred shareholders Quarter Ended March 31, 2021 Utility Operations Midstream Investments Corporate and Other (5) Consolidated Dollars in millions Diluted EPS (1) Dollars in millions Diluted EPS (1) Dollars in millions Diluted EPS (1) Dollars in millions Diluted EPS (1) Consolidated income (loss) available to common shareholders $ 304 $ 71 $ (41) $ 334 Add back: Series B preferred stock dividend(2) — — 17 17 Consolidated income (loss) available to common shareholders - diluted and diluted EPS(1) $ 304 $ 0.48 $ 71 $ 0.12 $ (24) $ (0.04) $ 351 $ 0.56 ZENS-related mark-to-market (gains) losses: Marketable securities (net of taxes of $4)(3)(4) — — — — 19 0.03 19 0.03 Indexed debt securities (net of taxes of $5)(3) — — — — (21) (0.03) (21) (0.03) Impacts associated with the Vectren merger (net of taxes of $1)(3) 2 — — — — — 2 — Cost associated with the early extinguishment of debt (net of taxes of $6)(3) — — — — 21 0.03 21 0.03 Corporate and Other Allocation (7) (0.01) 2 — 5 0.01 — — Consolidated on a non-GAAP basis $ 299 $ 0.47 $ 73 $ 0.12 $ — $ — $ 372 $ 0.59
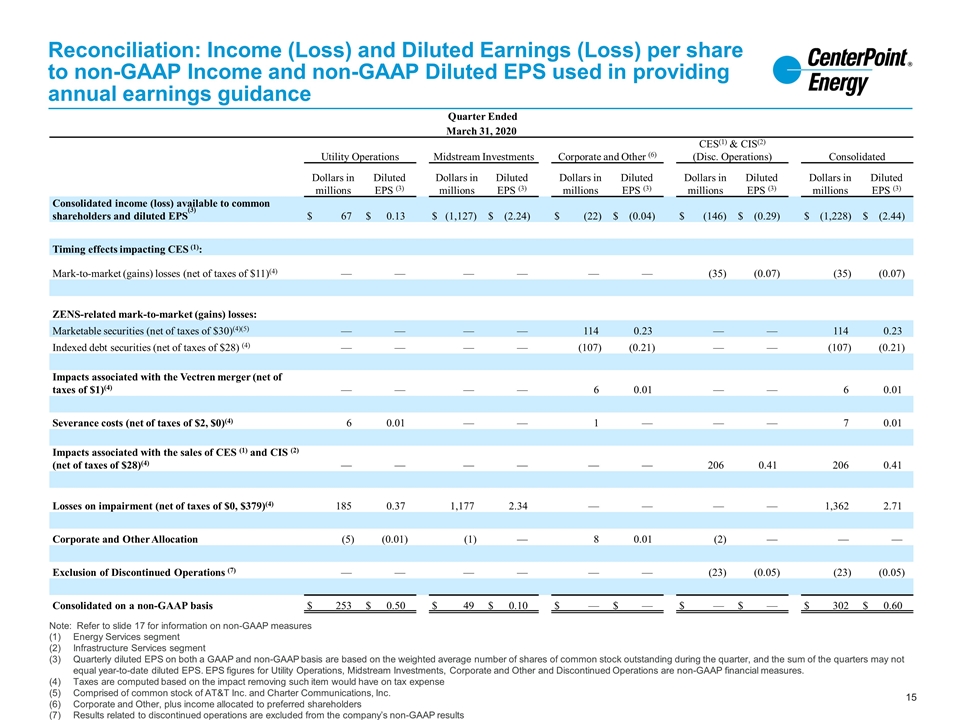
Reconciliation: Income (Loss) and Diluted Earnings (Loss) per share to non-GAAP Income and non-GAAP Diluted EPS used in providing annual earnings guidance Note: Refer to slide 17 for information on non-GAAP measures Energy Services segment Infrastructure Services segment Quarterly diluted EPS on both a GAAP and non-GAAP basis are based on the weighted average number of shares of common stock outstanding during the quarter, and the sum of the quarters may not equal year-to-date diluted EPS. EPS figures for Utility Operations, Midstream Investments, Corporate and Other and Discontinued Operations are non-GAAP financial measures. Taxes are computed based on the impact removing such item would have on tax expense Comprised of common stock of AT&T Inc. and Charter Communications, Inc. Corporate and Other, plus income allocated to preferred shareholders Results related to discontinued operations are excluded from the company’s non-GAAP results Quarter Ended March 31, 2020 Utility Operations Midstream Investments Corporate and Other (6) CES(1) & CIS(2) (Disc. Operations) Consolidated Dollars in millions Diluted EPS (3) Dollars in millions Diluted EPS (3) Dollars in millions Diluted EPS (3) Dollars in millions Diluted EPS (3) Dollars in millions Diluted EPS (3) Consolidated income (loss) available to common shareholders and diluted EPS(3) $ 67 $ 0.13 $ (1,127) $ (2.24) $ (22) $ (0.04) $ (146) $ (0.29) $ (1,228) $ (2.44) Timing effects impacting CES (1): Mark-to-market (gains) losses (net of taxes of $11)(4) — — — — — — (35) (0.07) (35) (0.07) ZENS-related mark-to-market (gains) losses: Marketable securities (net of taxes of $30)(4)(5) — — — — 114 0.23 — — 114 0.23 Indexed debt securities (net of taxes of $28) (4) — — — — (107) (0.21) — — (107) (0.21) Impacts associated with the Vectren merger (net of taxes of $1)(4) — — — — 6 0.01 — — 6 0.01 Severance costs (net of taxes of $2, $0)(4) 6 0.01 — — 1 — — — 7 0.01 Impacts associated with the sales of CES (1) and CIS (2) (net of taxes of $28)(4) — — — — — — 206 0.41 206 0.41 Losses on impairment (net of taxes of $0, $379)(4) 185 0.37 1,177 2.34 — — — — 1,362 2.71 Corporate and Other Allocation (5) (0.01) (1) — 8 0.01 (2) — — — Exclusion of Discontinued Operations (7) — — — — — — (23) (0.05) (23) (0.05) Consolidated on a non-GAAP basis $ 253 $ 0.50 $ 49 $ 0.10 $ — $ — $ — $ — $ 302 $ 0.60
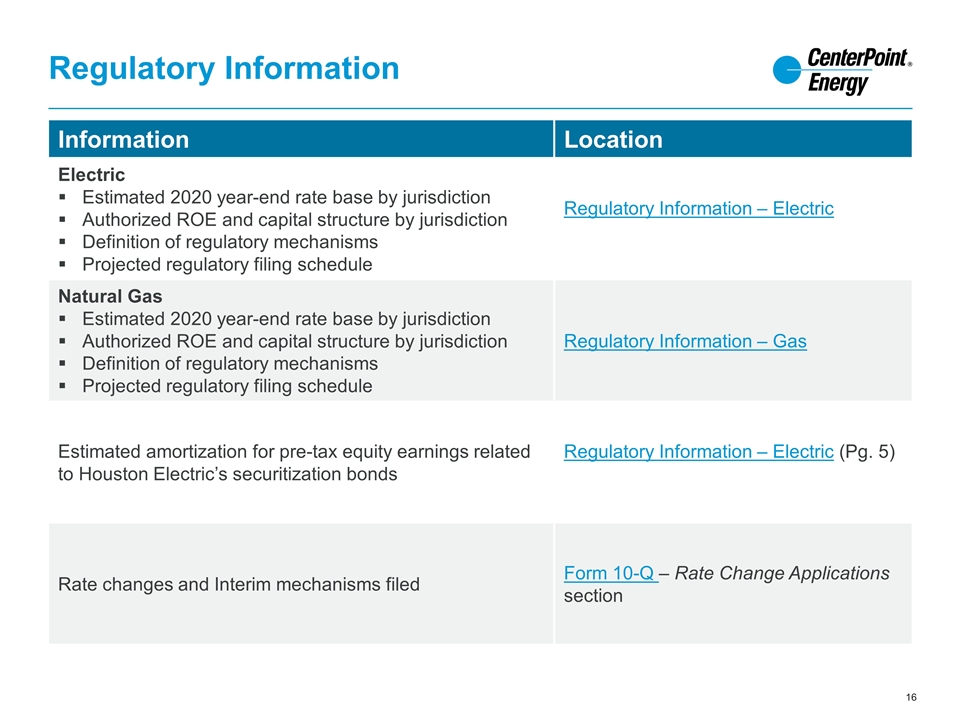
Regulatory Information Information Location Electric Estimated 2020 year-end rate base by jurisdiction Authorized ROE and capital structure by jurisdiction Definition of regulatory mechanisms Projected regulatory filing schedule Regulatory Information – Electric Natural Gas Estimated 2020 year-end rate base by jurisdiction Authorized ROE and capital structure by jurisdiction Definition of regulatory mechanisms Projected regulatory filing schedule Regulatory Information – Gas Estimated amortization for pre-tax equity earnings related to Houston Electric’s securitization bonds Regulatory Information – Electric (Pg. 5) Rate changes and Interim mechanisms filed Form 10-Q – Rate Change Applications section
Additional information Use of Non-GAAP Financial Measures In this presentation and the oral statements made in connection herewith, CenterPoint Energy presents, based on diluted earnings per share, non-GAAP Utility earnings per share (“Utility EPS”), which is not a generally accepted accounting principles (“GAAP”) financial measure. Generally, a non-GAAP financial measure is a numerical measure of a company’s historical or future financial performance that excludes or includes amounts that are not normally excluded or included in the most directly comparable GAAP financial measure. 2021 Utility EPS includes net income from Electric and Natural Gas segments, as well as after tax Corporate and Other operating income and an allocation of corporate overhead based upon the Utility’s relative earnings contribution. Corporate overhead consists primarily of interest expense, preferred stock dividend requirements, and other items directly attributable to the parent along with the associated income taxes. Utility EPS excludes (a) earnings or losses from the change in value of CenterPoint Energy's 2.0% Zero-Premium Exchangeable Subordinated Notes due 2029 (“ZENS”) and related securities, (b) certain expenses associated with merger integration, (c) Midstream Investments segment and associated income from the Enable preferred units and a corresponding amount of debt in addition to an allocation of associated corporate overhead and impact, including related expenses, associated with the merger between Enable and Energy Transfer, (d) cost associated with the early extinguishment of debt and (e) gain and impact, including related expenses, associated with gas LDC sales. 2021 Utility EPS does not consider the items noted above and other potential impacts, such as changes in accounting standards, impairments or other unusual items, which could have a material impact on GAAP reported results for the applicable guidance period. 2021 Utility EPS also considers assumptions for certain significant variables that may impact earnings, such as customer growth and usage including normal weather, throughput, recovery of capital invested, effective tax rates, financing activities and related interest rates and regulatory and judicial proceedings. In addition, the 2021 Utility EPS guidance range assumes a continued re-opening of the economy in CenterPoint Energy's service territories throughout 2021.To the extent actual results deviate from these assumptions, the 2021 Utility EPS guidance range may not be met or the projected annual Utility EPS growth rate may change. CenterPoint Energy is unable to present a quantitative reconciliation of forward-looking 2021 Utility EPS because changes in the value of ZENS and related securities, future impairments and other unusual items are not estimable and are difficult to predict due to various factors outside of management’s control. The appendix to this presentation contains a reconciliation of income (loss) available to common shareholders and diluted earnings (loss) per share to the basis used in providing guidance. Management evaluates the Company’s financial performance in part based on non-GAAP income and Utility EPS. Management believes that presenting these non-GAAP financial measures enhances an investor’s understanding of CenterPoint Energy’s overall financial performance by providing them with an additional meaningful and relevant comparison of current and anticipated future results across periods. The adjustments made in these non-GAAP financial measures exclude items that Management believes do not most accurately reflect the Company’s fundamental business performance. These excluded items are reflected in the reconciliation tables, where applicable. CenterPoint Energy’s non-GAAP income and Utility EPS non-GAAP financial measures should be considered as a supplement to, and not as a substitute for, or superior to, income available to common shareholders and diluted earnings per share, which are the most directly comparable GAAP financial measures. These non-GAAP financial measures also may be different than non-GAAP financial measures used by other companies. Important Information for Investors and Unitholders This presentation is for informational purposes only and does not constitute an offer to sell or the solicitation of an offer to buy any securities or a solicitation of any vote or approval. In connection with the proposed merger between Enable and a subsidiary of Energy Transfer, Energy Transfer filed with the SEC a registration statement on Form S-4, which included a prospectus of Energy Transfer and a consent solicitation statement of Enable. Energy Transfer and Enable have also filed other documents with the SEC regarding the proposed merger. As the registration statement has been declared effective by the SEC, a definitive consent solicitation statement/prospectus was mailed to the unitholders of Enable. INVESTORS AND UNITHOLDERS OF ENABLE ARE URGED TO READ THE CONSENT SOLICITATION STATEMENT/PROSPECTUS (INCLUDING ALL AMENDMENTS AND SUPPLEMENTS THERETO) AND OTHER DOCUMENTS RELATING TO THE PROPOSED MERGER FILED WITH THE SEC CAREFULLY AND IN THEIR ENTIRETY BECAUSE THEY CONTAIN IMPORTANT INFORMATION ABOUT THE PROPOSED MERGER. Investors and unitholders will be able to obtain free copies of the consent solicitation statement/prospectus and other documents containing important information about Energy Transfer and Enable through the website maintained by the SEC at http://www.sec.gov. Copies of the documents filed with the SEC by Energy Transfer and Enable will be available free of charge on their respective internet websites at https://www.energytransfer.com/ and https://www.enablemidstream.com/ or by contacting their respective Investor Relations departments at 214-981-0795 (for Energy Transfer) or 405-558-4600 (for Enable).
