Attached files
| file | filename |
|---|---|
| EX-99.1 - EX-99.1 - BEACON ROOFING SUPPLY INC | becn-ex991_6.htm |
| 8-K - 8-K - BEACON ROOFING SUPPLY INC | becn-8k_20210506.htm |

MAY 6, 2021 2021 2nd quarter earnings call Exhibit 99.2
Disclosure notice This presentation contains information about management's view of the Company's future expectations, plans and prospects that constitute forward-looking statements for purposes of the safe harbor provisions under the Private Securities Litigation Reform Act of 1995. Actual results may differ materially from those indicated by such forward-looking statements as a result of various important factors, including, but not limited to, those set forth in the "Risk Factors" section of the Company's Form 10-K for the fiscal year ended September 30, 2020. In addition, the forward-looking statements included in this presentation represent the Company's views as of the date of this presentation and these views could change. However, while the Company may elect to update these forward-looking statements at some point, the Company specifically disclaims any obligation to do so, other than as required by federal securities laws. These forward-looking statements should not be relied upon as representing the Company's views as of any date subsequent to the date of this presentation. This presentation contains references to certain financial measures that are not presented in accordance with United States Generally Accepted Accounting Principles (“GAAP"). The Company uses non-GAAP financial measures to evaluate financial performance, analyze underlying business trends and establish operational goals and forecasts that are used when allocating resources. The Company believes these non-GAAP financial measures permit investors to better understand changes over comparative periods by providing financial results that are unaffected by certain items that are not indicative of ongoing operating performance. While the Company believes these measures are useful to investors when evaluating performance, they are not prepared and presented in accordance with GAAP, and therefore should be considered supplemental in nature. The Company’s non-GAAP financial measures should not be considered in isolation or as a substitute for other financial performance measures presented in accordance with GAAP. These non-GAAP financial measures may have material limitations including, but not limited to, the exclusion of certain costs without a corresponding reduction of net income for the income generated by the assets to which the excluded costs relate. In addition, these non-GAAP financial measures may differ from similarly titled measures presented by other companies. A reconciliation of these non-GAAP financial measures to their most directly comparable GAAP financial measure can be found in the Appendix as well as Company’s latest Form 8-K, filed with the SEC on May 6, 2021.

3 President & chief executive officer Julian francis
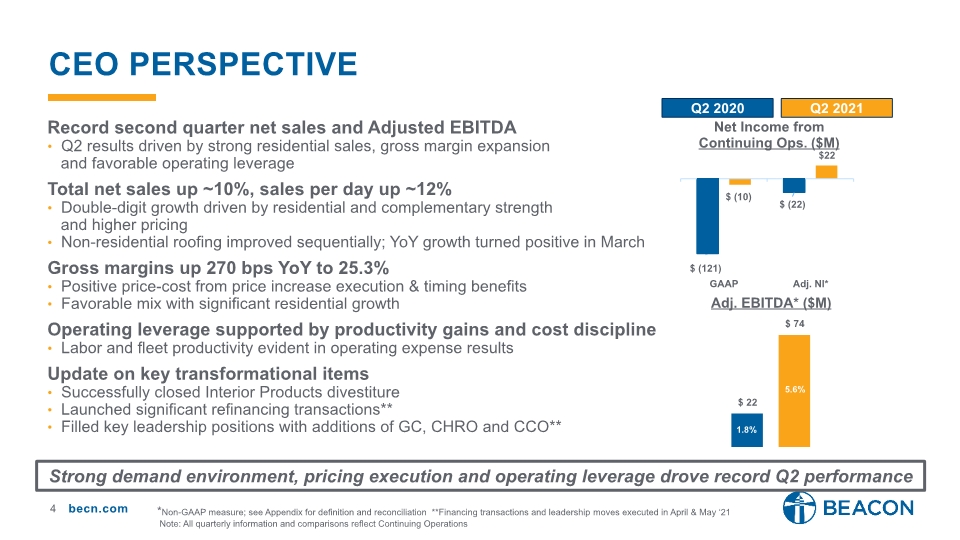
4 Record second quarter net sales and Adjusted EBITDA Q2 results driven by strong residential sales, gross margin expansion and favorable operating leverage Total net sales up ~10%, sales per day up ~12% Double-digit growth driven by residential and complementary strength and higher pricing Non-residential roofing improved sequentially; YoY growth turned positive in March Gross margins up 270 bps YoY to 25.3% Positive price-cost from price increase execution & timing benefits Favorable mix with significant residential growth Operating leverage supported by productivity gains and cost discipline Labor and fleet productivity evident in operating expense results Update on key transformational items Successfully closed Interior Products divestiture Launched significant refinancing transactions** Filled key leadership positions with additions of GC, CHRO and CCO** Ceo perspective *Non-GAAP measure; see Appendix for definition and reconciliation **Financing transactions and leadership moves executed in April & May ‘21 Note: All quarterly information and comparisons reflect Continuing Operations 5.6% 1.8% Strong demand environment, pricing execution and operating leverage drove record Q2 performance Q2 2021 Q2 2020
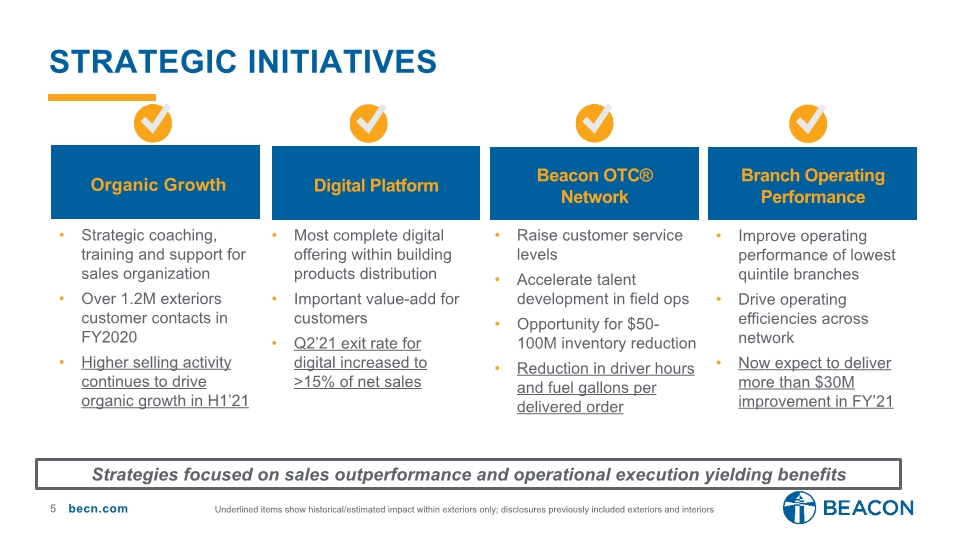
Strategic initiatives Strategic coaching, training and support for sales organization Over 1.2M exteriors customer contacts in FY2020 Higher selling activity continues to drive organic growth in H1’21 Organic Growth Branch Operating Performance Improve operating performance of lowest quintile branches Drive operating efficiencies across network Now expect to deliver more than $30M improvement in FY’21 Raise customer service levels Accelerate talent development in field ops Opportunity for $50-100M inventory reduction Reduction in driver hours and fuel gallons per delivered order Beacon OTC® Network Most complete digital offering within building products distribution Important value-add for customers Q2’21 exit rate for digital increased to >15% of net sales Digital Platform Underlined items show historical/estimated impact within exteriors only; disclosures previously included exteriors and interiors Strategies focused on sales outperformance and operational execution yielding benefits

6 Executive vice president & chief financial officer Frank lonegro
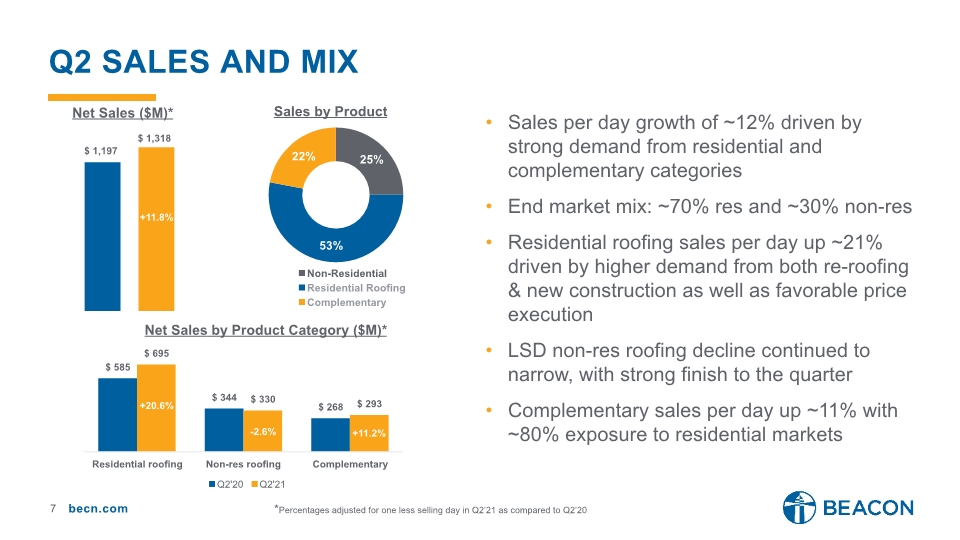
7 Q2 Sales and MIX Sales per day growth of ~12% driven by strong demand from residential and complementary categories End market mix: ~70% res and ~30% non-res Residential roofing sales per day up ~21% driven by higher demand from both re-roofing & new construction as well as favorable price execution LSD non-res roofing decline continued to narrow, with strong finish to the quarter Complementary sales per day up ~11% with ~80% exposure to residential markets *Percentages adjusted for one less selling day in Q2’21 as compared to Q2’20 +11.8%
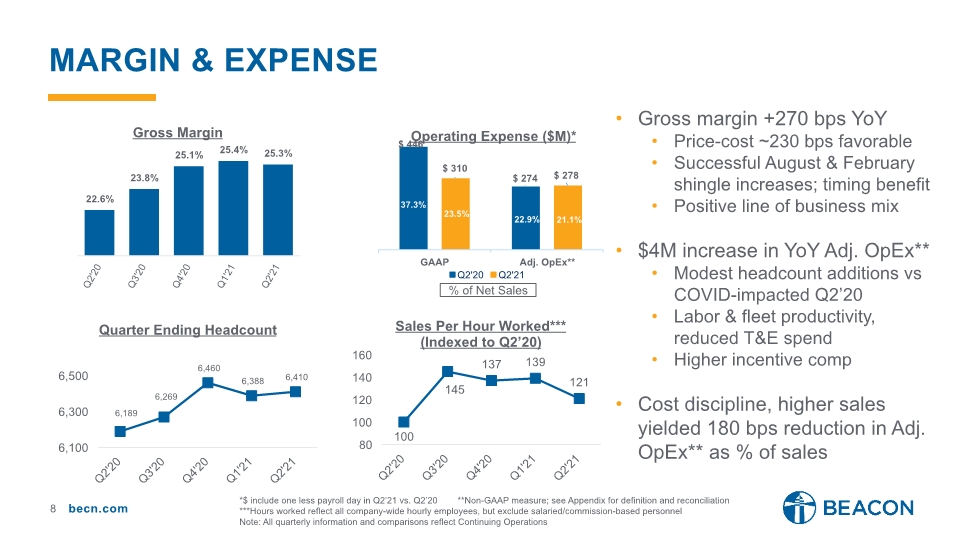
Margin & expense Gross margin +270 bps YoY Price-cost ~230 bps favorable Successful August & February shingle increases; timing benefit Positive line of business mix $4M increase in YoY Adj. OpEx** Modest headcount additions vs COVID-impacted Q2’20 Labor & fleet productivity, reduced T&E spend Higher incentive comp Cost discipline, higher sales yielded 180 bps reduction in Adj. OpEx** as % of sales ***Hours worked reflect all company-wide hourly employees, but exclude salaried/commission-based personnel Note: All quarterly information and comparisons reflect Continuing Operations *$ include one less payroll day in Q2’21 vs. Q2’20 **Non-GAAP measure; see Appendix for definition and reconciliation % of Net Sales
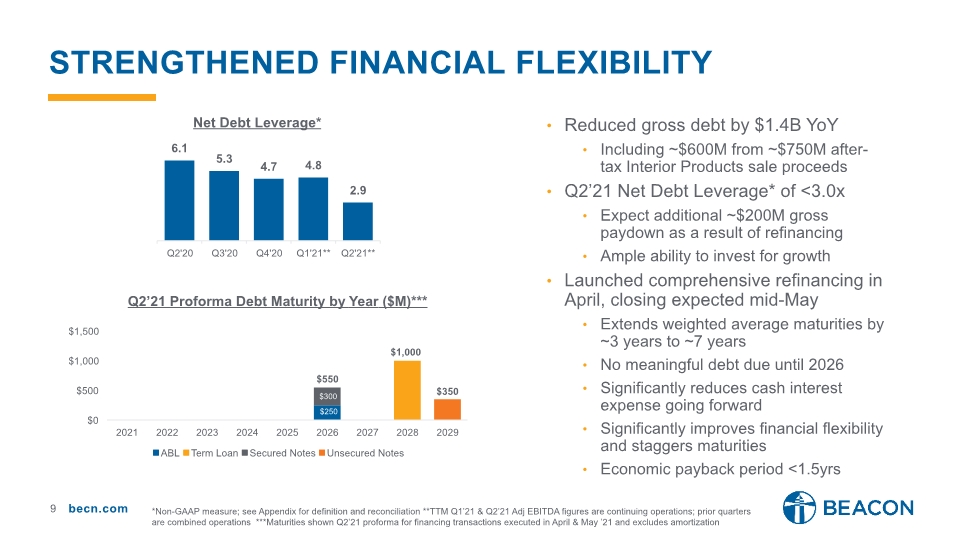
Strengthened financial flexibility Reduced gross debt by $1.4B YoY Including ~$600M from ~$750M after-tax Interior Products sale proceeds Q2’21 Net Debt Leverage* of <3.0x Expect additional ~$200M gross paydown as a result of refinancing Ample ability to invest for growth Launched comprehensive refinancing in April, closing expected mid-May Extends weighted average maturities by ~3 years to ~7 years No meaningful debt due until 2026 Significantly reduces cash interest expense going forward Significantly improves financial flexibility and staggers maturities Economic payback period <1.5yrs *Non-GAAP measure; see Appendix for definition and reconciliation **TTM Q1’21 & Q2’21 Adj EBITDA figures are continuing operations; prior quarters are combined operations ***Maturities shown Q2’21 proforma for financing transactions executed in April & May ’21 and excludes amortization

President & chief executive officer Julian francis
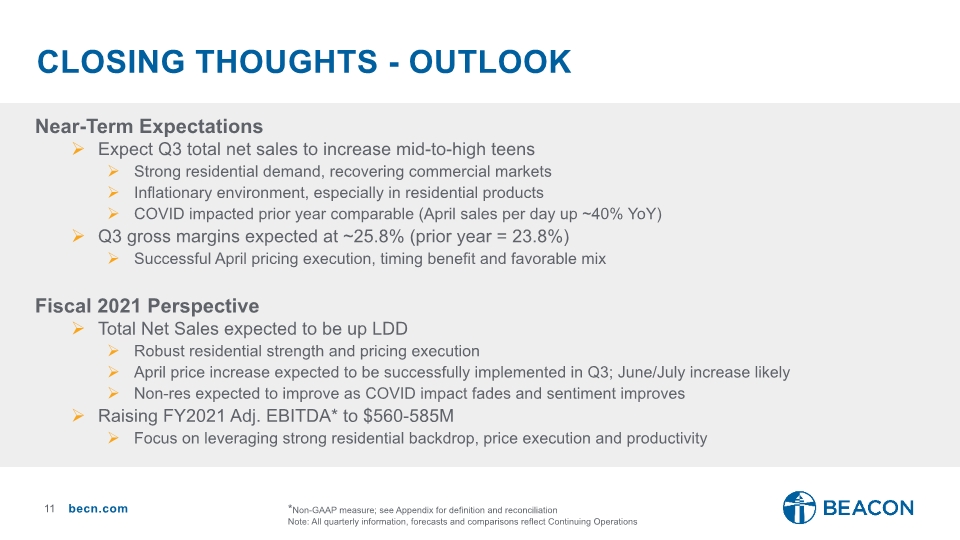
11 Closing thoughts - outlook Near-Term Expectations Expect Q3 total net sales to increase mid-to-high teens Strong residential demand, recovering commercial markets Inflationary environment, especially in residential products COVID impacted prior year comparable (April sales per day up ~40% YoY) Q3 gross margins expected at ~25.8% (prior year = 23.8%) Successful April pricing execution, timing benefit and favorable mix Fiscal 2021 Perspective Total Net Sales expected to be up LDD Robust residential strength and pricing execution April price increase expected to be successfully implemented in Q3; June/July increase likely Non-res expected to improve as COVID impact fades and sentiment improves Raising FY2021 Adj. EBITDA* to $560-585M Focus on leveraging strong residential backdrop, price execution and productivity *Non-GAAP measure; see Appendix for definition and reconciliation Note: All quarterly information, forecasts and comparisons reflect Continuing Operations
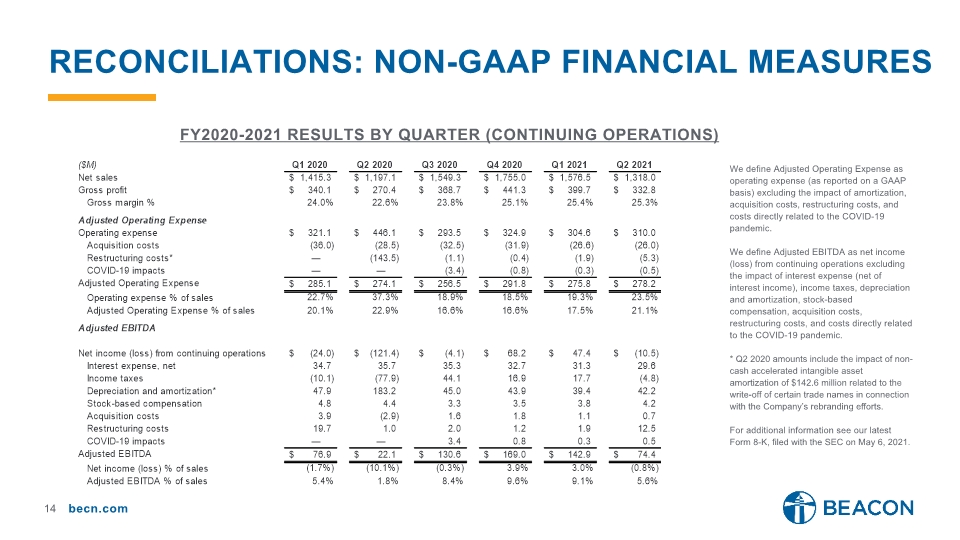
Reconciliations: non-gaap financial measures FY2020-2021 results by Quarter (Continuing operations) We define Adjusted Operating Expense as operating expense (as reported on a GAAP basis) excluding the impact of amortization, acquisition costs, restructuring costs, and costs directly related to the COVID-19 pandemic. We define Adjusted EBITDA as net income (loss) from continuing operations excluding the impact of interest expense (net of interest income), income taxes, depreciation and amortization, stock-based compensation, acquisition costs, restructuring costs, and costs directly related to the COVID-19 pandemic. * Q2 2020 amounts include the impact of non-cash accelerated intangible asset amortization of $142.6 million related to the write-off of certain trade names in connection with the Company’s rebranding efforts. For additional information see our latest Form 8-K, filed with the SEC on May 6, 2021.
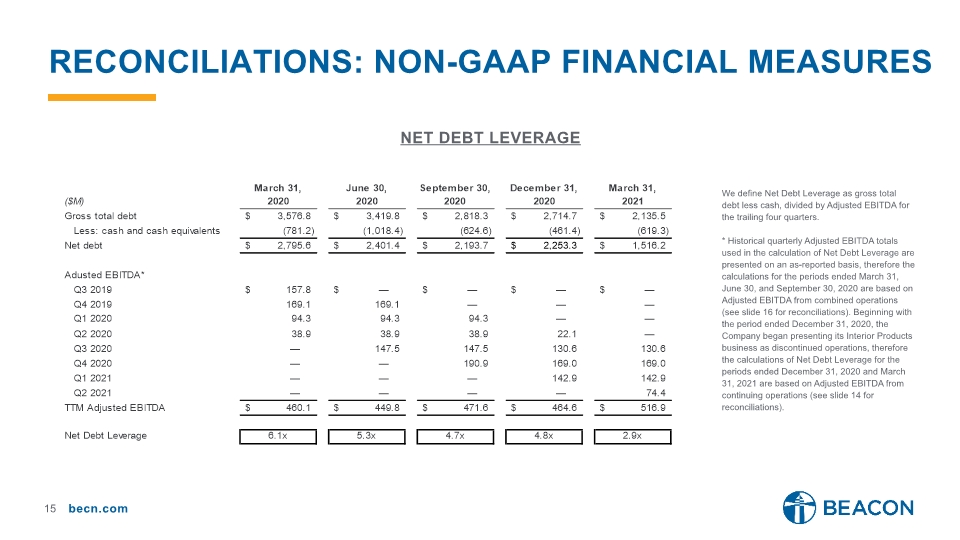
Reconciliations: non-gaap financial measures Net debt leverage We define Net Debt Leverage as gross total debt less cash, divided by Adjusted EBITDA for the trailing four quarters. * Historical quarterly Adjusted EBITDA totals used in the calculation of Net Debt Leverage are presented on an as-reported basis, therefore the calculations for the periods ended March 31, June 30, and September 30, 2020 are based on Adjusted EBITDA from combined operations (see slide 16 for reconciliations). Beginning with the period ended December 31, 2020, the Company began presenting its Interior Products business as discontinued operations, therefore the calculations of Net Debt Leverage for the periods ended December 31, 2020 and March 31, 2021 are based on Adjusted EBITDA from continuing operations (see slide 14 for reconciliations).
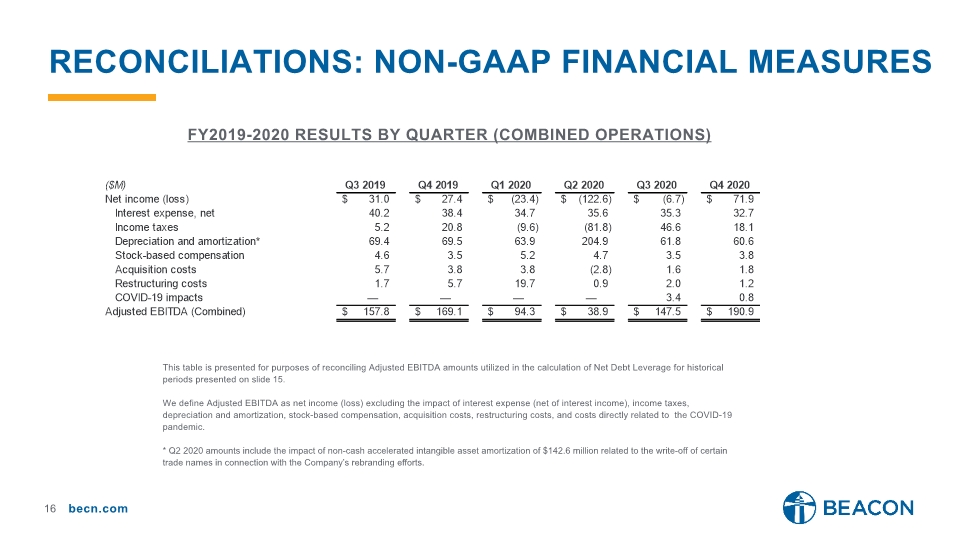
Reconciliations: non-gaap financial measures FY2019-2020 results by Quarter (combined operations) This table is presented for purposes of reconciling Adjusted EBITDA amounts utilized in the calculation of Net Debt Leverage for historical periods presented on slide 15. We define Adjusted EBITDA as net income (loss) excluding the impact of interest expense (net of interest income), income taxes, depreciation and amortization, stock-based compensation, acquisition costs, restructuring costs, and costs directly related to the COVID-19 pandemic. * Q2 2020 amounts include the impact of non-cash accelerated intangible asset amortization of $142.6 million related to the write-off of certain trade names in connection with the Company’s rebranding efforts.
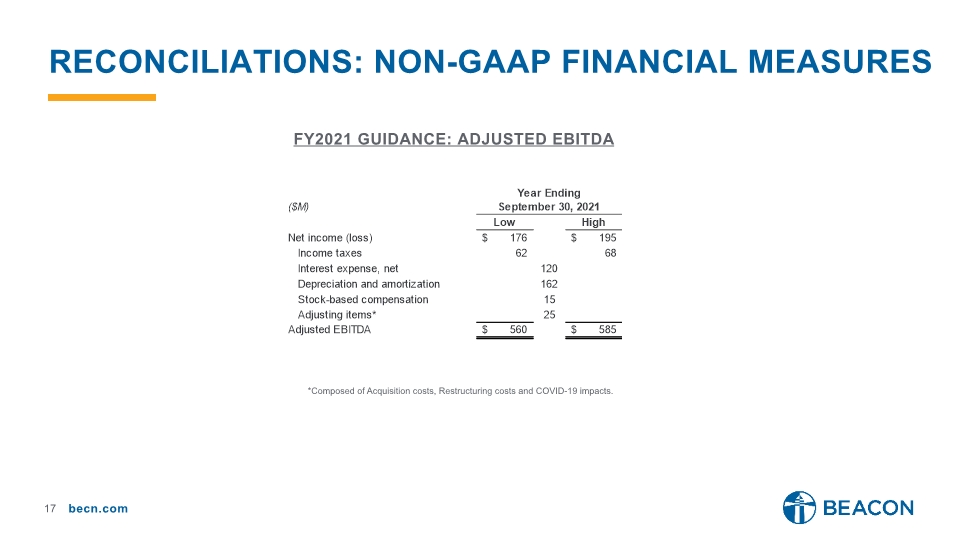
Reconciliations: non-gaap financial measures *Composed of Acquisition costs, Restructuring costs and COVID-19 impacts. Fy2021 guidance: Adjusted ebitda
