Attached files
| file | filename |
|---|---|
| 8-K - FORM 8-K - ARCH RESOURCES, INC. | tm2115356d1_8k.htm |
Exhibit 99.1
Investor Presentation
Investor Presentation Forward - Looking Information and Non - GAAP Financial Measures Forward - Looking Statements: This slide deck contains "forward - looking statements" – that is, statements related to future, not past, events. In this context, forward - looking statements often address our expected future business and financial performance, and often contain words such as "should," "a ppe ars," "expects," "anticipates," "intends," "plans," "believes," "seeks," or "will." Forward - looking statements by their nature address matters that are, to different degre es, uncertain. For us, particular uncertainties arise from the COVID - 19 pandemic, including its adverse effects on businesses, economies, and financial markets worldwide; from the im pact of COVID - 19 on efficiency, costs and production; from changes in the demand for our coal by the steel production and electricity generation industries; from our a bil ity to access the capital markets on acceptable terms and conditions; from policy, legislation and regulations relating to the Clean Air Act, greenhouse gas emissions, incen tiv es for alternative energy sources, and other environmental initiatives; from competition within our industry and with producers of competing energy sources; from our abil ity to successfully acquire or develop coal reserves, including the development of our Leer South mine; from operational, geological, permit, labor, transportation, and weather - relat ed factors; from the effects of foreign and domestic trade policies, actions or disputes; from fluctuations in the amount of cash we generate from operations, which coul d i mpact, among other things, our ability to service our outstanding indebtedness and fund capital expenditures; from our ability to successfully integrate the operations that we ac quire; from our ability to generate significant revenue to make payments required by, and to comply with restrictions related to, our indebtedness, including our ability to rep urchase our convertible notes; from additional demands for credit support by third parties; from the loss of, or significant reduction in, purchases by our largest customer s; from the development of future technology to replace coal with hydrogen in the steelmaking process; and from numerous other matters of national, regional and global scale, includ ing those of a political, economic, business, competitive or regulatory nature. These uncertainties may cause our actual future results to be materially different than tho se expressed in our forward - looking statements. We do not undertake to update our forward - looking statements, whether as a result of new information, future events or otherwise, exce pt as may be required by law. For a description of some of the risks and uncertainties that may affect our future results, you should see the risk factors described from tim e t o time in the reports we file with the Securities and Exchange Commission. 2
Investor Presentation Company Overview 3 ARCH RESOURCES
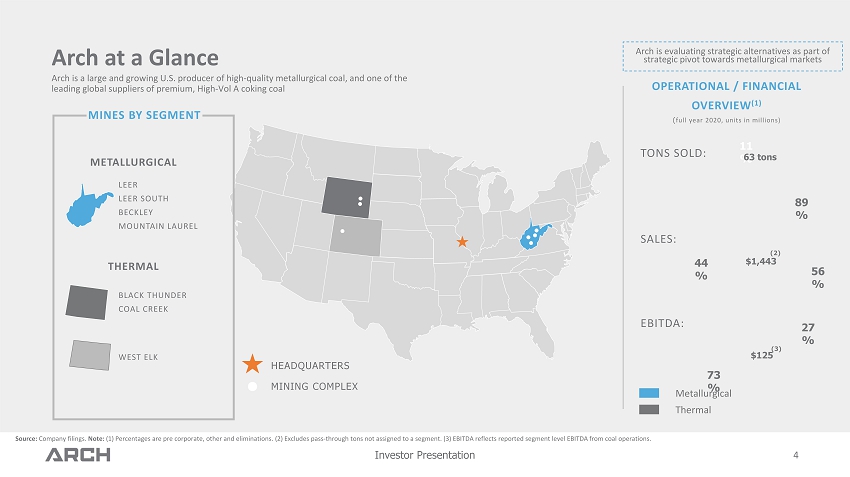
Investor Presentation Arch at a Glance WEST ELK LEER LEER SOUTH BECKLEY MOUNTAIN LAUREL METALLURGICAL BLACK THUNDER COAL CREEK THERMAL HEADQUARTERS MINES BY SEGMENT OPERATIONAL / FINANCIAL OVERVIEW (1) ( full year 2020, units in millions) TONS SOLD: SALES: EBITDA: Metallurgical Thermal Source: Company filings. Note: ( 1) Percentages are pre corporate , other and eliminations. (2) Excludes pass - through tons not assigned to a segment. (3) EBITDA reflects reported segment level EBITDA from coal operations . Arch is a large and growing U.S. producer of high - quality metallurgical coal, and one of the leading global suppliers of premium, High - Vol A coking coal MINING COMPLEX 89 % 11 % 63 tons 56 % 44 % $1,443 27 % 73 % $125 Arch is evaluating strategic alternatives as part of strategic pivot towards metallurgical markets (3) 4 (2)
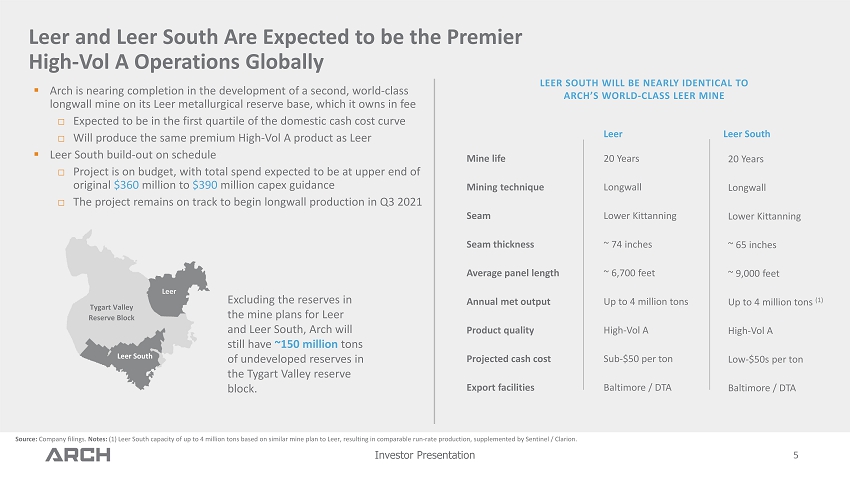
Investor Presentation 20 Years Longwall Lower Kittanning ~ 65 inches ~ 9,000 feet Up to 4 million tons (1) High - Vol A Low - $ 50s per ton Baltimore / DTA 5 Leer and Leer South Are Expected to be the Premier High - Vol A Operations Globally Source: Company filings. Notes: ( 1 ) Leer South capacity of up to 4 million tons based on similar mine plan to Leer, resulting in comparable run - rate production, s upplemented by Sentinel / Clarion. Tygart Valley Reserve Block Leer Leer South Leer Leer South Mine life Mining technique Seam Seam thickness Average panel length Annual met output Product quality Projected cash cost Export facilities 20 Years Longwall Lower Kittanning ~ 74 inches ~ 6,700 feet Up to 4 million tons High - Vol A Sub - $50 per ton Baltimore / DTA Excluding the reserves in the mine plans for Leer and Leer South, Arch will still have ~150 million tons of undeveloped reserves in the Tygart Valley reserve block. LEER SOUTH WILL BE NEARLY IDENTICAL TO ARCH’S WORLD - CLASS LEER MINE ▪ Arch is nearing completion in the development of a second, world - class longwall mine on its Leer metallurgical reserve base, which it owns in fee □ Expected to be in the first quartile of the domestic cash cost curve □ Will produce the same premium High - Vol A product as Leer ▪ Leer South build - out on schedule □ Project is on budget, with total spend expected to be at upper end of original $360 million to $390 million capex guidance □ The project remains on track to begin longwall production in Q3 2021
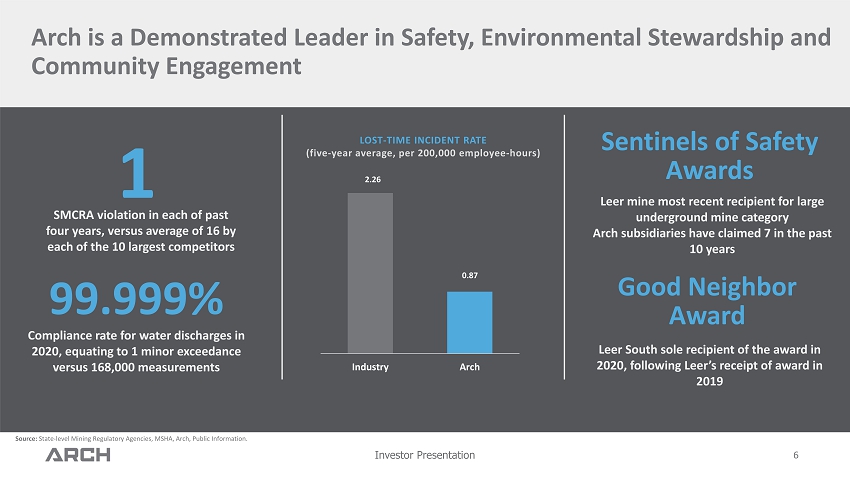
Investor Presentation 6 Arch is a Demonstrated Leader in Safety, Environmental Stewardship and Community Engagement LOST - TIME INCIDENT RATE (five - year average, per 200,000 employee - hours) 99.999% C ompliance rate for water discharges in 2020, equating to 1 minor exceedance versus 168,000 measurements SMCRA violation in each of past four years, versus average of 16 by each of the 10 largest competitors 1 2.26 0.87 Industry Arch Leer mine most recent recipient for large underground mine category Arch subsidiaries have claimed 7 in the past 10 years Sentinels of Safety Awards Leer South sole recipient of the award in 2020, following Leer’s receipt of award in 2019 Good Neighbor Award Source: State - level Mining Regulatory Agencies, MSHA, Arch, Public Information .
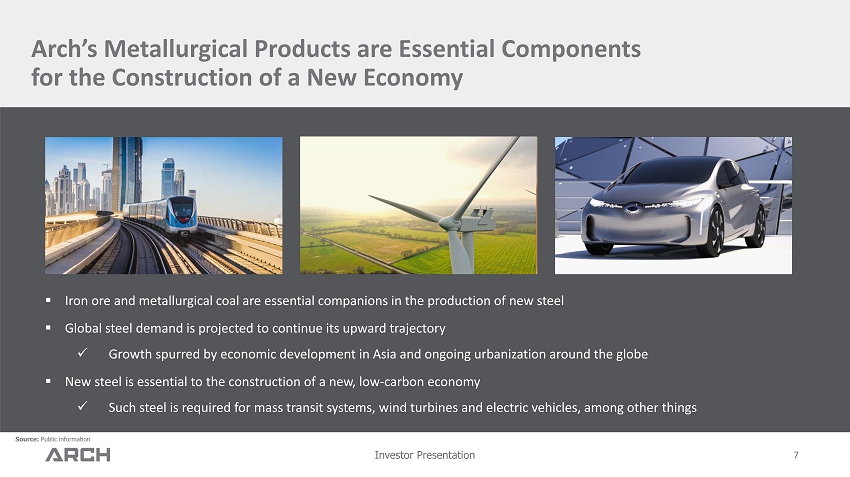
Investor Presentation 7 ▪ Iron ore and metallurgical coal are essential companions in the production of new steel ▪ Global steel demand is projected to continue its upward trajectory x Growth spurred by economic development in Asia and ongoing urbanization around the globe ▪ New steel is essential to the construction of a new, low - carbon economy x Such steel is required for mass transit systems, wind turbines and electric vehicles, among other things Arch’s Metallurgical Products are Essential Components for the Construction of a New Economy Source: Public information
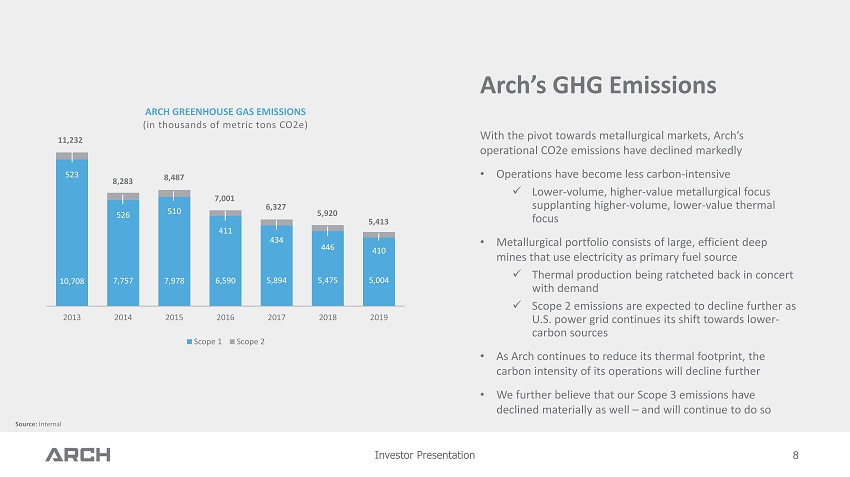
Investor Presentation 8 Arch’s GHG Emissions With the pivot towards metallurgical markets, Arch’s operational CO2e emissions have declined markedly • Operations have become less carbon - intensive x Lower - volume, higher - value metallurgical focus supplanting higher - volume, lower - value thermal focus • Metallurgical portfolio consists of large, efficient deep mines that use electricity as primary fuel source x Thermal production being ratcheted back in concert with demand x Scope 2 emissions are expected to decline further as U.S. power grid continues its shift towards lower - carbon sources • As Arch continues to reduce its thermal footprint, the carbon intensity of its operations will decline further • We further believe that our Scope 3 emissions have declined materially as well – and will continue to do so 10,708 7,757 7,978 6,590 5,894 5,475 5,004 523 526 510 411 434 446 410 2013 2014 2015 2016 2017 2018 2019 ARCH GREENHOUSE GAS EMISSIONS (in thousands of metric tons CO2e) Scope 1 Scope 2 5,413 5,920 6,327 7,001 8,487 8,283 11,232 Source: Internal
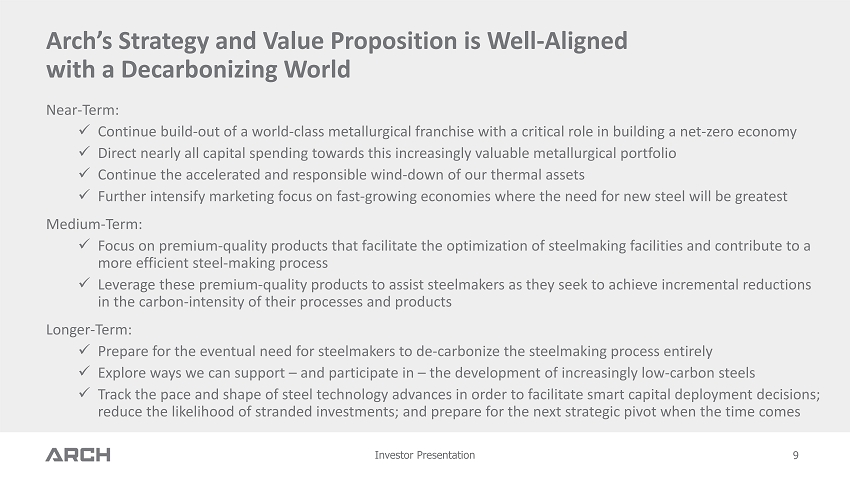
Investor Presentation Arch’s Strategy and Value Proposition is Well - Aligned with a Decarbonizing World Near - Term: x Continue build - out of a world - class metallurgical franchise with a critical role in building a net - zero economy x Direct nearly all capital spending towards this increasingly valuable metallurgical portfolio x Continue the accelerated and responsible wind - down of our thermal assets x Further intensify marketing focus on fast - growing economies where the need for new steel will be greatest Medium - Term: x Focus on premium - quality products that facilitate the optimization of steelmaking facilities and contribute to a more efficient steel - making process x Leverage these premium - quality products to assist steelmakers as they seek to achieve incremental reductions in the carbon - intensity of their processes and products Longer - Term : x Prepare for the eventual need for steelmakers to de - carbonize the steelmaking process entirely x Explore ways we can support – and participate in – the development of increasingly low - carbon steels x Track the pace and shape of steel technology advances in order to facilitate smart capital deployment decisions; reduce the likelihood of stranded investments; and prepare for the next strategic pivot when the time comes 9
Investor Presentation Arch’s Premier Metallurgical Franchise 10 METALLURGICAL
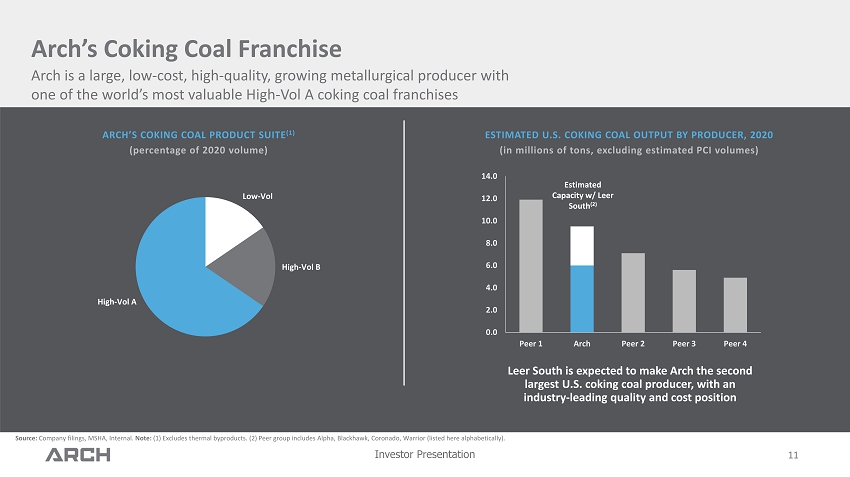
Investor Presentation 11 Arch’s Coking Coal Franchise 0.0 2.0 4.0 6.0 8.0 10.0 12.0 14.0 Peer 1 Arch Peer 2 Peer 3 Peer 4 Estimated Capacity w / Leer South (2) ESTIMATED U.S. COKING COAL OUTPUT BY PRODUCER, 2020 (in millions of tons, excluding estimated PCI volumes) Low - Vol High - Vol B High - Vol A ARCH’S COKING COAL PRODUCT SUITE (1) (percentage of 2020 volume) Arch is a large, low - cost, high - quality, growing metallurgical producer with one of the world’s most valuable High - Vol A coking coal franchises Leer South is expected to make Arch the second largest U.S. coking coal producer, with an industry - leading quality and cost position Source: Company filings, MSHA, Internal. Note: (1) Excludes thermal byproducts. (2) Peer group includes Alpha, Blackhawk, Coronado, Warrior (listed here alphabetically ).
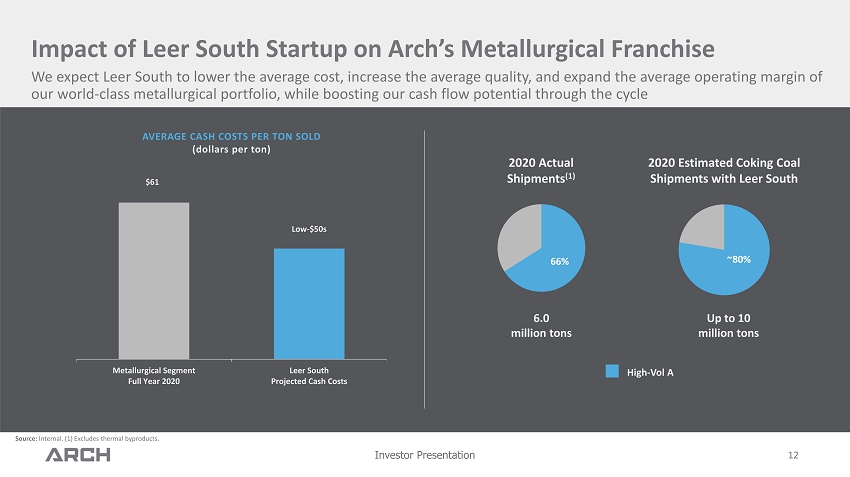
Investor Presentation 12 Impact of Leer South Startup on Arch’s Metallurgical Franchise $61 Low - $50s Metallurgical Segment Full Year 2020 Leer South Projected Cash Costs AVERAGE CASH COSTS PER TON SOLD (dollars per ton) 66% ~80% 2020 Actual Shipments (1) 2020 Estimated Coking Coal Shipments with Leer South 6.0 million tons Up to 10 million tons High - Vol A We expect Leer South to lower the average cost, increase the average quality, and expand the average operating margin of our world - class metallurgical portfolio, while boosting our cash flow potential through the cycle Source: Internal. (1) Excludes thermal byproducts.
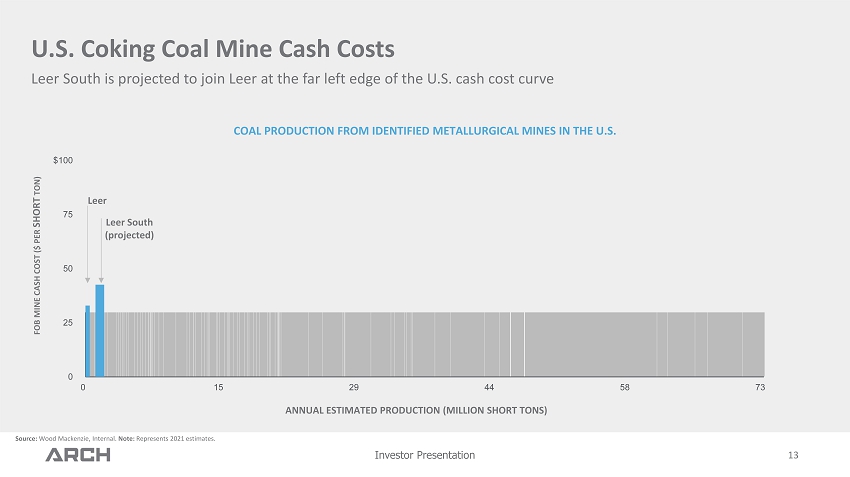
Investor Presentation 0 25 50 75 $100 0 15 29 44 58 73 13 U.S. Coking Coal Mine Cash Costs Leer South is projected to join Leer at the far left edge of the U.S. cash cost curve FOB MINE CASH COST ($ PER SHORT TON ) Leer Leer South (projected) COAL PRODUCTION FROM IDENTIFIED METALLURGICAL MINES IN THE U.S. ANNUAL ESTIMATED PRODUCTION (MILLION SHORT TONS) Source: Wood Mackenzie, Internal. Note: Represents 2021 estimates.

Investor Presentation Arch’s Market Reach Arch is penetrating new markets and expanding the global reach of its high - quality metallurgical product suite 14 ARCH’S 2020 MET SHIPMENTS (by geographic region) Arch has a highly strategic, 35% equity interest in Dominion Terminal Associates (DTA) in Newport News, VA, that facilitates shipments to Arch’s international customers Source: Internal and public information . Note: Map reflects Arch’s historical global customer base. 2% 8% 17% 22% 51% Africa Central and South America Asia North America Europe
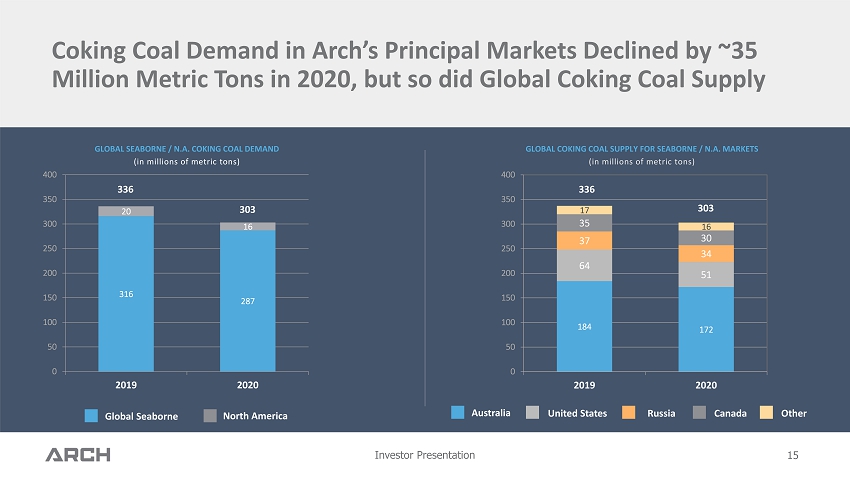
Investor Presentation 15 GLOBAL SEABORNE / N.A. COKING COAL DEMAND (in millions of metric tons) 316 287 20 16 0 50 100 150 200 250 300 350 400 2019 2020 184 172 64 51 37 34 35 30 17 16 0 50 100 150 200 250 300 350 400 2019 2020 GLOBAL COKING COAL SUPPLY FOR SEABORNE / N.A. MARKETS (in millions of metric tons) Global Seaborne North America Coking Coal D emand in Arch’s Principal M arkets D eclined by ~35 Million Metric T ons in 2020, but so d id Global Coking Coal Supply 336 303 303 Australia United States Russia Canada Other 336
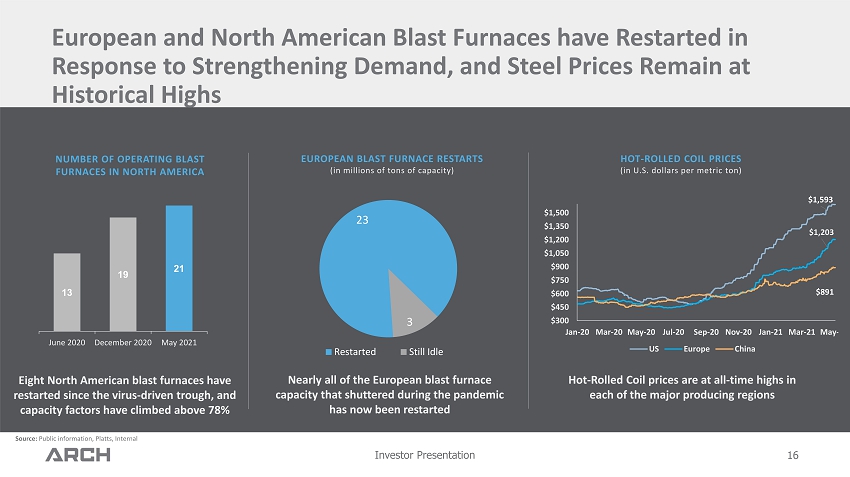
Investor Presentation 16 European and North American Blast Furnaces have Restarted in Response to Strengthening Demand, and Steel Prices Remain at Historical Highs NUMBER OF OPERATING BLAST FURNACES IN NORTH AMERICA 13 19 21 June 2020 December 2020 May 2021 23 3 Restarted Still Idle Eight North American blast furnaces have restarted since the virus - driven trough, and capacity factors have climbed above 78% Nearly all of the European blast furnace capacity that shuttered during the pandemic has now been restarted EUROPEAN BLAST FURNACE RESTARTS (in millions of tons of capacity) $1,593 $1,203 $891 $300 $450 $600 $750 $900 $1,050 $1,200 $1,350 $1,500 Jan-20 Mar-20 May-20 Jul-20 Sep-20 Nov-20 Jan-21 Mar-21 May-21 US Europe China HOT - ROLLED COIL PRICES (in U.S. dollars per metric ton) Hot - Rolled Coil prices are at all - time highs in each of the major producing regions Source: Public information, Platts, Internal
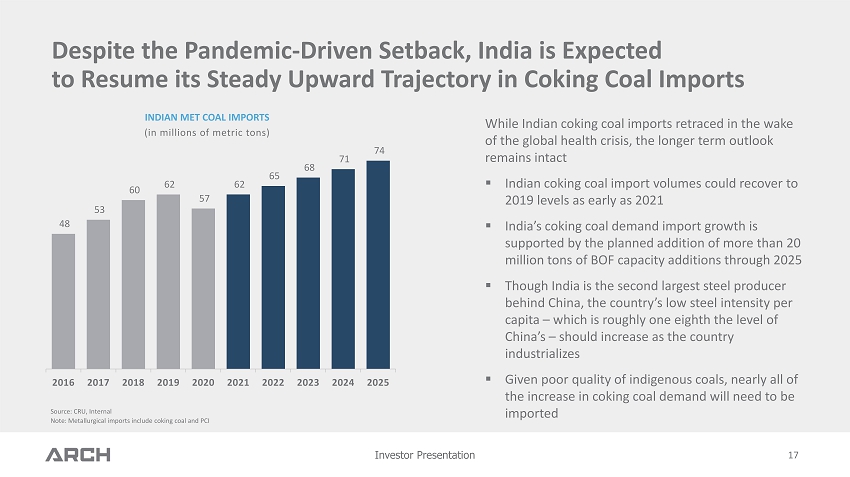
Investor Presentation 17 While Indian coking coal imports retraced in the wake of the global health crisis, the longer term outlook remains intact ▪ Indian coking coal import volumes could recover to 2019 levels as early as 2021 ▪ India’s coking coal demand import growth is supported by the planned addition of more than 20 million tons of BOF capacity additions through 2025 ▪ Though India is the second largest steel producer behind China, the country’s low steel intensity per capita – which is roughly one eighth the level of China’s – should increase as the country industrializes ▪ Given poor quality of indigenous coals, nearly all of the increase in coking coal demand will need to be imported INDIAN MET COAL IMPORTS (in millions of metric tons) Source: CRU , Internal Note: Metallurgical imports include coking coal and PCI 48 53 60 62 57 62 65 68 71 74 2016 2017 2018 2019 2020 2021 2022 2023 2024 2025 Despite the Pandemic - Driven Setback, India is Expected to Resume its Steady U pward T rajectory in Coking C oal I mports
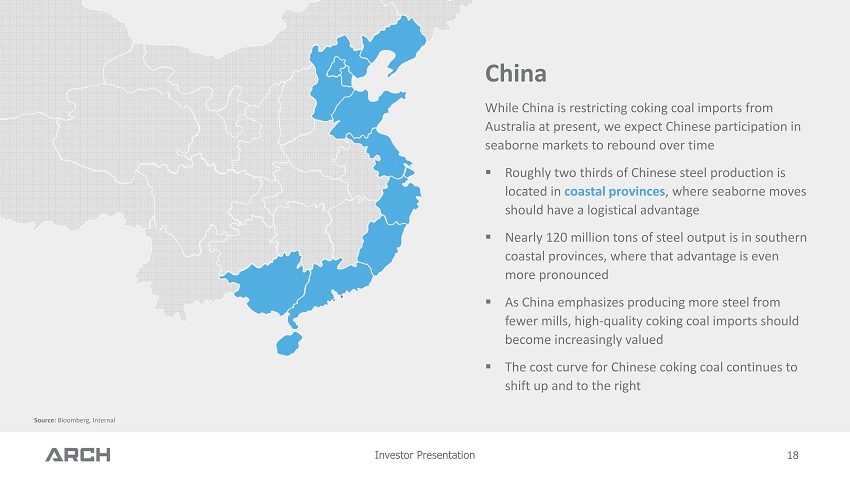
Investor Presentation China While China is restricting coking coal imports from Australia at present, we expect Chinese participation in seaborne markets to rebound over time ▪ Roughly two thirds of Chinese steel production is located in coastal provinces , where seaborne moves should have a logistical advantage ▪ Nearly 120 million tons of steel output is in southern coastal provinces, where that advantage is even more pronounced ▪ As China emphasizes producing more steel from fewer mills, high - quality coking coal imports should become increasingly valued ▪ The cost curve for Chinese coking coal continues to shift up and to the right 18 Source: Bloomberg, Internal
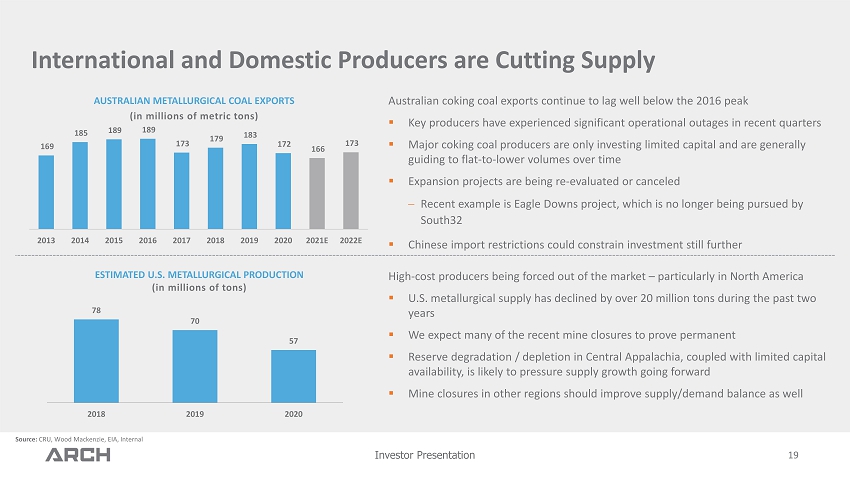
Investor Presentation 19 Australian coking coal exports continue to lag well below the 2016 peak ▪ Key producers have experienced significant operational outages in recent quarters ▪ Major coking coal producers are only investing limited capital and are generally guiding to flat - to - lower volumes over time ▪ Expansion projects are being re - evaluated or canceled Recent example is Eagle Downs project, which is no longer being pursued by South32 Chinese import restrictions could constrain investment still further AUSTRALIAN METALLURGICAL COAL EXPORTS (in millions of metric tons) International and Domestic Producers are Cutting Supply 78 70 57 2018 2019 2020 ESTIMATED U.S . METALLURGICAL PRODUCTION ( in millions of tons) Source: CRU, Wood Mackenzie, EIA, Internal 169 185 189 189 173 179 183 172 166 173 2013 2014 2015 2016 2017 2018 2019 2020 2021E 2022E High - cost producers being forced out of the market – particularly in North America ▪ U.S . metallurgical supply has declined by over 20 million tons during the past two years ▪ We expect many of the recent mine closures to prove permanent ▪ R eserve degradation / depletion in Central Appalachia, coupled with limited capital availability, is likely to pressure supply growth going forward ▪ Mine closures in other regions should improve supply/demand balance as well
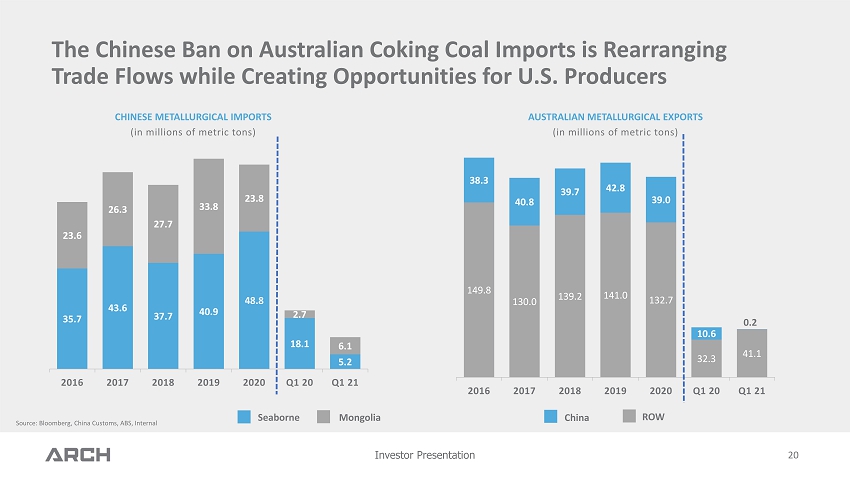
Investor Presentation 20 CHINESE METALLURGICAL IMPORTS (in millions of metric tons) Source: Bloomberg, China Customs, ABS, Internal 35.7 43.6 37.7 40.9 48.8 18.1 5.2 23.6 26.3 27.7 33.8 23.8 2.7 6.1 2016 2017 2018 2019 2020 Q1 20 Q1 21 The Chinese Ban on Australian Coking Coal Imports is Rearranging Trade Flows while Creating Opportunities for U.S. Producers Seaborne Mongolia AUSTRALIAN METALLURGICAL EXPORTS (in millions of metric tons) 149.8 130.0 139.2 141.0 132.7 32.3 41.1 38.3 40.8 39.7 42.8 39.0 10.6 0.2 2016 2017 2018 2019 2020 Q1 20 Q1 21 China ROW
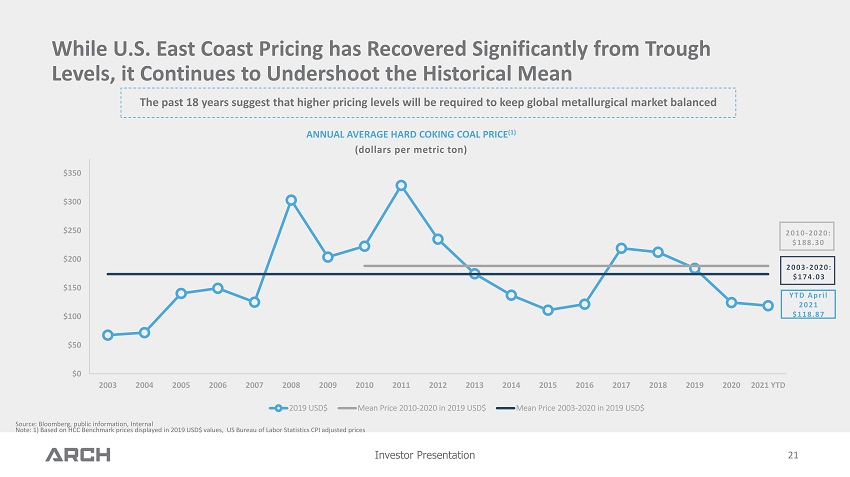
Investor Presentation 21 YTD April 2021 $ 118.87 2010 - 2020 : $188.30 ANNUAL AVERAGE HARD COKING COAL PRICE (1) (dollars per metric ton) Source: Bloomberg, public information, Internal Note: 1) Based on HCC Benchmark prices displayed in 2019 USD$ values, US Bureau of Labor Statistics CPI adjusted prices 2003 - 2020 : $174.03 $0 $50 $100 $150 $200 $250 $300 $350 2003 2004 2005 2006 2007 2008 2009 2010 2011 2012 2013 2014 2015 2016 2017 2018 2019 2020 2021 YTD 2019 USD$ Mean Price 2010-2020 in 2019 USD$ Mean Price 2003-2020 in 2019 USD$ While U.S. East Coast Pricing has Recovered S ignificantly from Trough L evels, it C ontinues to Undershoot the Historical Mean T he past 18 years suggest that higher pricing levels will be required to keep global metallurgical market balanced
Investor Presentation Arch’s Legacy Thermal Franchise 22 THERMAL
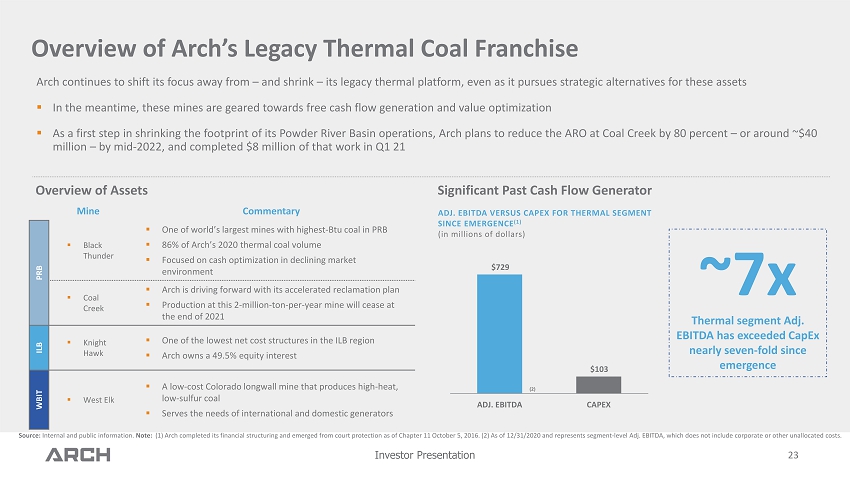
Investor Presentation Arch continues to shift its focus away from – and shrink – its legacy thermal platform, even as it pursues strategic alternatives for these assets ▪ In the meantime, these mines are geared towards free cash flow generation and value optimization ▪ As a first step in shrinking the footprint of its Powder River Basin operations, Arch plans to reduce the ARO at Coal Creek b y 8 0 percent – or around ~$40 million – by mid - 2022, and completed $8 million of that work in Q1 21 23 Overview of Arch’s Legacy Thermal Coal Franchise ADJ. EBITDA VERSUS CAPEX FOR THERMAL SEGMENT SINCE EMERGENCE (1) (in millions of dollars) $ 729 $103 ADJ. EBITDA CAPEX ~7x Thermal segment Adj. EBITDA has exceeded CapEx nearly seven - fold since emergence (2) Overview of Assets Significant Past Cash Flow Generator Mine Commentary PRB ▪ Black Thunder ▪ One of world’s largest mines with highest - Btu coal in PRB ▪ 86% of Arch’s 2020 thermal coal volume ▪ Focused on cash optimization in declining market environment ▪ Coal Creek ▪ Arch is driving forward with its accelerated reclamation plan ▪ Production at this 2 - million - ton - per - year mine will cease at the end of 2021 ILB ▪ Knight Hawk ▪ One of the lowest net cost structures in the ILB region ▪ Arch owns a 49.5% equity interest WBIT ▪ West Elk ▪ A low - cost Colorado longwall mine that produces high - heat, low - sulfur coal ▪ Serves the needs of international and domestic generators Source: Internal and public information. Note: (1) Arch completed its financial structuring and emerged from court protection as of Chapter 11 October 5, 2016. (2) As of 12/31/2020 and represents segment - level Adj . EBITDA, which does not include corporate or other unallocated costs.
Investor Presentation Financial Overview 24 FINANCE
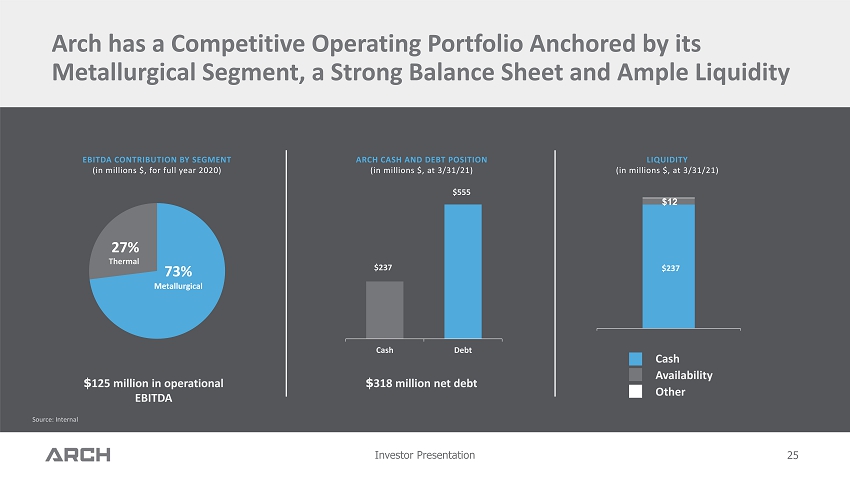
Investor Presentation $237 $ 12 $237 $555 Cash Debt 25 EBITDA CONTRIBUTION BY SEGMENT (in millions $, for full year 2020) ARCH CASH AND DEBT POSITION (in millions $, at 3/31/21) LIQUIDITY (in millions $, at 3/31/21) 73% Metallurgical 27% Thermal $ 125 million in operational EBITDA $ 318 million net debt Cash Availability Other Source: Internal Arch has a C ompetitive O perating P ortfolio A nchored by its Metallurgical S egment , a Strong B alance S heet and Ample L iquidity
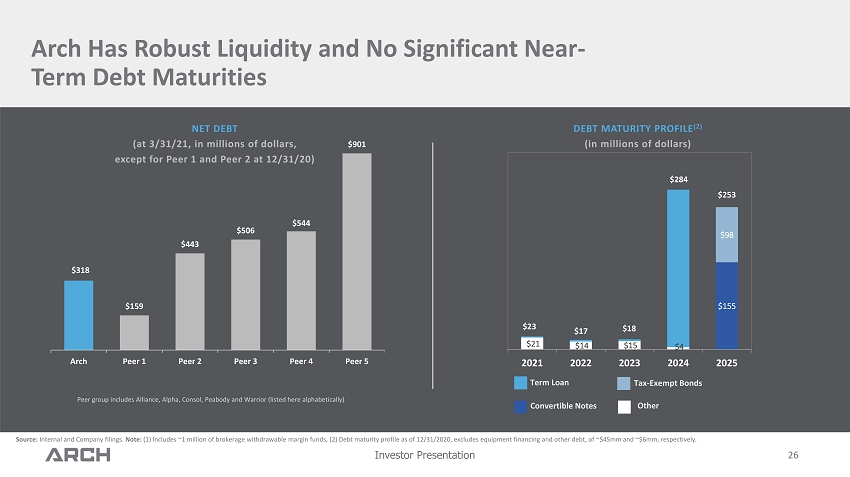
Investor Presentation 26 Arch Has Robust Liquidity and No Significant Near - Term Debt Maturities DEBT MATURITY PROFILE (2) (in millions of dollars) Source: Internal and Company filings. Note : ( 1 ) Includes ~1 million of brokerage withdrawable margin funds, (2) Debt maturity profile as of 12/31/2020, excludes equipment financing and other debt, of ~$45mm and ~$6mm, respectively . $318 $159 $443 $506 $544 $901 Arch Peer 1 Peer 2 Peer 3 Peer 4 Peer 5 Peer group includes Alliance, Alpha, Consol, Peabody and Warrior (listed here alphabetically) NET DEBT (at 3/31/21, in millions of dollars, except for Peer 1 and Peer 2 at 12/31/20) Term Loan Tax - Exempt Bonds Convertible Notes Other $155 $98 $21 $14 $15 $4 2021 2022 2023 2024 2025 $ 23 $ 17 $ 253 $ 284 $ 18
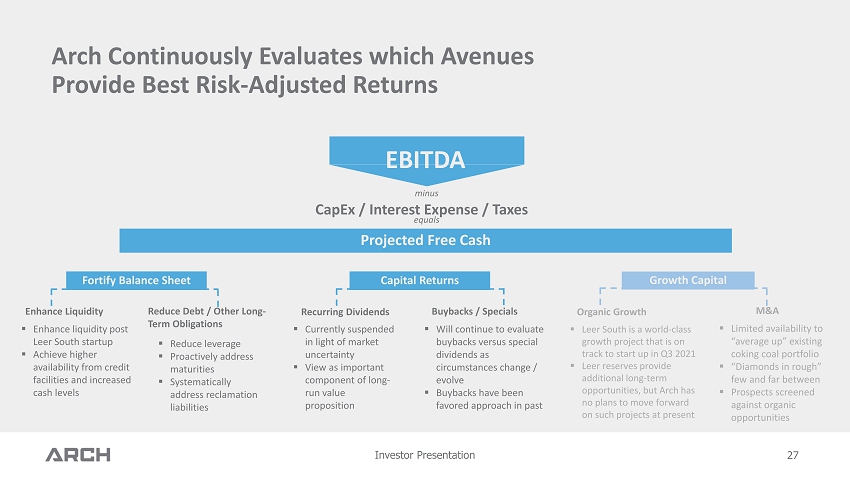
Investor Presentation Projected Free Cash Growth Capital Capital Returns EBITDA Arch Continuously E valuates which Avenues Provide B est Risk - Adjusted R eturns 27 CapEx / Interest Expense / Taxes Organic Growth M&A Buybacks / Specials Recurring Dividends ▪ Will continue to evaluate buybacks versus special dividends as circumstances change / evolve ▪ Buybacks have been favored approach in past ▪ Currently suspended in light of market uncertainty ▪ View as important component of long - run value proposition ▪ Leer South is a world - class growth project that is on track to start up in Q3 2021 ▪ Leer reserves provide additional long - term opportunities, but Arch has no plans to move forward on such projects at present ▪ Limited availability to “average up” existing coking coal portfolio ▪ “Diamonds in rough” few and far between ▪ Prospects screened against organic opportunities minus equals Enhance Liquidity Reduce Debt / Other Long - Term Obligations ▪ Enhance liquidity post Leer South startup ▪ Achieve higher availability from credit facilities and increased cash levels ▪ Reduce leverage ▪ Proactively address maturities ▪ Systematically address reclamation liabilities Fortify Balance Sheet
Investor Presentation Reconciliation of Non - GAAP Measures 28 APPENDIX
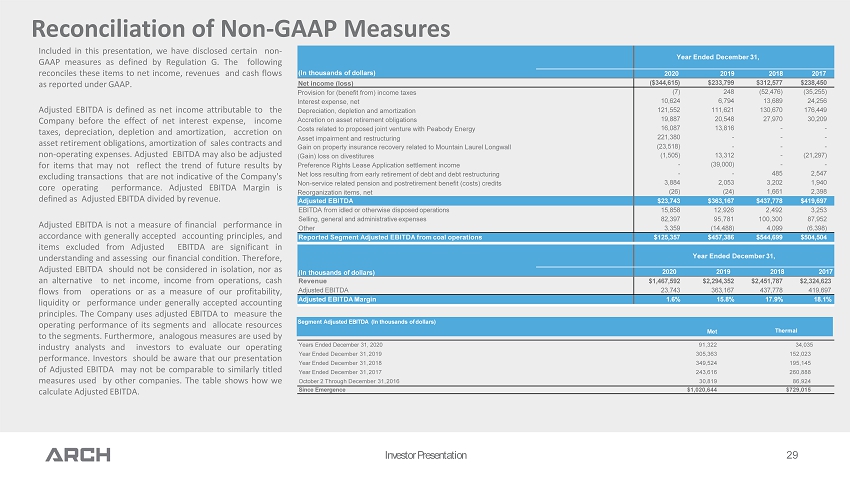
Reconciliation of Non - GAAP Measures Investor Presentation 29 Included in this presentation, we have disclosed certain non - GAAP measures as defined by Regulation G . The following reconciles these items to net income, revenues and cash flows as reported under GAAP . Adjusted EBITDA is defined as net income attributable to the Company before the effect of net interest expense, income taxes, depreciation, depletion and amortization, accretion on asset retirement obligations, amortization of sales contracts and non - operating expenses . Adjusted EBITDA may also be adjusted for items that may not reflect the trend of future results by excluding transactions that are not indicative of the Company's core operating performance . Adjusted EBITDA Margin is defined as Adjusted EBITDA divided by revenue . Adjusted EBITDA is not a measure of financial performance in accordance with generally accepted accounting principles, and items excluded from Adjusted EBITDA are significant in understanding and assessing our financial condition . Therefore, Adjusted EBITDA should not be considered in isolation, nor as an alternative to net income, income from operations, cash flows from operations or as a measure of our profitability, liquidity or performance under generally accepted accounting principles . The Company uses adjusted EBITDA to measure the operating performance of its segments and allocate resources to the segments . Furthermore, analogous measures are used by industry analysts and investors to evaluate our operating performance . Investors should be aware that our presentation of Adjusted EBITDA may not be comparable to similarly titled measures used by other companies . The table shows how we calculate Adjusted EBITDA . (In thousands of dollars) Year Ended December 31, 2020 2019 2018 2017 Net income (loss) ( $ 344,615 ) $ 233,799 $ 312,577 $ 238,450 Provision for (benefit from) income taxes (7) 248 (52,476) (35,255) Interest expense, net 10,624 6,794 13,689 24,256 Depreciation, depletion and amortization 121,552 111,621 130,670 176,449 Accretion on asset retirement obligations 19,887 20,548 27,970 30,209 Costs related to proposed joint venture with Peabody Energy 16,087 13,816 - - Asset impairment and restructuring 221,380 - - - Gain on property insurance recovery related to Mountain Laurel Longwall (23,518) - - - (Gain) loss on divestitures (1,505) 13,312 - (21,297) Preference Rights Lease Application settlement income - (39,000) - - Net loss resulting from early retirement of debt and debt restructuring - - 485 2,547 Non - service related pension and postretirement benefit (costs) credits 3,884 2,053 3,202 1,940 Reorganization items, net (26) (24) 1,661 2,398 Adjusted EBITDA $ 23,743 $ 363,167 $ 437,778 $ 419,697 EBITDA from idled or otherwise disposed operations 1 5,858 12,926 2,492 3,253 Selling, general and administrative expenses 82,397 95,781 100,300 87,952 Other 3,359 (14,488) 4,099 (6,398) Reported Segment Adjusted EBITDA from coal operations $ 125,357 $ 457,386 $ 544,699 $ 504,504 (In thousands of dollars) Year Ended December 31, 2020 2019 2018 2017 Revenue $ 1,467,592 $2 , 294 , 35 2 $2 , 451 , 78 7 $2 , 324 , 62 3 Adjusted EBITDA 23,743 363 , 16 7 437 , 77 8 419 , 69 7 Adjusted EBITDA Margin 1 .6 % 15 . 8 % 17 . 9 % 18 . 1 % Years Ended December 31, 2020 91,322 34,035 Year Ended December 31, 2019 305 , 36 3 152,023 Year Ended December 31, 2018 349 , 52 4 195,145 Year Ended December 31, 2017 243 , 61 6 260,888 October 2 Through December 31, 2016 30 , 81 9 86,924 Since Emergence $ 1,020,644 $ 729,015 Segment Adjusted EBITDA (In thousands of dollars) M e t Th erma l
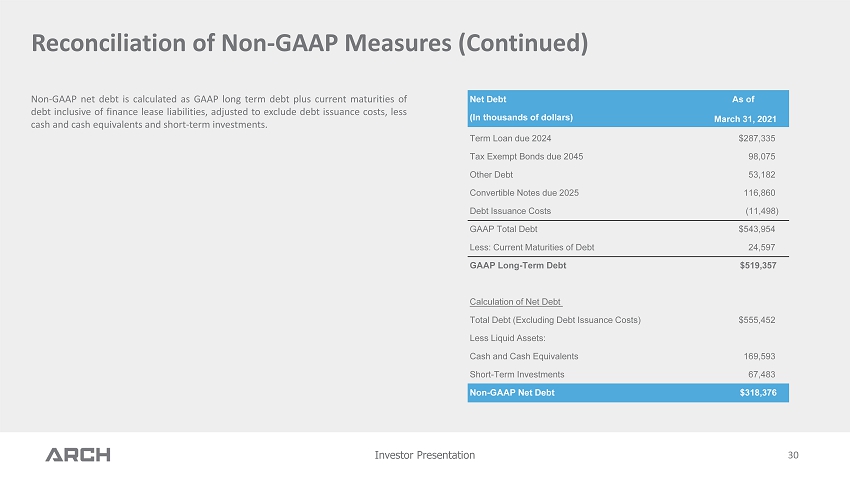
Investor Presentation Reconciliation of Non - GAAP Measures (Continued) 30 Non - GAAP net debt is calculated as GAAP long term debt plus current maturities of debt inclusive of finance lease liabilities, adjusted to exclude debt issuance costs, less cash and cash equivalents and short - term investments . Net Debt As of (In thousands of dollars) March 31, 2021 Term Loan due 2024 $287,335 Tax Exempt Bonds due 2045 98,075 Other Debt 53,182 Convertible Notes due 2025 116,860 Debt Issuance Costs (11,498) GAAP Total Debt $543,954 Less: Current Maturities of Debt 24,597 GAAP Long - Term Debt $519,357 Calculation of Net Debt Total Debt (Excluding Debt Issuance Costs) $555,452 Less Liquid Assets: Cash and Cash Equivalents 169,593 Short - Term Investments 67,483 Non - GAAP Net Debt $318,376