Attached files
| file | filename |
|---|---|
| 8-K/A - 8-K/A - HollyFrontier Corp | d314731d8ka.htm |
Exhibit 99.2
Disclosure Statement Statements made during the course of this presentation that are not historical facts are “forward-looking statements” within the meaning of the U.S. Private Securities Litigation Reform Act of 1995. Words such as “anticipate,” “project,” “expect,” “plan,” “goal,” “forecast,” “intend,” “should,” “would,” “could,” “believe,” “may,” and similar expressions and statements regarding our plans and objectives for future operations are intended to identify forward-looking statements. Forward-looking statements are inherently uncertain and necessarily involve risks that may affect the business prospects and performance of HollyFrontier Corporation and/or Holly Energy Partners, L.P., and actual results may differ materially from those discussed during the presentation. These statements are based on management’s beliefs and assumptions using currently available information and expectations as of the date thereof, are not guarantees of future performance and involve certain risks and uncertainties. All statements concerning HollyFrontier’s expectations for future results of operations are based on forecasts for our existing operations. Although we believe that the expectations reflected in these forward-looking statements are reasonable, we cannot assure you that our expectations will prove to be correct. Therefore, actual outcomes and results could materially differ from what is expressed, implied or forecast in these statements. Any differences could be caused by a number of factors including, but are not limited to the Company’s failure to successfully close the transaction with Shell, or, once closed, integrate the operation of the Puget Sound Refinery with its existing operations; the extraordinary market environment and effects of the COVID-19 pandemic, including a significant decline in demand for refined petroleum products in the markets we serve, risks and uncertainties with respect to the actions of actual or potential competitive suppliers and transporters of refined petroleum or lubricant and specialty products in HollyFrontier’s and Holly Energy Partners’ markets, the spread between market prices for refined products and market prices for crude oil, the possibility of constraints on the transportation of refined products or lubricant and specialty products, the possibility of inefficiencies, curtailments or shutdowns in refinery operations or pipelines, whether due to infection in the work force or in response to reductions in demand, effects of current and future governmental and environmental regulations and policies, including the effects of current and future restrictions on various commercial and economic activities in response to the COVID-19 pandemic, the availability and cost of financing to HollyFrontier and Holly Energy Partners, the effectiveness of HollyFrontier’s and Holly Energy Partners’ capital investments and marketing strategies, HollyFrontier's and Holly Energy Partners’ efficiency in carrying out and consummating construction projects, including HollyFrontier’s and Holly Energy Partners’ ability to complete announced construction projects, such as HollyFrontier’s conversion of the Cheyenne Refinery to a renewable diesel facility and HollyFrontier’s construction of the Artesia renewable diesel unit and pre-treatment unit, on time and on budget, HollyFrontier’s and Holly Energy Partners’ ability to timely obtain or maintain permits, including those necessary for operations or capital projects, HollyFrontier's ability to acquire refined or lubricant product operations or pipeline and terminal operations on acceptable terms and to integrate any existing or future acquired operations, the possibility of terrorist or cyber attacks and the consequences of any such attacks, general economic conditions, including uncertainty regarding the timing, pace and extent of economic recovery in the United States and continued deterioration in gross margins or a prolonged economic slowdown due to the COVID-19 pandemic, which could result in an impairment of goodwill and/or additional long-lived asset impartments. Additional information on risks and uncertainties that could affect the business prospects and performance of HollyFrontier and Holly Energy Partners is provided in the most recent reports of HollyFrontier and Holly Energy Partners filed with the Securities and Exchange Commission. All forward-looking statements included in this presentation are expressly qualified in their entirety by the foregoing cautionary statements. The forward-looking statements speak only as of the date made and, other than as required by law, HollyFrontier and Holly Energy Partners undertake no obligation to publicly update or revise any forward-looking statements, whether as a result of new information, future events or otherwise.
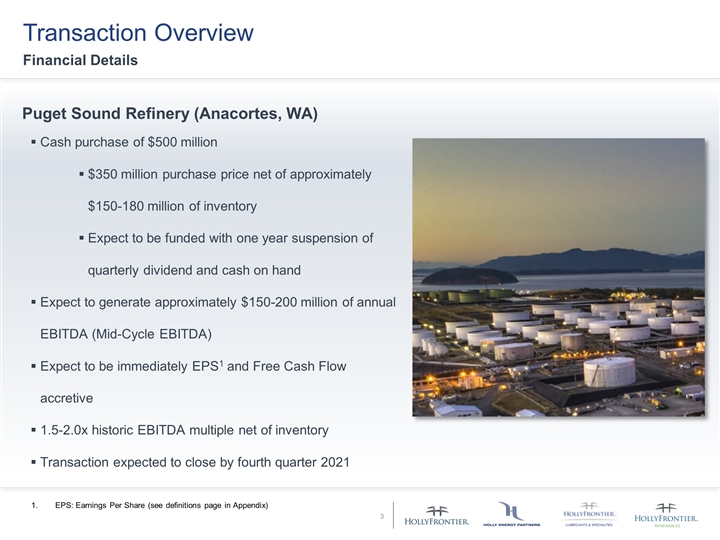
Transaction Overview Financial Details Puget Sound Refinery (Anacortes, WA) Cash purchase of $500 million $350 million purchase price net of approximately $150-180 million of inventory Expect to be funded with one year suspension of quarterly dividend and cash on hand Expect to generate approximately $150-200 million of annual EBITDA (Mid-Cycle EBITDA) Expect to be immediately EPS1 and Free Cash Flow accretive 1.5-2.0x historic EBITDA multiple net of inventory Transaction expected to close by fourth quarter 2021 EPS: Earnings Per Share (see definitions page in Appendix)
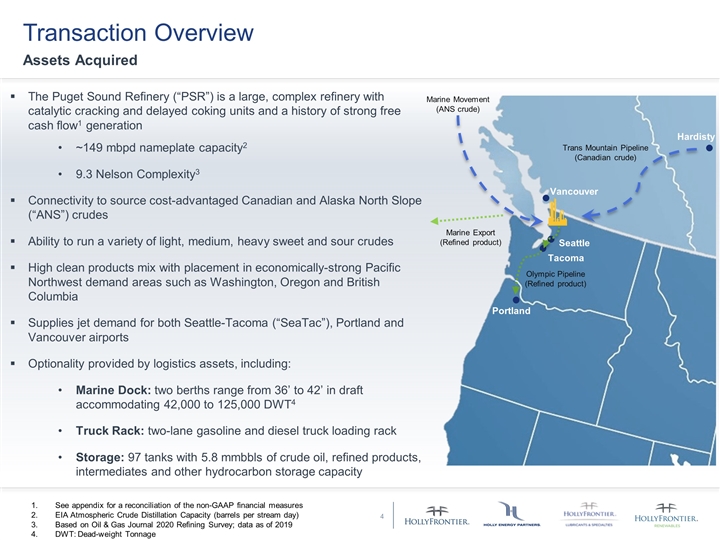
Transaction Overview Assets Acquired The Puget Sound Refinery (“PSR”) is a large, complex refinery with catalytic cracking and delayed coking units and a history of strong free cash flow1 generation ~149 mbpd nameplate capacity2 9.3 Nelson Complexity3 Connectivity to source cost-advantaged Canadian and Alaska North Slope (“ANS”) crudes Ability to run a variety of light, medium, heavy sweet and sour crudes High clean products mix with placement in economically-strong Pacific Northwest demand areas such as Washington, Oregon and British Columbia Supplies jet demand for both Seattle-Tacoma (“SeaTac”), Portland and Vancouver airports Optionality provided by logistics assets, including: Marine Dock: two berths range from 36’ to 42’ in draft accommodating 42,000 to 125,000 DWT4 Truck Rack: two-lane gasoline and diesel truck loading rack Storage: 97 tanks with 5.8 mmbbls of crude oil, refined products, intermediates and other hydrocarbon storage capacity Seattle Tacoma Portland Vancouver Hardisty Marine Movement (ANS crude) Trans Mountain Pipeline (Canadian crude) Olympic Pipeline (Refined product) Marine Export (Refined product) See appendix for a reconciliation of the non-GAAP financial measures EIA Atmospheric Crude Distillation Capacity (barrels per stream day) Based on Oil & Gas Journal 2020 Refining Survey; data as of 2019 DWT: Dead-weight Tonnage
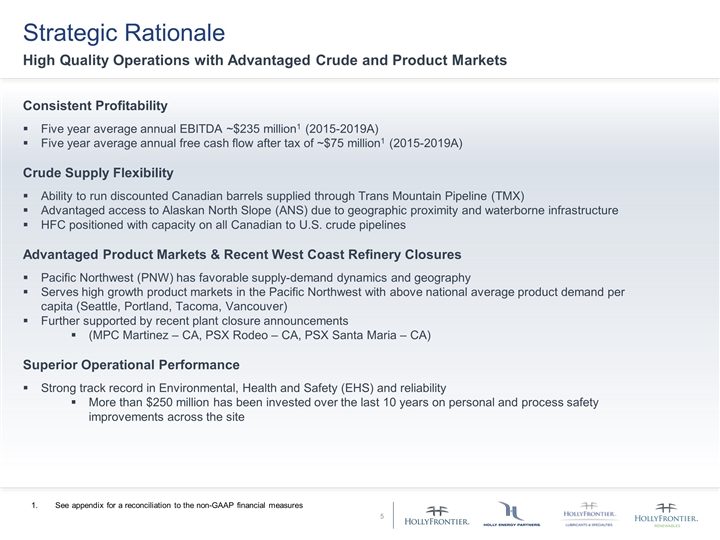
Strategic Rationale High Quality Operations with Advantaged Crude and Product Markets Consistent Profitability Five year average annual EBITDA ~$235 million1 (2015-2019A) Five year average annual free cash flow after tax of ~$75 million1 (2015-2019A) Crude Supply Flexibility Ability to run discounted Canadian barrels supplied through Trans Mountain Pipeline (TMX) Advantaged access to Alaskan North Slope (ANS) due to geographic proximity and waterborne infrastructure HFC positioned with capacity on all Canadian to U.S. crude pipelines Advantaged Product Markets & Recent West Coast Refinery Closures Pacific Northwest (PNW) has favorable supply-demand dynamics and geography Serves high growth product markets in the Pacific Northwest with above national average product demand per capita (Seattle, Portland, Tacoma, Vancouver) Further supported by recent plant closure announcements (MPC Martinez – CA, PSX Rodeo – CA, PSX Santa Maria – CA) Superior Operational Performance Strong track record in Environmental, Health and Safety (EHS) and reliability More than $250 million has been invested over the last 10 years on personal and process safety improvements across the site See appendix for a reconciliation to the non-GAAP financial measures
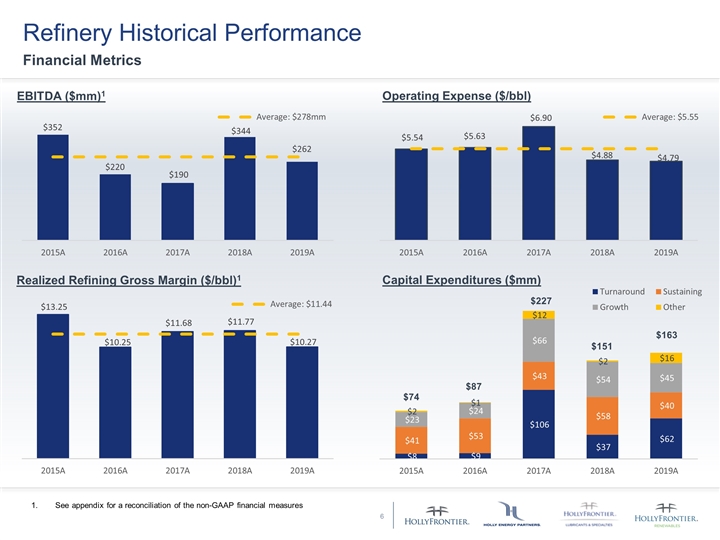
Refinery Historical Performance Financial Metrics EBITDA ($mm)1 Operating Expense ($/bbl) Capital Expenditures ($mm) Realized Refining Gross Margin ($/bbl)1 $74 $87 $227 $151 $163 See appendix for a reconciliation of the non-GAAP financial measures
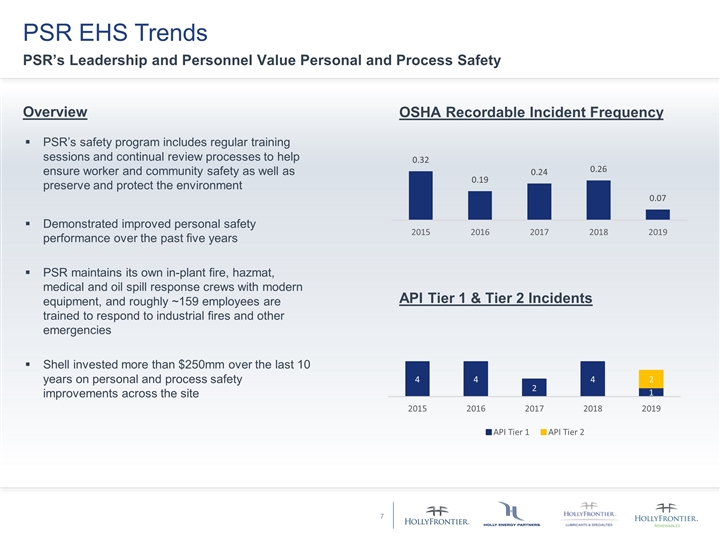
PSR EHS Trends PSR’s Leadership and Personnel Value Personal and Process Safety PSR’s safety program includes regular training sessions and continual review processes to help ensure worker and community safety as well as preserve and protect the environment Demonstrated improved personal safety performance over the past five years PSR maintains its own in-plant fire, hazmat, medical and oil spill response crews with modern equipment, and roughly ~159 employees are trained to respond to industrial fires and other emergencies Shell invested more than $250mm over the last 10 years on personal and process safety improvements across the site OSHA Recordable Incident Frequency Overview API Tier 1 & Tier 2 Incidents
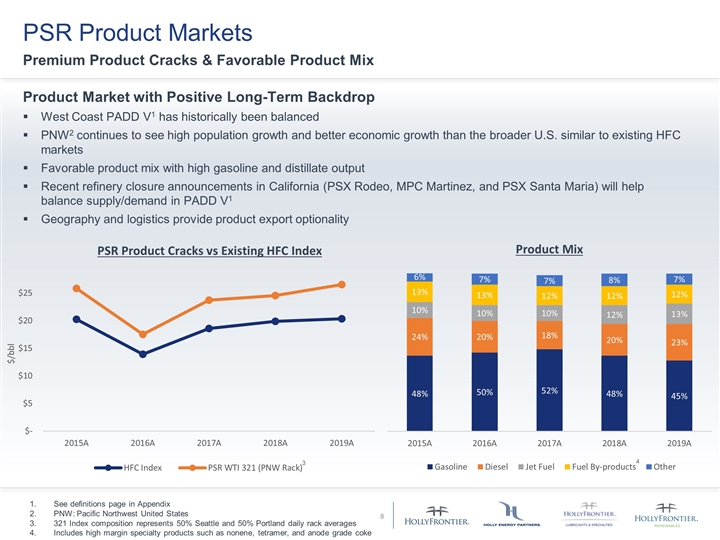
PSR Product Markets Premium Product Cracks & Favorable Product Mix Product Market with Positive Long-Term Backdrop West Coast PADD V1 has historically been balanced PNW2 continues to see high population growth and better economic growth than the broader U.S. similar to existing HFC markets Favorable product mix with high gasoline and distillate output Recent refinery closure announcements in California (PSX Rodeo, MPC Martinez, and PSX Santa Maria) will help balance supply/demand in PADD V1 Geography and logistics provide product export optionality 3 4 See definitions page in Appendix PNW: Pacific Northwest United States 321 Index composition represents 50% Seattle and 50% Portland daily rack averages Includes high margin specialty products such as nonene, tetramer, and anode grade coke
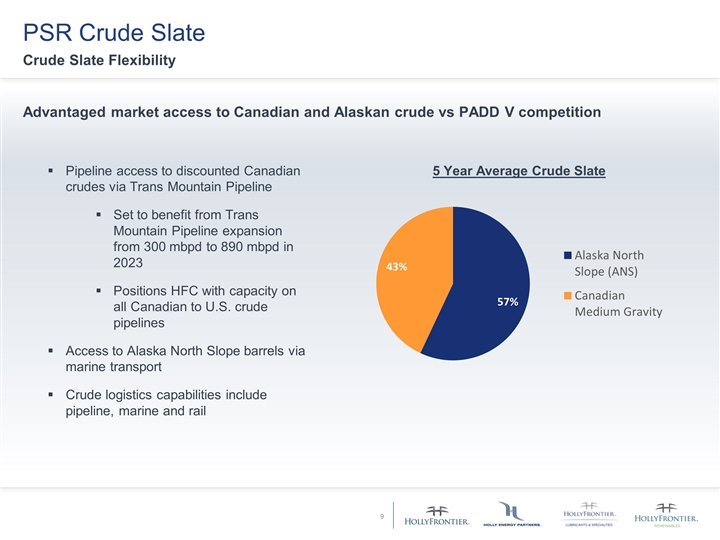
PSR Crude Slate Crude Slate Flexibility Advantaged market access to Canadian and Alaskan crude vs PADD V competition 5 Year Average Crude Slate Pipeline access to discounted Canadian crudes via Trans Mountain Pipeline Set to benefit from Trans Mountain Pipeline expansion from 300 mbpd to 890 mbpd in 2023 Positions HFC with capacity on all Canadian to U.S. crude pipelines Access to Alaska North Slope barrels via marine transport Crude logistics capabilities include pipeline, marine and rail
Appendix
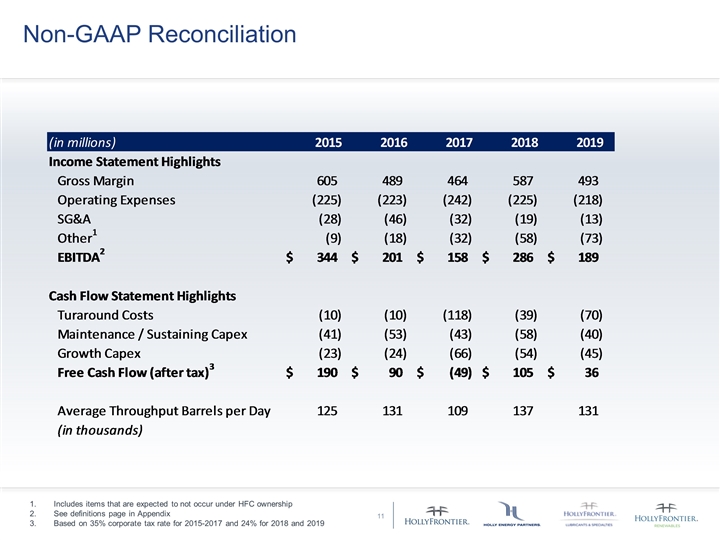
Non-GAAP Reconciliation Includes items that are expected to not occur under HFC ownership See definitions page in Appendix Based on 35% corporate tax rate for 2015-2017 and 24% for 2018 and 2019
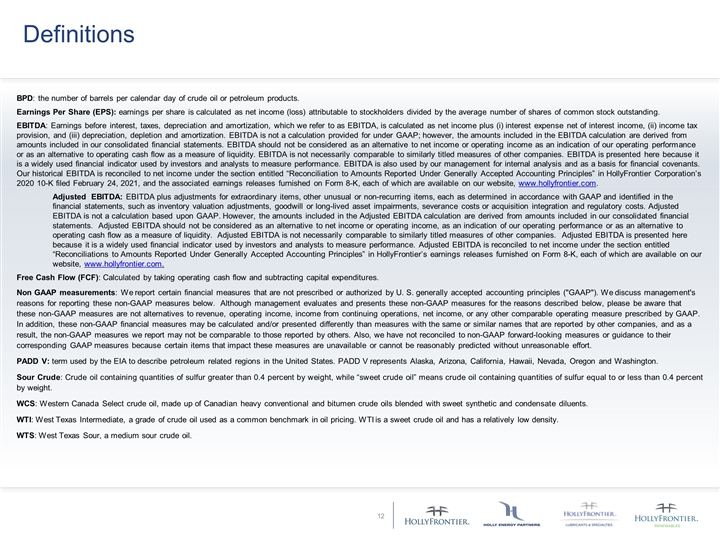
BPD: the number of barrels per calendar day of crude oil or petroleum products. Earnings Per Share (EPS): earnings per share is calculated as net income (loss) attributable to stockholders divided by the average number of shares of common stock outstanding. EBITDA: Earnings before interest, taxes, depreciation and amortization, which we refer to as EBITDA, is calculated as net income plus (i) interest expense net of interest income, (ii) income tax provision, and (iii) depreciation, depletion and amortization. EBITDA is not a calculation provided for under GAAP; however, the amounts included in the EBITDA calculation are derived from amounts included in our consolidated financial statements. EBITDA should not be considered as an alternative to net income or operating income as an indication of our operating performance or as an alternative to operating cash flow as a measure of liquidity. EBITDA is not necessarily comparable to similarly titled measures of other companies. EBITDA is presented here because it is a widely used financial indicator used by investors and analysts to measure performance. EBITDA is also used by our management for internal analysis and as a basis for financial covenants. Our historical EBITDA is reconciled to net income under the section entitled “Reconciliation to Amounts Reported Under Generally Accepted Accounting Principles” in HollyFrontier Corporation’s 2020 10-K filed February 24, 2021, and the associated earnings releases furnished on Form 8-K, each of which are available on our website, www.hollyfrontier.com. Adjusted EBITDA: EBITDA plus adjustments for extraordinary items, other unusual or non-recurring items, each as determined in accordance with GAAP and identified in the financial statements, such as inventory valuation adjustments, goodwill or long-lived asset impairments, severance costs or acquisition integration and regulatory costs. Adjusted EBITDA is not a calculation based upon GAAP. However, the amounts included in the Adjusted EBITDA calculation are derived from amounts included in our consolidated financial statements. Adjusted EBITDA should not be considered as an alternative to net income or operating income, as an indication of our operating performance or as an alternative to operating cash flow as a measure of liquidity. Adjusted EBITDA is not necessarily comparable to similarly titled measures of other companies. Adjusted EBITDA is presented here because it is a widely used financial indicator used by investors and analysts to measure performance. Adjusted EBITDA is reconciled to net income under the section entitled “Reconciliations to Amounts Reported Under Generally Accepted Accounting Principles” in HollyFrontier’s earnings releases furnished on Form 8-K, each of which are available on our website, www.hollyfrontier.com. Free Cash Flow (FCF): Calculated by taking operating cash flow and subtracting capital expenditures. Non GAAP measurements: We report certain financial measures that are not prescribed or authorized by U. S. generally accepted accounting principles ("GAAP"). We discuss management's reasons for reporting these non-GAAP measures below. Although management evaluates and presents these non-GAAP measures for the reasons described below, please be aware that these non-GAAP measures are not alternatives to revenue, operating income, income from continuing operations, net income, or any other comparable operating measure prescribed by GAAP. In addition, these non-GAAP financial measures may be calculated and/or presented differently than measures with the same or similar names that are reported by other companies, and as a result, the non-GAAP measures we report may not be comparable to those reported by others. Also, we have not reconciled to non-GAAP forward-looking measures or guidance to their corresponding GAAP measures because certain items that impact these measures are unavailable or cannot be reasonably predicted without unreasonable effort. PADD V: term used by the EIA to describe petroleum related regions in the United States. PADD V represents Alaska, Arizona, California, Hawaii, Nevada, Oregon and Washington. Sour Crude: Crude oil containing quantities of sulfur greater than 0.4 percent by weight, while “sweet crude oil” means crude oil containing quantities of sulfur equal to or less than 0.4 percent by weight. WCS: Western Canada Select crude oil, made up of Canadian heavy conventional and bitumen crude oils blended with sweet synthetic and condensate diluents. WTI: West Texas Intermediate, a grade of crude oil used as a common benchmark in oil pricing. WTI is a sweet crude oil and has a relatively low density. WTS: West Texas Sour, a medium sour crude oil. Definitions

HollyFrontier Corporation (NYSE: HFC) 2828 N. Harwood, Suite 1300 Dallas, Texas 75201 (214) 954-6510 www.hollyfrontier.com Craig Biery | Vice President, Investor Relations investors@hollyfrontier.com 214-954-6510 Trey Schonter | Investor Relations investors@hollyfrontier.com 214-954-6510
