Attached files
| file | filename |
|---|---|
| 8-K - 8-K - Fastly, Inc. | fsly-20210505.htm |
| EX-99.2 - EX-99.2 - Fastly, Inc. | ex992-fslypressrelease33121.htm |
Exhibit 99.1
Exhibit 99.1
Continued Momentum Driven by Strong Platform Demand
Q1 2021 (includes Signal Sciences)1
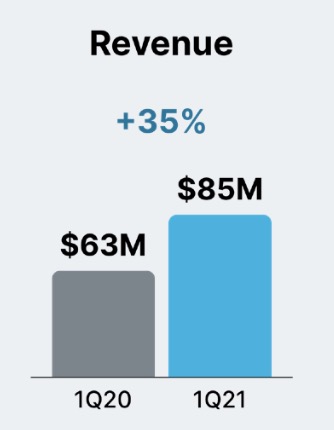
•Strong top-line growth of 35% year-over-year with revenue of nearly $85 million, net of a $1.5 million deferred revenue write-down related to purchase accounting adjustments from the Signal Sciences acquisition
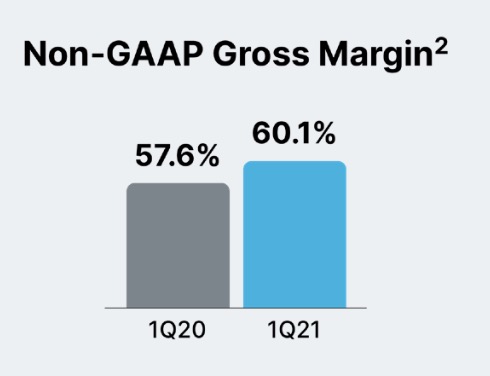
•GAAP gross margin of 55.8%, compared to 56.7% in Q1 2020; non-GAAP gross margin2 of 60.1%, which excludes stock-based compensation and amortization of acquired intangible assets, up from 57.6% in Q1 2020
•GAAP operating loss of $50 million, compared to GAAP operating loss of $12 million for Q1 2020; non-GAAP operating loss2 of $13 million, which excludes stock-based compensation, amortization of acquired intangible assets and acquisition-related costs, compared to non-GAAP operating loss of $6 million for Q1 2020
•GAAP basic and diluted net loss per share of $0.44, compared to GAAP basic and diluted net loss per share of $0.13 for Q1 2020; non-GAAP basic and diluted net loss per share2 of $0.12, compared to non-GAAP basic and diluted net loss per share of $0.06 for Q1 2020
•Capital expenditures3 of $9 million, or 11% of revenue
____________________________________________
1 The contribution of Signal Sciences following our acquisition of them has been consolidated into our first quarter 2021 financial information. We have not included Signal Sciences in most of our key metrics this quarter and intend to report consolidated customer statistics later in 2021. In order to see the incremental contribution on customer growth from Signal Sciences, we have provided their total customer counts and number of enterprise customers for Q1 2021.
2 For a reconciliation of non-GAAP financial measures to their corresponding GAAP measures, please refer to the reconciliation table at the end of this letter.
3 Capital Expenditures are defined as cash used for purchases of property and equipment and capitalized internal-use software, as reflected in our statement of cash flows.
Exhibit 99.1
Key Metrics (excludes Signal Sciences)1
•Continued strong enterprise customer growth and expansion:
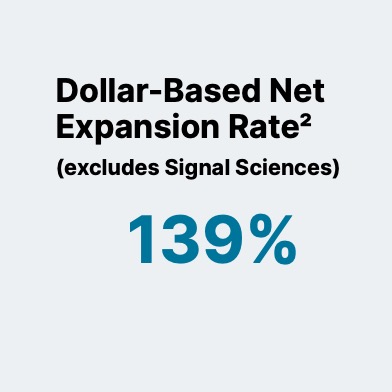
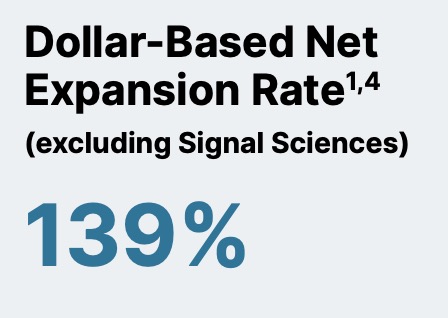
•Dollar-Based Net Expansion Rate (DBNER)2 of 139%, compared to 143% in Q4 2020
•Net Retention Rate (NRR)3 of 107%, compared to 115% in Q4 2020
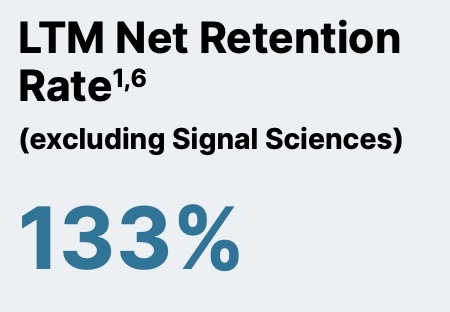
▪Last-twelve-month (LTM) NRR4 of 133%, compared to 137% in Q4 2020
•Total customer count increased to 2,207 from 2,084 in Q4 2020
▪Enterprise customer count5 of 336, up from 324 in Q4 2020
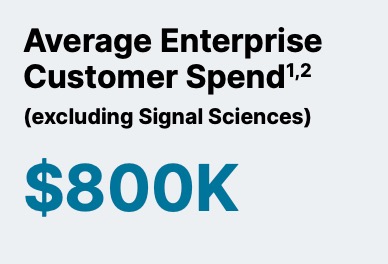
•Average enterprise customer spend5 of approximately $800,000, up from $782,000 in Q4 2020
•Enterprise customers generated 90% of our trailing twelve-month total revenue, compared to 89% in Q4 2020
Signal Sciences Key Metrics1
•Total customer count of 293, up from 280 at the end of Q4 2020
•Enterprise customer count6 of 86, up from 78 at the end of Q4 2020
◦Approximately 25% overlap with existing Fastly enterprise customers
____________________________________________
1 The contribution of Signal Sciences following our acquisition of them has been consolidated into our first quarter 2021 financial information. We have not included Signal Sciences in most of our key metrics this quarter and intend to report consolidated customer statistics later in 2021. In order to see the incremental contribution on customer growth from Signal Sciences, we have provided their total customer counts and number of enterprise customers for Q1 2021.
2 We calculate Dollar-Based Net Expansion Rate by dividing the revenue for a given period from customers who remained customers as of the last day of the given period (the “current” period) by the revenue from the same customers for the same period measured one year prior (the “base” period). The revenue included in the current period excludes revenue from (i) customers that churned after the end of the base period and (ii) new customers that entered into a customer agreement after the end of the base period.
3 Net Retention Rate measures the net change in monthly revenue from existing customers in the last month of the period (the “current" period month) compared to the last month of the same period one year prior (the “prior" period month). The revenue included in the current period month includes revenue from (i) revenue contraction due to billing decreases or customer churn, (ii) revenue expansion due to billing increases, but excludes revenue from new customers. We calculate Net Retention Rate by dividing the revenue from the current period month by the revenue in the prior period month.
4 Our LTM Net Retention Rate, intended to be supplemental to our Net Retention Rate, was 137% for the period ended December 31, 2020. We calculate LTM Net Retention Rate by dividing the total customer revenue for the prior twelve-month period (“prior 12-month period”) ending at the beginning of the last twelve-month period (“LTM period”) minus revenue contraction due to billing decreases or customer churn, plus revenue expansion due to billing increases during the LTM period from the same customers by the total prior 12-month period revenue. We believe the LTM Net Retention Rate is supplemental as it removes some of the volatility that is inherent in a usage-based business model.
5 Calculated based on trailing twelve-months.
6 Signal Sciences enterprise customers are defined as customers that spend $100,000 or more on an annualized basis, in other words, spending $8,333.34 or more per month as of March 31, 2021.
Exhibit 99.1
To Our Shareholders
In addition to celebrating Fastly’s 10-year anniversary as a company, it was also this time last year that I sat down to write my first shareholder letter as CEO, under vastly different circumstances than I had envisioned. Although we were navigating the most uncertain time in recent history, I had the confidence to write, “Despite the current global economic uncertainty, we remain confident in the demand for our mission-critical services and the continued growth of our business in 2020 and the years to come.” I stand here now even more confident in our future, because the changes we experienced in 2020 appear more permanent than many predicted.
What we’ve seen over the past year is the cementing of a new way of operating, where the Internet truly has become the axis upon which we rotate our economic and social worlds. As the world begins to reopen, it’s clear that these initial changes to support stay-at-home environments have made our lives easier and made businesses more efficient, indicating that these lasting trends will signal a new era.
This new era is defined by ‘always on’ instant experiences with security and privacy embedded in all aspects of the journey. We’re humbled to have a unique market position in which innovative companies are defining the architecture of the future on our platform — combining edge computing and security together to create the best of the Internet.
A great example of this is HUMAN Security, which selected Fastly’s Compute@Edge platform to extend their mitigation and enforcement products to the edge. HUMAN Security is a leading bot mitigation provider that verifies the humanity of more than 10 trillion interactions every week and is relied upon by many of the Internet's largest advertising platforms and enterprises. Recently, in collaboration with Google and Roku, they disrupted the largest and most sophisticated Connected TV bot-net found to date. By building on Compute@Edge, they prioritized maximum efficiency and efficacy for their hyper-scale deployment, combined with enhanced performance, fast development, and reduced time-to-market. We’re proud to partner with HUMAN Security in
their mission to protect enterprises and preserve privacy and frictionless experiences.
Our customers have communicated to us that a key benefit of the Fastly platform is our position and technology to support privacy. We view privacy, which is core to who we are, as inseparable from security. The most tangible benefit of securing enterprises is to ensure the privacy of their customers. The intersection of edge compute, security, and privacy is ripe for innovation, and by making user security and privacy a core focus of our efforts, we can provide more benefits to a wider array of customers around the world.
Exhibit 99.1
We saw strong demand in the beginning of 2021 as we continued to bolster our edge cloud and security offerings. We delivered revenue of nearly $85 million, up 35% year-over-year, with our total customer count1 (excluding Signal Sciences) increasing to 2,207, up from 2,084 in Q4 2020 and enterprise customers1,2 increasing to 336, up from 324 in Q4 2020. In addition to generating new demand on the platform, we continued to execute on our land- and-expand strategy with average enterprise customer spend1,2 increasing to $800,000, up from $782,000 in the prior quarter, and another strong DBNER3 of 139%.
Our Q1 2021 non-GAAP gross margin4 was 60.1%, reflecting continued year-over-year improvement, along with incremental investments made to support further growth in 2021 and beyond. We believe our edge cloud platform, complimented by Signal Sciences’ security offerings, provides us a tremendous market opportunity, and we will continue to invest in order to place ourselves in a position for further success.
CFO Transition
I also want to share that Fastly CFO Adriel Lares will be stepping down after five years of service. He will continue in his role for a transition period during which we expect to appoint a successor and for a period of time after as an advisor to ensure a smooth transition. We thank Adriel for his many contributions to our company during formative milestones, including becoming a public company, and we wish him well in his future endeavors.
____________________________________________
1 Excludes Signal Sciences (see footnote 1 on page 2)
2 Calculated based on trailing twelve-months.
3 We calculate Dollar-Based Net Expansion Rate by dividing the revenue for a given period from customers who remained customers as of the last day of the given period (the “current” period) by the revenue from the same customers for the same period measured one year prior (the “base” period). The revenue included in the current period excludes revenue from (i) customers that churned after the end of the base period and (ii) new customers that entered into a customer agreement after the end of the base period.
4 For a reconciliation of non-GAAP financial measures to their corresponding GAAP measures, please refer to the reconciliation table at the end of this letter.
Exhibit 99.1
Innovation at the Edge
We are very pleased with our roadmap progress across all our product lines, with integration advances in security accelerating upsell and cross-sell opportunities, and the continued maturity of Compute@Edge driving ever more customer interest, as well as producing major operational efficiencies in our own product development.
Security at Scale
We believe security and privacy should work in conjunction with delivery and compute without impacting performance or reliability. Together, Fastly and Signal Sciences are enabling our customers to secure applications at scale, quickly and reliably, anywhere. This quarter, we made significant progress on the integration of Signal Sciences, and are seeing significant cross-sell and joint-selling opportunities as demonstrated by key new and existing customer wins across multiple verticals. We have also made meaningful progress on the systems and go-to-market front. Customers can now purchase Fastly and Signal Sciences’ next-gen Web Application Firewalls (WAF) offerings on a single, unified contract, simplifying the ordering process and shortening sales cycles.
Last quarter, we saw wins across ecommerce, digital publishing, financial services, cryptocurrency, and healthcare. For example, a fashion specialty retailer in the U.S. selected Fastly’s next-gen WAF offering because of DevOps workflows and ease of deployment, upgrading from a legacy provider’s solution. We also saw an American media website that publishes reviews, news, podcasts, and blogs globally adopt Fastly’s next-gen WAF solution to speed up integration and standardization across all properties. In addition, a leading crypto-wealth management company adopted Fastly based on the high performance and efficiency of our software-defined network paired with the DevOps integrations of Fastly’s next-gen WAF solution.
We are also pleased to share notable enhancements and milestones since the Signal Sciences acquisition, including:
•Visibility: API and ATO dashboards are now available in the Signal Sciences console. These new dashboards surface security telemetry from over 20 new signals for advanced attack scenarios such as account takeover, credit card validation, and password reset. For more information, view the blog post about the features.
•Customer’s Choice WAF: We have been recognized as a “Customer’s Choice” for Web Application Firewalls in the 2021 Gartner Peer Insights “Voice of the Customer” report for the third year in a row, and have one of the highest overall customer ratings - 4.9 out of 5.0 stars. See our blog post for more information.
•Okta Integration: Through a new integration with Fastly’s next-gen WAF solution, risk signals we detect are now sent to Okta’s Identity Risk Engine in real-time. Okta uses this to correlate suspicious and malicious IP addresses with end-user accounts and applies enforcement actions, helping protect our joint customers from layer 7 threats.
Exhibit 99.1
Continued Compute@Edge Momentum
Our Compute@Edge platform places a global, high-performance serverless environment at the fingertips of software engineers. Our partners and customers continue to evolve their use cases into the next generation of applications and products. Without the constraints of traditional application hosting workflows, software engineers are able to innovate faster, deliver new experiences and technologies more quickly, and rapidly go to market.
We’ve also leveraged Compute@Edge in our own product development. For example, last week we announced a new product called Nearline Cache, a storage solution for customers with large content libraries, like gaming, software, and streaming media companies. Building in Compute@Edge, Fastly’s product development team quickly iterated and delivered Nearline Cache to market.
In the past quarter, we delivered significant enhancements to our edge computing platform, with several critical features that enhance the developer experience. Most notably, we released Log Tailing, which enables real-time debugging without having to rely upon and pay for a third-party log management tool. We are also expanding our supported languages to include Javascript, which has the potential to dramatically increase our addressable customer base.
Expanding Customer Momentum across multiple verticals
The demand for Fastly’s platform remains strong as companies stay focused on their digital transformation and are beginning to realize the tremendous potential at the edge. This quarter we saw usage expansion and new business wins across multiple verticals and regions including gaming, high technology, education, eCommerce, and financial services.
Key customer highlights:
•Gaming – Strong momentum continues in this rapidly-growing vertical with several AAA titles launching new seasons and more publishers releasing additional content for next generation consoles that launched late last year. Fastly’s highly performant network, with its ability to accelerate APIs and power real-time interactions, continues to be an important differentiator for our gaming customers and partners.
•High Tech – To ensure the smooth integration and purchasing process, our partners at Google Cloud Platform helped bundle a deal together through the Google Marketplace with a leading provider of multilayer network switches and software-defined networking solutions, who selected Fastly to provide a full suite of services, including our next-gen WAF solution powered by Signal Sciences, delivery and API acceleration as a replacement for a legacy CDN provider.
Exhibit 99.1
•Education – An essential early learning program platform for kids ages 2 - 8, chose Fastly to quickly scale and improve the overall digital experience while reducing rapidly increasing cloud spending as they navigated exponential growth last year.
•Ecommerce – One of the most trusted product recommendation services on the Internet, added Fastly’s Image Optimization product to improve the experience for users on every platform. By handling image optimization at the edge, their users have experiences tailored to their devices and choices without having to scale the cloud infrastructure that provides their hosting. Additionally, a leading online and brick-and-mortar marketplace for authenticated luxury consignment upgraded their Fastly suite to include our next-gen WAF while converting their contract with Fastly into a multi-year deal.
•Financial Services – A leading automotive insurance SaaS provider, selected Fastly’s next-gen WAF to replace their legacy WAF and Load Balancer appliances due to our ability to defend their sites, applications, and APIs in a single platform with significantly higher efficacy rates and lower false positive rates.
•International Markets – We continue to demonstrate success across the globe with our edge cloud platform and security offerings. A leading Spanish media company, chose our platform to enable a multi-CDN strategy for media delivery. Compute@Edge plays a critical role in this strategy by standardizing manifest and token manipulation to ensure a consistent user experience across all video streams. Also, a large Japanese mobile and telecommunications provider leveraged Fastly’s Image Optimization products to significantly enhance the user experience on their apps and sites.
Exhibit 99.1
Driving Expansion With Enterprise Customers
During the quarter, we saw further expansion in both our core and enterprise customer bases (enterprise customers are defined as spending $100,000 or more in a twelve-month period).
We increased our enterprise customer count1,2 to 336 from 324, excluding Signal Sciences, in the previous quarter. Additionally, as of March 31, 2021, Signal Sciences’ enterprise customer count3 was 86, up from 78, with approximately 25% overlap with existing Fastly enterprise customers.
Beyond attracting new customers to the platform, an important part of our strategy is the ability to capture additional business from existing customers. In the first quarter, we drove continued robust engagement, as evidenced by an increase in our average enterprise customer spend1,2 of $800,000, up from $782,000 in the previous quarter, and our strong Dollar-Based Net Expansion Rate (DBNER)4 of 139%, which measures the change in revenue from existing customers over a twelve-month period. The increase in spend and strong DBNER highlight the strength of our platform and commitment to meeting the needs of our enterprise customers1,2, which represented 90% of our trailing twelve- months revenue compared to 89% in Q4 2020.
Further demonstrating the stickiness of our edge cloud platform and the loyalty of our customers, we delivered another strong Net Retention Rate1,5 (NRR) of 107% in Q1 2021 (133% on a last-twelve-month (LTM) basis1,6). We believe LTM NRR removes some of the volatility that is inherent in a usage- based business model. NRR measures the net change in monthly revenue from existing customers in the last month of the period compared to the last month of the same period one year prior. It includes revenue contraction due to billing decreases or customer churn and revenue expansion due to billing increases, but excludes revenue from net new customers. We measure NRR in addition to DBNER in an effort to provide insight into our customer base in a similar fashion to what is commonly found with traditional SaaS companies. DBNER differs from NRR in that DBNER only includes existing customers that have been on the platform at least 13 months, and excludes churn.
____________________________________________
1 Excludes Signal Sciences (see footnote 1 on page 2)
2 Calculated based on trailing twelve-months.
3 Signal Sciences enterprise customers are defined as customers that spend $100,000 or more on an annualized basis, in other words, spending $8,333.34 or more per month as of March 31, 2021.
4 We calculate Dollar-Based Net Expansion Rate by dividing the revenue for a given period from customers who remained customers as of the last day of the given period (the “current” period) by the revenue from the same customers for the same period measured one year prior (the “base” period). The revenue included in the current period excludes revenue from (i) customers that churned after the end of the base period and (ii) new customers that entered into a customer agreement after the end of the base period.
5 Net Retention Rate measures the net change in monthly revenue from existing customers in the last month of the period (the “current" period month) compared to the last month of the same period one year prior (the “prior" period month). The revenue included in the current period month includes revenue from (i) revenue contraction due to billing decreases or customer churn, (ii) revenue expansion due to billing increases, but excludes revenue from new customers. We calculate Net Retention Rate by dividing the revenue from the current period month by the revenue in the prior period month.
6 Our LTM Net Retention Rate, intended to be supplemental to our Net Retention Rate, was 137% for the period ended December 31, 2020. We calculate LTM Net Retention Rate by dividing the total customer revenue for the prior twelve-month period (“prior 12-month period”) ending at the beginning of the last twelve-month period (“LTM period”) minus revenue contraction due to billing decreases or customer churn, plus revenue expansion due to billing increases during the LTM period from the same customers by the total prior 12-month period revenue. We believe the LTM Net Retention Rate is supplemental as it removes some of the volatility that is inherent in a usage-based business model.
Exhibit 99.1
Building a World Class Global Platform
We believe our unique, software-defined network separates us from legacy providers due to our ability to continuously drive optimization and improvement. As we’ve augmented the platform, we’ve increased our capacity and improved our efficiency. Since our IPO, we’ve nearly tripled our aggregate capacity while only doubling our server count and delivering compute and security at the edge. As of Q1 2021, we reached over 130 Tbps of global capacity. This quarter, we entered two new markets — in Phoenix and Portland — now totaling 58 global markets. We aim to continue our expansion globally in 2021 while remaining focused on the safety of our employees and vendors.
Despite uncertainty over the past year, we’ve successfully executed on our supply chain strategy without major disruption. As we’ve previously mentioned, we closely monitor global supply chains to ensure we have inventory on hand and are always prepared to adjust as needed. We are confident in our ability to augment capacity safely, drive efficiency via software, and support our continued growth into the future.
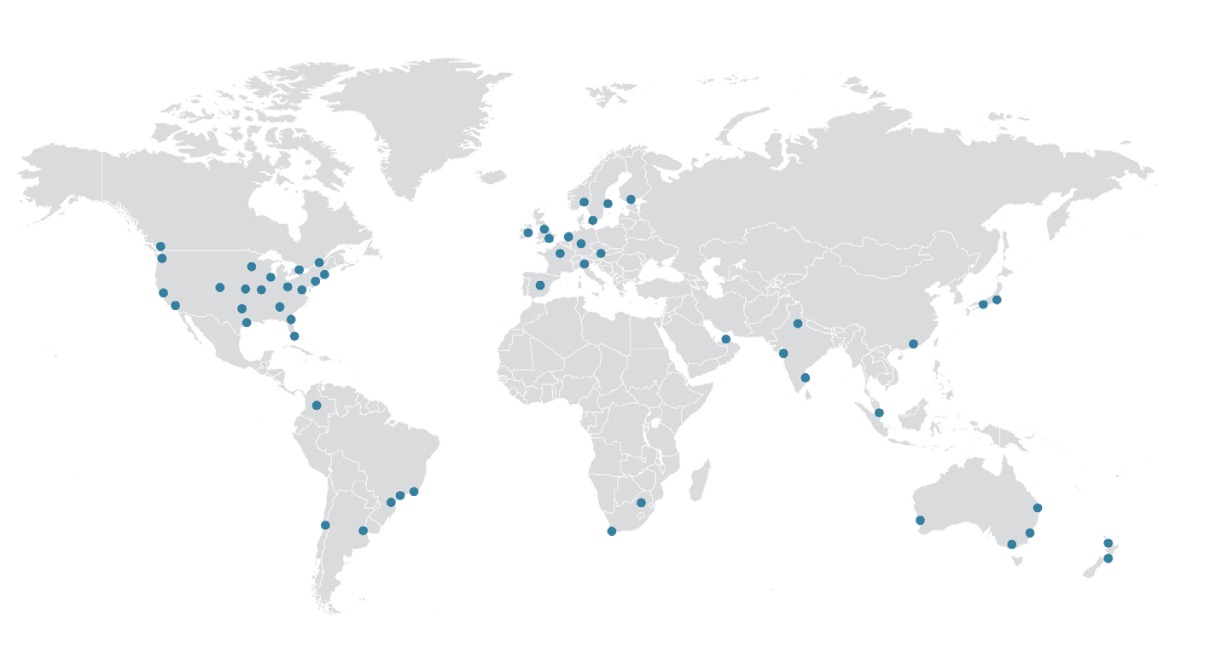
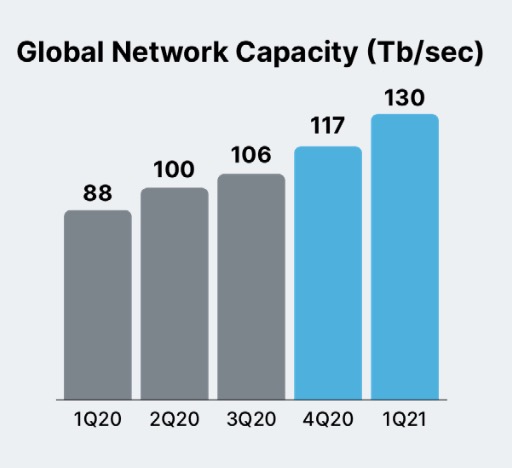
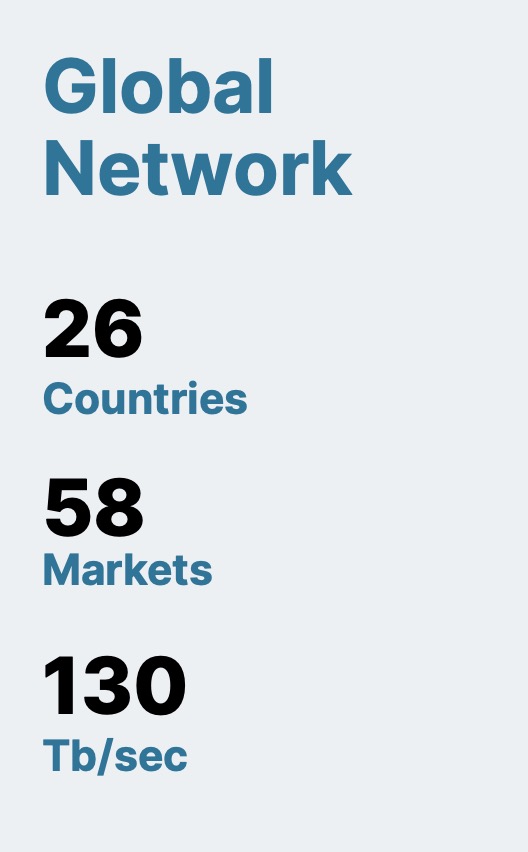
Exhibit 99.1
Financial Discussion
Q1 2021 Performance
Revenue
Total revenue for Q1 2021 increased 35% year-over-year to nearly $85 million, net of a $1.5 million deferred revenue write-down associated with the acquisition of Signal Sciences.
Customer Count
As of March 31, 2021, 336 of our 2,207 customers, excluding Signal Sciences’ customers, were enterprise customers1, which accounted for 90% of our trailing twelve-month total revenue. Signal Sciences had a total of 293 customers, including 86 enterprise customers2, of which approximately 25% overlap with Fastly enterprise customers.
Gross Margin
We remain confident in our ability to deliver long-term leverage on an annual basis. GAAP gross margin was 55.8% for Q1 2021, compared to 56.7% in the same quarter a year ago. Excluding stock-based compensation and amortization of acquired intangible assets, our non-GAAP gross margin3 was 60.1% for Q1 2021, up from 57.6% in the same quarter a year ago.
Our gross margin reflects our recent acquisition of Signal Sciences, the timing of personnel and infrastructure investments, and seasonal usage by customers on our platform.
____________________________________________
1 Excludes Signal Sciences (see footnote 1 on page 2)
2 Signal Sciences enterprise customers are defined as customers that spend $100,000 or more on an annualized basis, in other words, spending $8,333.34 or more per month as of March 31, 2021.
3 For a reconciliation of non-GAAP financial measures to their corresponding GAAP measures, please refer to the reconciliation table at the end of this letter.
Exhibit 99.1
Expenses
Research and development expenses were $29 million in Q1 2021, or 34% of revenue, up from $14 million, or 23% of revenue in Q1 2020. The increase was primarily driven by an increase in headcount and personnel-related investments geared toward innovating new products and features to produce next-generation edge computing solutions.
Sales and marketing expenses were $35 million in Q1 2021, representing 41% of revenue, up from $19 million, or 30% of revenue in Q1 2020. The increase was primarily driven by an increase in headcount and personnel-related costs to drive future enterprise customer acquisition growth and encourage further use of our platform by existing customers. We also increased our marketing spend primarily related to various marketing campaigns to attract potential new customers. Lastly, the increase was also driven by amortization of acquired intangible assets from the Signal Sciences acquisition.
General and administrative expenses were $33 million in Q1 2021, or 39% of revenue, up from $14 million, or 23% of revenue in Q1 2020. The increase is primarily driven by personnel- related costs from additional headcount, other personnel-related investments to support our future growth, professional services related to ongoing compliance costs as a public company, as well as acquisition-related expenses.
In total, our operating expenses for Q1 2021 were $97 million, compared to $48 million in Q1 2020. The increase was primarily due to costs related to personnel investments, professional services for ongoing compliance costs as a public company, acquisition-related expenses, and amortization of acquired intangible assets.
We generated a GAAP operating loss for Q1 2021 of $50 million, or 59% of revenue, compared to GAAP operating loss of $12 million, or 19% of revenue in Q1 2020.
Non-GAAP operating loss1 for Q1 2021 was $13 million, or 15% of revenue, compared to non- GAAP operating loss of $6 million, or 9% of revenue in Q1 2020.
____________________________________________
1 For a reconciliation of non-GAAP financial measures to their corresponding GAAP measures, please refer to the reconciliation table at the end of this letter.
Exhibit 99.1
Net Loss
Net loss for Q1 2021 was $51 million, or $0.44 loss per basic and diluted share, compared to $12 million and $0.13 loss per basic and diluted share in Q1 2020. Non-GAAP net loss1 for Q1 2021 was $14 million, or $0.12 loss per basic and diluted share, compared to $6 million and $0.06 loss per basic and diluted share in Q1 2020. For a reconciliation of non-GAAP financial measures to their corresponding GAAP measures, please refer to the reconciliation table at the end of this letter.
Balance Sheet, Capital Expenditures, and Cash Flow
We ended Q1 2021 with $1.1 billion in cash, restricted cash and investments, including those classified as long-term. Cash used in operations was $11 million in the quarter. Capital expenditures, or cash used for purchases of property and equipment and capitalized internal-use software, were $9 million in Q1 2021, representing 11% of total revenue in Q1 2021. Free Cash Flow was ($20) million in Q1 2021. For additional context, please refer to the reconciliation of free cash flow to its corresponding GAAP metric in the table at the end of this letter.
Convertible Senior Notes
In March 2021, we received net proceeds of approximately $930 million from the issuance of 0.00% convertible senior notes due in 2026. The notes have an aggregate principal amount of approximately $949 million.
____________________________________________
1 For a reconciliation of non-GAAP financial measures to their corresponding GAAP measures, please refer to the reconciliation table at the end of this letter.
Exhibit 99.1
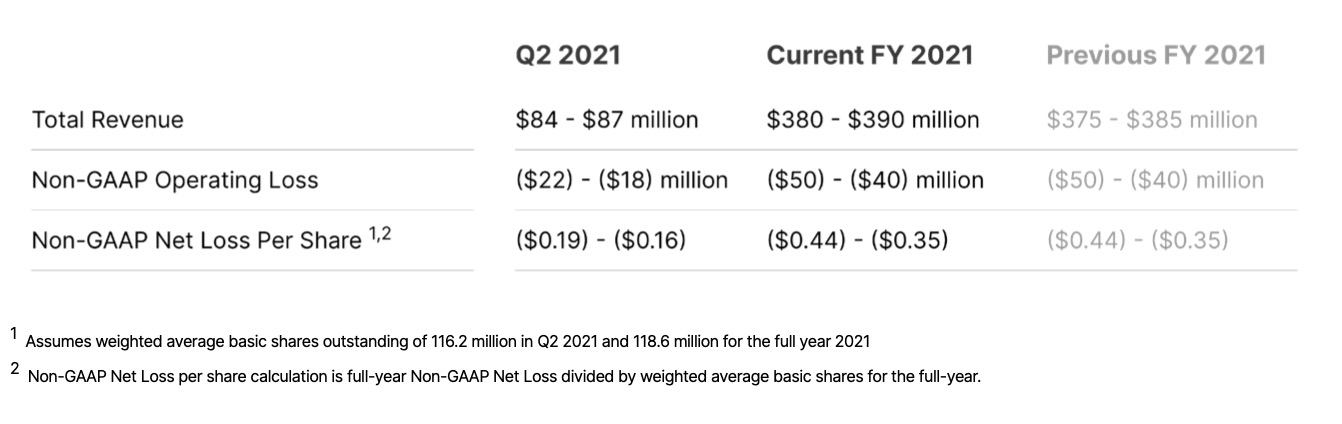
Q2 and Full-Year 2021 Business Outlook
Our outlook reflects our strong top-line growth momentum, our strategic investments in security and cloud computing, and the incremental expense from the Signal Sciences acquisition. Given our usage-based business model, we base our revenue guidance on current and expected platform usage. Consistent with prior years, we expect to gain additional visibility as the year progresses.
Our gross margin reflects the additional scale and the investments we made to support growth expectations for the year. As previously mentioned, we are focused on continued investment in the business to accelerate our expansion and growth in the pursuit of our tremendous market opportunity. We remain confident in our ability to deliver incremental annual gross margin expansion.
As we invest in the business in 2021, we expect capital expenditures as a percentage of revenue to be approximately 13% to 14% of revenue for the full year. In the long-term, we expect capital expenditures to approach 10% of revenue on a calendar year basis.
A reconciliation of non-GAAP guidance measures to corresponding GAAP measures for our Q2 and Full Year 2021 Business Outlook is not available on a forward-looking basis without unreasonable effort due to the uncertainty regarding, and the potential variability of, many of these costs and expenses that may be incurred in the future. We have provided a reconciliation of GAAP to non-GAAP financial measures for Q1 2021 in the reconciliation table at the end of this letter.
Exhibit 99.1
Quarterly Conference Call
We will host a live Q&A session at 2:00 p.m. PT / 5:00 p.m. ET on Wednesday, May 5, 2021 to discuss these financial results. To participate in the live call, please dial (833) 968-2077 (U.S. / Canada) or (236) 714-2139 (international) and provide conference ID 2979196. A live webcast of the call will be available at https://investors.fastly.com and will be archived on our site following the call.
Reflecting on the past decade, I’m proud of our team’s enduring dedication to our customer- first mindset and desire to build and deliver a more trustworthy Internet for all. Given all that we’ve accomplished in the past decade – and especially over this past year – I am extremely confident in the growing demand for our platform and the future of our business. We are gaining momentum with both our compute and security offerings, and delivering on our edge cloud mission. I look forward to seeing where 2021 will take us as our work to help builders create a more trustworthy Internet continues.
Thank you for taking the time to read our letter, and we look forward to your questions on our call this afternoon.
Sincerely,
Joshua Bixby
CEO
Exhibit 99.1
Forward-Looking Statements
This letter to shareholders contains forward-looking statements within the meaning of Section 27A of the Securities Act of 1933, as amended (the "Securities Act"), and Section 21E of the Securities Exchange Act of 1934, as amended, about us and our industry that involve substantial risks and uncertainties. Forward-looking statements generally relate to future events or Fastly's future financial or operating performance. In some cases, you can identify forward-looking statements because they contain words such as "may," "will," "should," "expects," "plans," "anticipates,” “going to,” "could," "intends," "target," "projects," "contemplates," "believes," "estimates," "predicts," "potential," or "continue," or the negative of these words or other similar terms or expressions that concern Fastly's expectations, strategy, priorities, plans, or intentions. Forward-looking statements in this letter to shareholders include, but are not limited to, statements regarding Fastly’s future financial and operating performance, including its outlook and guidance; Fastly's strategies, product and business plans, including its ability to scale and further invest in the business to expand its Edge Cloud Platform; statements regarding the integration and success of Signal Sciences; statements regarding Fastly's investments in revenue, marketing and demand generation, and the impact of such investments on its business; statements regarding the performance of Fastly's platform, including its ability to augment capacity safely, drive efficiency, and support continued growth; statements regarding Fastly's expectations regarding the expansion of its customer base, including anticipated enterprise customer deals, the growth and usage of its customers, continued demand for future products from the combined Signal Sciences portfolio, and adoption of new coding languages; and expectations regarding the long-term impact of the COVID-19 pandemic. Fastly's expectations and beliefs regarding these matters may not materialize, and actual results in future periods are subject to risks and uncertainties that could cause actual results to differ materially from those projected. These risks include the possibility that: Fastly is unable to attract and retain customers; Fastly's existing customers and partners do not maintain or increase usage of Fastly's platform; Fastly's platform and product features do not meet expectations, including due to interruptions, security breaches, delays in performance or other similar problems; Fastly is unable to adapt to meet evolving market and customer demands and rapid technological change; Fastly is unable to comply with modified or new industry standards, laws and regulations; Fastly is unable to generate sufficient revenues to achieve or sustain profitability; Fastly’s limited operating history makes it difficult to evaluate its prospects and future operating results; Fastly is unable to effectively manage its growth; and Fastly is unable to compete effectively. The forward-looking statements contained in this shareholder letter are also subject to other risks and uncertainties, including those more fully described in Fastly’s Annual Report on Form 10-K for the year ended December 31, 2020, and additional information that will be set forth on Fastly's Quarterly Report on Form 10-Q for the quarter ended March 31, 2021 and other filings and reports that we may file from time to time with the SEC. The forward-looking statements in this letter to shareholders are based on information available to Fastly as of the date hereof, and Fastly disclaims any obligation to update any forward-looking statements, except as required by law.
Exhibit 99.1
Non-GAAP Financial Measures
To supplement our condensed consolidated financial statements, which are prepared and presented in accordance with accounting principles generally accepted in the United States ("GAAP"), the Company uses the following non-GAAP measures of financial performance: non-GAAP gross profit, non-GAAP gross margin, non-GAAP operating loss, non-GAAP net loss, non-GAAP basic and diluted net loss per common share, non-GAAP research and development, non-GAAP sales and marketing, non-GAAP general and administrative, free cash flow and adjusted EBITDA. The presentation of this additional financial information is not intended to be considered in isolation from, as a substitute for, or superior to, the financial information prepared and presented in accordance with GAAP. These non-GAAP measures have limitations in that they do not reflect all of the amounts associated with our results of operations as determined in accordance with GAAP. In addition, these non-GAAP financial measures may be different from the non-GAAP financial measures used by other companies. These non-GAAP measures should only be used to evaluate our results of operations in conjunction with the corresponding GAAP measures. Management compensates for these limitations by reconciling these non-GAAP financial measures to the most comparable GAAP financial measures within our earnings releases.
Non-GAAP gross profit, non-GAAP gross margin, non-GAAP operating loss, Non-GAAP net loss and non-GAAP basic and diluted net loss per common share differ from GAAP, non- GAAP research and development, non-GAAP sales and marketing, and non-GAAP general and administrative differ from GAAP in that they exclude stock-based compensation expense, amortization of acquired intangibles assets, and acquisition-related expenses.
Adjusted EBITDA: Adjusted EBITDA excludes stock-based compensation expense, depreciation and other amortization expenses, amortization of acquired intangibles assets, acquisition-related expenses, interest income, interest expense, other expense, (net), and income taxes.
Capital Expenditures: cash used for purchases of property and equipment and capitalized internal-use software, as reflected in our statement of cash flows.
Depreciation and Other Amortization Expense: consists of non-cash charges that can be affected by the timing and magnitude of asset purchases. Depreciation and amortization expense is included in the following cost and expense line items of our GAAP presentation: cost of revenue, research and development, sales and marketing, and general and administrative. Management considers its operating results without the amortization expense of our intangible assets when evaluating its ongoing non-GAAP performance and without depreciation and other amortization expense when evaluating its ongoing adjusted EBITDA performance because these charges are non-cash expenses that can be affected by the timing and magnitude of asset purchases and may not be reflective of our core business, ongoing operating results, or future outlook.
Exhibit 99.1
Amortization of Acquired Intangible Assets: consists of non-cash charges that can be affected by the timing and magnitude of asset purchases and acquisitions. Amortization of acquired intangible assets is included in the following cost and expense line items of our GAAP presentation: cost of revenue and sales and marketing. Management considers its operating results without the amortization expense of our acquired intangible assets when evaluating its ongoing non-GAAP performance and without the amortization expense of our acquired intangible assets when evaluating its ongoing adjusted EBITDA performance because these charges are non-cash expenses that can be affected by the timing and magnitude of asset purchases and acquisitions and may not be reflective of our core business, ongoing operating results, or future outlook.
Free Cash Flow: calculated as net cash used in operating activities less capital expenditures.
Interest Expense: consists primarily of interest expense related to our debt instruments. Management considers its operating results without total interest expense when evaluating its ongoing adjusted EBITDA performance because it is not believed by management to be reflective of our core business, ongoing operating results or future outlook.
Acquisition-related Expense: consists one-time expenses related to the acquisition related activities. Management considers its operating results without the one-time acquisition- related expense when evaluating its ongoing non-GAAP performance and its ongoing adjusted EBITDA performance because these charges are one-time and may not be reflective of our core business, ongoing operating results, or future outlook.
Interest Income: consists primarily of interest income related to our marketable securities. Management considers its adjusted EBITDA results without this activity when evaluating its ongoing performance because it is not believed by management to be reflective of our core business, ongoing operating results or future outlook.
Interest Taxes: consists of expenses recognized related to state and foreign income taxes. Management considers its adjusted EBITDA results without these charges when evaluating its ongoing performance because it is not believed by management to be reflective of our core business, ongoing operating results or future outlook.
Non-GAAP Operating Loss: calculated as GAAP revenue less non-GAAP cost of revenue and non-GAAP operating expenses.
Other Expense, Net: consists primarily of foreign currency transaction gains and losses. Management considers its operating results without other expense, net when evaluating its ongoing adjusted EBITDA performance because it is not believed by management to be reflective of our core business, ongoing operating results or future outlook.
Exhibit 99.1
Stock-based Compensation Expense: consists of expenses for stock options, restricted stock units, performance awards, restricted stock awards and Employee Stock Purchase Plan ("ESPP") under our equity incentive plans. Stock-based compensation is included in the following cost and expense line items of our GAAP presentation: cost of revenue, research and development, sales and marketing, and general and administrative.
Although stock-based compensation is an expense for the Company and is viewed as a form of compensation, management excludes stock-based compensation from our non-GAAP measures and adjusted EBITDA results for purposes of evaluating our continuing operating performance primarily because it is a non-cash expense not believed by management to be reflective of our core business, ongoing operating results, or future outlook. In addition, the value of some stock-based instruments is determined using formulas that incorporate variables, such as market volatility, that are beyond our control.
Management believes these non-GAAP financial measures and adjusted EBITDA serve as useful metrics for our management and investors because they enable a better understanding of the long-term performance of our core business and facilitate comparisons of our operating results over multiple periods and to those of peer companies, and when taken together with the corresponding GAAP financial measures and our reconciliations, enhance investors' overall understanding of our current financial performance.
In the financial tables below, the Company provides a reconciliation of the most comparable GAAP financial measure to the historical non-GAAP financial measures used in this shareholder letter.
Exhibit 99.1
Condensed Consolidated Statements of Operations
(in thousands, except per share amounts, unaudited)
| Three months ended March 31, | ||||||||||||||
| 2021 | 2020 | |||||||||||||
| Revenue | $ | 84,852 | $ | 62,924 | ||||||||||
Cost of revenue(1) | 37,494 | 27,265 | ||||||||||||
| Gross profit | 47,358 | 35,659 | ||||||||||||
| Operating expenses: | ||||||||||||||
Research and development(1) | 28,988 | 14,298 | ||||||||||||
Sales and marketing(1) | 34,872 | 19,168 | ||||||||||||
General and administrative(1) | 33,461 | 14,169 | ||||||||||||
| Total operating expenses | 97,321 | 47,635 | ||||||||||||
| Loss from operations | (49,963) | (11,976) | ||||||||||||
| Interest income | 174 | 719 | ||||||||||||
| Interest expense | (661) | (316) | ||||||||||||
| Other income (expense), net | (64) | 402 | ||||||||||||
| Loss before income taxes | (50,514) | (11,171) | ||||||||||||
| Income taxes | 169 | 819 | ||||||||||||
| Net loss | $ | (50,683) | $ | (11,990) | ||||||||||
| Net loss per share attributable to common stockholders, basic and diluted | $ | (0.44) | $ | (0.13) | ||||||||||
| Weighted-average shares used in computing net loss per share attributable to common stockholders, basic and diluted | 114,134 | 95,401 | ||||||||||||
__________
(1)Includes stock-based compensation expense as follows:
| Three months ended March 31, | ||||||||||||||
| 2021 | 2020 | |||||||||||||
| Cost of revenue | $ | 1,186 | $ | 615 | ||||||||||
| Research and development | 7,958 | 1,671 | ||||||||||||
| Sales and marketing | 5,008 | 1,483 | ||||||||||||
| General and administrative | 16,686 | 2,560 | ||||||||||||
| Total | $ | 30,838 | $ | 6,329 | ||||||||||
Exhibit 99.1
Condensed Consolidated Balance Sheets
(in thousands)
| As of March 31, 2021 | As of December 31, 2020 | |||||||||||||
| (unaudited) | (audited) | |||||||||||||
| Assets | ||||||||||||||
| Current assets: | ||||||||||||||
| Cash and cash equivalents | $ | 948,783 | $ | 62,900 | ||||||||||
| Marketable securities | 147,793 | 131,283 | ||||||||||||
| Accounts receivable, net | 52,363 | 50,258 | ||||||||||||
| Restricted cash | 87 | 87 | ||||||||||||
| Prepaid expenses and other current assets | 18,408 | 16,728 | ||||||||||||
| Total current assets | 1,167,434 | 261,256 | ||||||||||||
| Property and equipment, net | 98,608 | 95,979 | ||||||||||||
| Operating lease right-of-use assets, net | 63,305 | 60,019 | ||||||||||||
| Goodwill | 635,645 | 635,590 | ||||||||||||
| Intangible assets, net | 116,379 | 121,742 | ||||||||||||
| Other assets | 56,923 | 45,365 | ||||||||||||
| Total assets | $ | 2,138,294 | $ | 1,219,951 | ||||||||||
| Liabilities and Stockholders’ Equity | ||||||||||||||
| Current liabilities: | ||||||||||||||
| Accounts payable | $ | 12,019 | $ | 9,150 | ||||||||||
| Accrued expenses | 36,320 | 34,334 | ||||||||||||
| Finance lease liabilities, current | 10,910 | 11,033 | ||||||||||||
| Operating lease liabilities, current | 20,011 | 19,895 | ||||||||||||
| Other current liabilities | 19,036 | 19,677 | ||||||||||||
| Total current liabilities | 98,296 | 94,089 | ||||||||||||
Long-term debt | 930,291 | — | ||||||||||||
| Finance lease liabilities, noncurrent | 13,648 | 14,707 | ||||||||||||
| Operating lease liabilities, noncurrent | 47,505 | 44,890 | ||||||||||||
| Other long-term liabilities | 3,520 | 4,400 | ||||||||||||
| Total liabilities | 1,093,260 | 158,086 | ||||||||||||
| Stockholders’ equity: | ||||||||||||||
| Class A and Class B common stock | 2 | 2 | ||||||||||||
| Additional paid-in capital | 1,384,045 | 1,350,050 | ||||||||||||
| Accumulated other comprehensive income (loss) | (137) | 6 | ||||||||||||
| Accumulated deficit | (338,876) | (288,193) | ||||||||||||
| Total stockholders’ equity | 1,045,034 | 1,061,865 | ||||||||||||
| Total liabilities and stockholders’ equity | $ | 2,138,294 | $ | 1,219,951 | ||||||||||
Exhibit 99.1
Condensed Consolidated Statements of Cash Flows
(in thousands, unaudited)
| Three months ended March 31, | ||||||||||||||
| 2021 | 2020 | |||||||||||||
| Cash flows from operating activities: | ||||||||||||||
| Net loss | $ | (50,683) | $ | (11,990) | ||||||||||
| Adjustments to reconcile net loss to net cash used in operating activities: | ||||||||||||||
| Depreciation expense | 6,419 | 4,679 | ||||||||||||
| Amortization of intangibles | 5,363 | 36 | ||||||||||||
| Amortization of right-of-use assets and other | 6,357 | 4,949 | ||||||||||||
| Amortization of debt discount and issuance costs | 332 | 19 | ||||||||||||
| Amortization of prepaid commissions | 1,411 | 693 | ||||||||||||
| Stock-based compensation | 30,838 | 6,329 | ||||||||||||
| Provision for credit losses and doubtful accounts | (420) | 150 | ||||||||||||
| Interest paid on finance leases | 330 | (119) | ||||||||||||
| Loss on disposals of property and equipment | 27 | — | ||||||||||||
| Other adjustments | 64 | (512) | ||||||||||||
| Changes in operating assets and liabilities: | ||||||||||||||
| Accounts receivable | (1,685) | (6,031) | ||||||||||||
| Prepaid expenses and other current assets | (1,680) | (1,148) | ||||||||||||
| Other assets | (2,952) | (2,093) | ||||||||||||
| Accounts payable | 2,119 | 3,112 | ||||||||||||
| Accrued expenses | (1,415) | (1,495) | ||||||||||||
| Operating lease liabilities | (6,365) | (4,272) | ||||||||||||
| Other liabilities | 1,071 | 507 | ||||||||||||
| Net cash used in operating activities | (10,869) | (7,186) | ||||||||||||
| Cash flows from investing activities: | ||||||||||||||
| Purchase of marketable securities | (64,331) | — | ||||||||||||
| Sale of marketable securities | 12,497 | — | ||||||||||||
| Maturities of marketable securities | 25,503 | 21,400 | ||||||||||||
| Purchases of property and equipment | (8,079) | (10,169) | ||||||||||||
| Capitalized internal-use software | (989) | (1,437) | ||||||||||||
| Net cash provided by (used in) investing activities | (35,399) | 9,794 | ||||||||||||
| Cash flows from financing activities: | ||||||||||||||
| Issuance of convertible note, net of issuance costs | 930,775 | — | ||||||||||||
| Payments of other debt issuance costs | (1,351) | — | ||||||||||||
| Repayments of finance lease liabilities | (2,951) | (1,593) | ||||||||||||
| Proceeds from exercise of vested stock options | 2,719 | 3,174 | ||||||||||||
| Proceeds from employee stock purchase plan | 3,071 | 2,133 | ||||||||||||
| Net cash provided by financing activities | 932,263 | 3,714 | ||||||||||||
| Effects of exchange rate changes on cash, cash equivalents, and restricted cash | (112) | 37 | ||||||||||||
| Net increase in cash, cash equivalents, and restricted cash | 885,883 | 6,359 | ||||||||||||
| Cash, cash equivalents, and restricted cash at beginning of period | 63,880 | 86,229 | ||||||||||||
| Cash, cash equivalents, and restricted cash at end of period | $ | 949,763 | $ | 92,588 | ||||||||||
| Reconciliation of cash, cash equivalents, and restricted cash as shown in the statements of cash flows | ||||||||||||||
| Cash and cash equivalents | 948,783 | 22,501 | ||||||||||||
| Restricted cash included in prepaid expenses and other current assets | 87 | 70,087 | ||||||||||||
| Restricted cash included in other assets | 893 | — | ||||||||||||
| Total cash, cash equivalents and restricted cash | $ | 949,763 | $ | 92,588 | ||||||||||
Exhibit 99.1
Free Cash Flow
(in thousands, unaudited)
| Quarter ended | Year ended | Quarter ended | ||||||||||||||||||||||||||||||||||||
| Q1 2020 | Q2 2020 | Q3 2020 | Q4 2020 | FY2020 | Q1 2021 | |||||||||||||||||||||||||||||||||
| Cash flow provided by (used in) operations | $ | (7,186) | $ | (8,781) | $ | 27,200 | $ | (31,149) | $ | (19,916) | $ | (10,869) | ||||||||||||||||||||||||||
Capital expenditures(1),(2) | (11,606) | (2,816) | (13,262) | (8,016) | (35,700) | (9,068) | ||||||||||||||||||||||||||||||||
Free Cash Flow(2) | $ | (18,792) | $ | (11,597) | $ | 13,938 | $ | (39,165) | $ | (55,616) | $ | (19,937) | ||||||||||||||||||||||||||
__________
(1)Capital Expenditures are defined as cash used for purchases of property and equipment and capitalized internal-use software, as reflected in our statement of cash flows.
(2)As disclosed in our form 10-K filed on March 1, 2021, we reduced our capital expenditures previously reported by $1.7 million for the year ended December 31, 2020. The quarterly and year-to-date capital expenditure and free cash flow amounts in the table for fiscal year 2020 have been adjusted for this change which was not previously reflected in our quarterly filings on Form 10-Q.
Exhibit 99.1
Reconciliation of GAAP to Non-GAAP Financial Measures
(in thousands, unaudited)
| Three months ended March 31, | ||||||||||||||
| 2021 | 2020 | |||||||||||||
| Gross Profit | ||||||||||||||
| GAAP gross profit | $ | 47,358 | $ | 35,659 | ||||||||||
| Stock-based compensation—Cost of revenue | 1,186 | 615 | ||||||||||||
| Amortization of acquired intangible assets | $ | 2,475 | — | |||||||||||
| Non-GAAP gross profit | $ | 51,019 | $ | 36,274 | ||||||||||
| GAAP gross margin | 55.8 | % | 56.7 | % | ||||||||||
| Non-GAAP gross margin | 60.1 | % | 57.6 | % | ||||||||||
| Research and development | ||||||||||||||
| GAAP research and development | $ | 28,988 | $ | 14,298 | ||||||||||
| Stock-based compensation | (7,958) | (1,671) | ||||||||||||
| Non-GAAP research and development | $ | 21,030 | $ | 12,627 | ||||||||||
| Sales and marketing | ||||||||||||||
| GAAP sales and marketing | $ | 34,872 | $ | 19,168 | ||||||||||
| Stock-based compensation | (5,008) | (1,483) | ||||||||||||
| Amortization of acquired intangible assets | (2,816) | — | ||||||||||||
| Non-GAAP sales and marketing | $ | 27,048 | $ | 17,685 | ||||||||||
| General and administrative | ||||||||||||||
| GAAP general and administrative | $ | 33,461 | $ | 14,169 | ||||||||||
| Stock-based compensation | (16,686) | (2,560) | ||||||||||||
| Acquisition-related expenses | (929) | — | ||||||||||||
| Non-GAAP general and administrative | $ | 15,846 | $ | 11,609 | ||||||||||
| Operating loss | ||||||||||||||
| GAAP operating loss | $ | (49,963) | $ | (11,976) | ||||||||||
| Stock-based compensation | 30,838 | 6,329 | ||||||||||||
| Amortization of acquired intangible assets | 5,291 | — | ||||||||||||
| Acquisition-related expenses | 929 | — | ||||||||||||
| Non-GAAP operating loss | $ | (12,905) | $ | (5,647) | ||||||||||
| Net loss | ||||||||||||||
| GAAP net loss | $ | (50,683) | $ | (11,990) | ||||||||||
| Stock-based compensation | 30,838 | 6,329 | ||||||||||||
| Amortization of acquired intangible assets | 5,291 | — | ||||||||||||
| Acquisition-related expenses | 929 | — | ||||||||||||
| Non-GAAP net loss | $ | (13,625) | $ | (5,661) | ||||||||||
| Non-GAAP net loss per common share—basic and diluted | $ | (0.12) | $ | (0.06) | ||||||||||
| Weighted average basic and diluted common shares | 114,134 | 95,401 | ||||||||||||
Exhibit 99.1
| Three months ended March 31, | ||||||||||||||
| 2021 | 2020 | |||||||||||||
| Adjusted EBITDA | ||||||||||||||
| GAAP net loss | $ | (50,683) | $ | (11,990) | ||||||||||
| Stock-based compensation | 30,838 | 6,329 | ||||||||||||
| Depreciation and other amortization | 6,491 | 4,679 | ||||||||||||
| Amortization of acquired intangible assets | 5,291 | 36 | ||||||||||||
| Interest income | (174) | (719) | ||||||||||||
| Interest expense | 661 | 316 | ||||||||||||
| Other (income) expense, net | 64 | (402) | ||||||||||||
| Income taxes | 169 | 819 | ||||||||||||
| Acquisition-related expenses | 929 | — | ||||||||||||
| Adjusted EBITDA | $ | (6,414) | $ | (932) | ||||||||||