Attached files
| file | filename |
|---|---|
| 8-K - 8-K - FIRST BUSINESS FINANCIAL SERVICES, INC. | fbiz-20210505.htm |

INVESTOR PRESENTATION FIRST QUARTER 2021 Nasdaq: FBIZ Exhibit 99.1
When used in this presentation, and in any other oral statements made with the approval of an authorized executive officer, the words or phrases “may,” “could,” “should,” “hope,” “might,” “believe,” “expect,” “plan,” “assume,” “intend,” “estimate,” “anticipate,” “project,” “likely,” or similar expressions are intended to identify “forward-looking statements” within the meaning of such term in the Private Securities Litigation Reform Act of 1995. Such statements are subject to risks and uncertainties, including among other things: (i) Adverse changes in the economy or business conditions, either nationally or in our markets, including, without limitation, the adverse effects of the COVID-19 pandemic on the global, national, and local economy. (ii) The effect of the COVID-19 pandemic on the Corporation’s credit quality, revenue, and business operations. (iii) Competitive pressures among depository and other financial institutions nationally and in our markets. (iv) Increases in defaults by borrowers and other delinquencies. (v) Our ability to manage growth effectively, including the successful expansion of our client support, administrative infrastructure, and internal management systems. (vi) Fluctuations in interest rates and market prices. (vii) The consequences of continued bank acquisitions and mergers in our markets, resulting in fewer but much larger and financially stronger competitors. (viii) Changes in legislative or regulatory requirements applicable to us and our subsidiaries. (ix) Changes in tax requirements, including tax rate changes, new tax laws, and revised tax law interpretations. (x) Fraud, including client and system failure or breaches of our network security, including our internet banking activities. (xi) Failure to comply with the applicable SBA regulations in order to maintain the eligibility of the guaranteed portions of SBA loans. These risks could cause actual results to differ materially from what FBIZ has anticipated or projected. These risks could cause actual results to differ materially from what we have anticipated or projected. These risk factors and uncertainties should be carefully considered by our stockholders and potential investors. For further information about the factors that could affect the Corporation’s future results, please see the Corporation’s annual report on Form 10-K for the year ended December 31, 2020, the Corporation’s quarterly report on Form 10-Q for the quarter ended March 31, 2021, and other filings with the Securities and Exchange Commission. Investors should not place undue reliance on any such forward-looking statement, which speaks only as of the date on which it was made. The factors described within the filings could affect our financial performance and could cause actual results for future periods to differ materially from any opinions or statements expressed with respect to future periods. Where any such forward-looking statement includes a statement of the assumptions or bases underlying such forward-looking statement, FBIZ cautions that, while its management believes such assumptions or bases are reasonable and are made in good faith, assumed facts or bases can vary from actual results, and the differences between assumed facts or bases and actual results can be material, depending on the circumstances. Where, in any forward-looking statement, an expectation or belief is expressed as to future results, such expectation or belief is expressed in good faith and believed to have a reasonable basis, but there can be no assurance that the statement of expectation or belief will be achieved or accomplished. FBIZ does not intend to, and specifically disclaims any obligation to, update any forward-looking statements. Forward-Looking Statements

Table of Contents Company Overview..................................................................... 4 Quarterly Update........................................................................ 7 Profitability & Growth................................................................. 9 Credit.......................................................................................... 14 COVID-19 Update........................................................................ 17 Valuation.................................................................................... 20 Strategic Plan.............................................................................. 25 Appendix..................................................................................... 28

COMPANY OVERVIEW
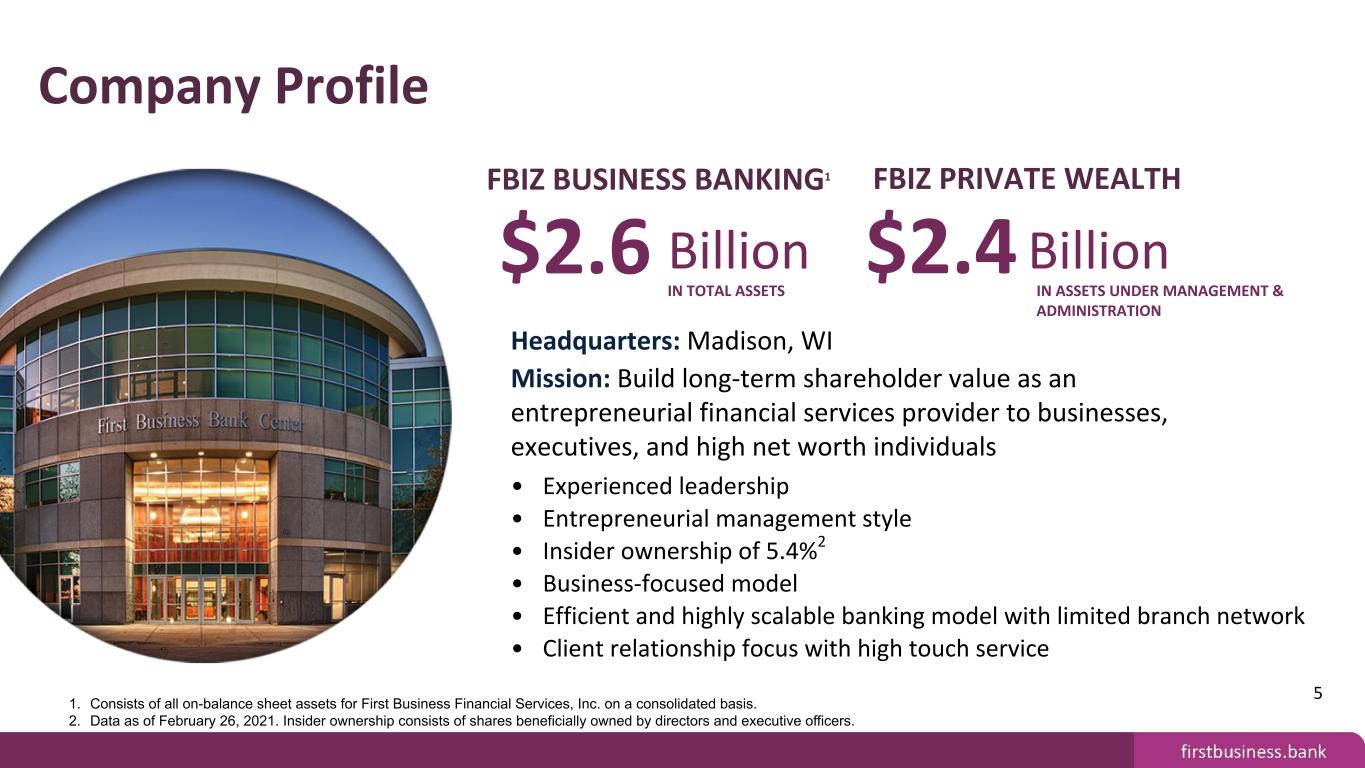
Company Profile • Experienced leadership • Entrepreneurial management style • Insider ownership of 5.4%2 • Business-focused model • Efficient and highly scalable banking model with limited branch network • Client relationship focus with high touch service Headquarters: Madison, WI Mission: Build long-term shareholder value as an entrepreneurial financial services provider to businesses, executives, and high net worth individuals FBIZ BUSINESS BANKING1 $2.6 Billion FBIZ PRIVATE WEALTH $2.4 Billion IN ASSETS UNDER MANAGEMENT & ADMINISTRATION 1. Consists of all on-balance sheet assets for First Business Financial Services, Inc. on a consolidated basis. 2. Data as of February 26, 2021. Insider ownership consists of shares beneficially owned by directors and executive officers. 5 IN TOTAL ASSETS

Evolution of Success Aligned with the Financial Needs of Our Niche Client Base 6

QUARTERLY UPDATE

Profitability & Growth • Record Earnings - Loan growth, strong fee income, and provision benefit led to record net income of $9.7 million. • Fee Income - Diversified revenue sources led by Private Wealth resulted in fee income growth of 23% annualized for the quarter, once again exceeding our goal of 25% or more of total revenue. • Differentiated Loan Growth - Loans, excluding PPP loans, grew 10% annualized in the first quarter. Credit • Asset Quality - Non-performing assets have declined more than 25% for the second consecutive quarter down to $19.0 million from a peak of $36.7 million in the third quarter of 2020. Covid Update • PPP Update - As of March 31, 2021, the company had $272.7 million in gross PPP loans outstanding and $5.1 million in deferred processing fees outstanding. During the quarter, $2.2 million of processing fees were recognized. Valuation • Tangible Book Value (TBV) Increases - TBV per share grew 11% annualized in the quarter. This is a continuation of strong and consistent TBV growth. TBV has increased for 18 consecutive years, at a compound annual growth rate of 8% over that time. First Quarter 2021 Summary 8

Profitability & Growth

0.62% 0.93% 1.51% 7.14% 11.92% 18.48% ROAA (2) ROAE (2) Q1 2020 Q4 2020 Q1 2021 0.00% 0.30% 0.60% 0.90% 1.20% 1.50% 1.80% 0.00% 4.00% 8.00% 12.00% 16.00% 20.00% 24.00% 10 Profitability Loan Growth, Strong Top Line Revenue, and Provision Benefit Drive Record Performance 1. Decrease in top line revenue for Q1 2021 mainly due to a $1.1 million decrease in PPP fee income. 2. Calculations are annualized. $0.38 $0.71 $1.12 $23,464 $29,311 $28,058 EPS Top Line Revenue Q1 2020 Q4 2020 Q1 2021 (1) 0.00 0.20 0.40 0.60 0.80 1.00 1.20 0 6,000 12,000 18,000 24,000 30,000 36,000

Revenue Growth FBIZ Peer Group (1) '18 '19 '20 '21 (3) 0% 5% 10% 15% 20% 25% Loan Growth FBIZ Peer Group (1) '18 '19 '20 '21 (2) 0% 5% 10% 15% 20% 25% 30% Growth Deliver Above Average Organic Growth Through Expert Business Banking and Specialty Finance Teams 1. Peer Group defined as U.S. Commercial Banks with total assets between $1 billion and $3 billion. 2. Represents annualized growth compared to Q4 2020. 3. Represents growth compared to the three months ended March 31, 2020. 7.3% 3% 10-YR CAGR 11 10.8% 3.0% 10-YR CAGR Deposit Growth FBIZ Peer Group (1) '18 '19 '20 '21 (2) 0% 5% 10% 15% 20% 25% 30% 35% 40% FBIZ 10YR CAGR = 9.4% Peer 10YR CAGR = 4.4% FBIZ 10YR CAGR = 15.5% Peer 10YR CAGR = 4.6% FBIZ 10YR CAGR = 10.6% Peer 10YR CAGR = 3.1%

$ (M ill io n s) $26.6 $28.1 $32.5 $39.1 FYE 2017 FYE 2018 FYE 2019 FYE 2020 $0.0 $15.0 $30.0 $45.0 $60.0 $75.0 $90.0 $105.0 Key Operating Trends Operating Fundamentals Demonstrate Earnings Power 12 Note: Net interest income is the sum of "Pure Net Interest Income" and "Fees in Lieu of Interest". Non-interest income is the sum of "Trust Fee Income", "Other Fee Income", "Service Charges", "SBA Gains", and "Swap Fees". 1. "Pure Net Interest Income" and "Net Operating Income" are non-GAAP measurements. See appendix for non-GAAP reconciliation schedules. 2. "Net Tax Credits" represent managements estimate of the after-tax contribution related to the investment in tax credits as of the reporting period disclosed. 3. "Fees in Lieu of Interest" is defined as prepayment fees, asset-based loan fees, non-accrual interest, and loan fee amortization. Net Operating Income 10YR CAGR = 14% $ (M ill io n s) $7.6 $10.6 Q1 2020 Q1 2021 $0.0 $5.0 $10.0 $15.0 $20.0 $25.0 $30.0

Future Growth and Profitability Potential Higher Profitability Through Growth in Higher Yielding Business Lines 1. Additional financial information on adolescent and mature commercial business lines can be found in the appendix. 2. AUA = Assets Under Advisement 3. AUM&A = Assets Under Management & Administration 4. Represents growth since inception. Floorplan did not have any loans outstanding as of 3/31/2020. 13 Business Life Cycles Early Stage Adolescent Mature Very High Growth & Start Up Losses High Growth & Positive Contribution Sustainable Growth & Highly Profitable Commercial Business Lines (1) Bank Consulting Accounts Receivable Financing Business Banking • YOY AUA2 growth = $422 million or 27% • YOY NFE growth = $1.2 million or 4% • YOY loan growth = $156.6 million or 11% Floorplan Financing SBA Lending Asset-Based Lending • YOY loan growth = $31.7 million4 • PYQ gain on sale increase = $813 thousand or 307% • YOY loan decrease = $4.6 million or 3% Vendor Financing Private Wealth • YOY loan growth = $22.9 million or 40% • YOY AUM&A3 growth = $722 million or 43% Average Loan Yield Specialty Finance Commercial Banking Q1 2021 —% 1.00% 2.00% 3.00% 4.00% 5.00% 6.00% 7.00%

CREDIT

Asset Quality History of Low Net Charge-Offs Through Credit Cycles as a Result of Industry Expertise, Premier Clients, & Consistent Underwriting 15 1. Peer Group defined as U.S. Commercial Banks with total assets between $1 billion and $3 billion. Net Charge-Offs / Average Loans FBIZ Peer Group (1) Great Recession & Pandemic Recession '07 '08 '09 '10 '11 '12 '13 '14 '15 '16 '17 '18 '19 '20 '21(1) -0.50% 0.00% 0.50% 1.00% 1.50% 2.00% 2.50% No data to display In de x V al ue Stock Performance 1/1/2007 - 12/31/2012 FBIZ S&P 500 Bank Index SBA portfolio losses associated with 2014 Kansas City acquisition

Asset Quality Non-Performing Assets/Total Assets Decline as SBA Legacy Portfolio Runs Off 16 Non-Performing Assets NPA/TA (1) 03/31/20 06/30/20 09/30/20 12/31/20 03/31/21 0 6,000 12,000 18,000 24,000 30,000 36,000 42,000 0.75% 0.90% 1.05% 1.20% 1.35% 1.50% 1.65% 1.80% FBIZ TSR 4/30/2020 - 4/29/2021 -30 -20 -10 0 10 20 30 40 50 60 70 1. Total assets excludes PPP loans. 2. Defined as SBA 7(a) and Express off and on-balance sheet loans originated in 2016 and prior. SBA Legacy Performing Loans (2) SBA Legacy Non-Performing Loans (2) 03/31/20 06/30/20 09/30/20 12/31/20 03/31/21 0 10,000 20,000 30,000 40,000 50,000 60,000 70,000 80,000

COVID-19 UPDATE

Paycheck Protection Program ("PPP") Active Participation Propelled by SBA Expertise & Proactive Investments in Technology Leveraged a proprietary client portal to create an efficient and user friendly PPP portal within days of the plan’s announcement CARES Act • 736 applications processed and $340 MILLION funds approved and disbursed within 10 business days of SBA approval • As of May 2, 2021, $187 MILLION, or 55% of round one PPP loans have been forgiven 18 Consolidated Appropriations Act First Draw PPP Loans • 26 applications processed and $7 MILLION funds approved by the Bank • $282,000 average loan request Second Draw PPP Loans • 297 applications processed and $90 MILLION funds approved by the Bank • $304,000 average loan request PPP Processing Fees • $12.6 MILLION collected LTD • $7.5 MILLION earned LTD • $5.1 MILLION unearned • $2.2 MILLION earned YTD
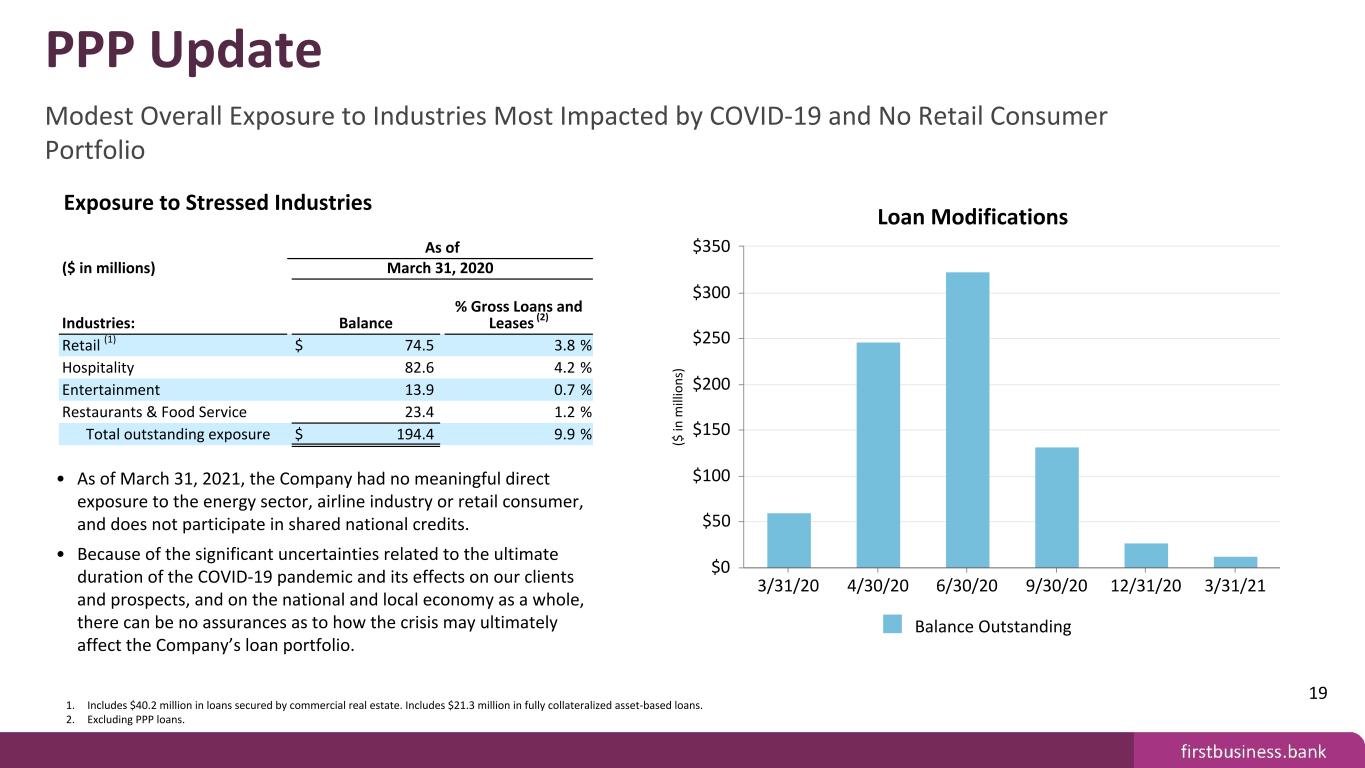
($ in m ill io n s) Loan Modifications Balance Outstanding 3/31/20 4/30/20 6/30/20 9/30/20 12/31/20 3/31/21 $0 $50 $100 $150 $200 $250 $300 $350 PPP Update Modest Overall Exposure to Industries Most Impacted by COVID-19 and No Retail Consumer Portfolio 19 • As of March 31, 2021, the Company had no meaningful direct exposure to the energy sector, airline industry or retail consumer, and does not participate in shared national credits. • Because of the significant uncertainties related to the ultimate duration of the COVID-19 pandemic and its effects on our clients and prospects, and on the national and local economy as a whole, there can be no assurances as to how the crisis may ultimately affect the Company’s loan portfolio. As of ($ in millions) March 31, 2020 Industries: Balance % Gross Loans and Leases (2) Retail (1) $ 74.5 3.8 % Hospitality 82.6 4.2 % Entertainment 13.9 0.7 % Restaurants & Food Service 23.4 1.2 % Total outstanding exposure $ 194.4 9.9 % Exposure to Stressed Industries 1. Includes $40.2 million in loans secured by commercial real estate. Includes $21.3 million in fully collateralized asset-based loans. 2. Excluding PPP loans.

VALUATION

Tangible Book Value & Dividend Growth History of steady, consistent growth 1. 2021 TBV/Share represents data as of March 31, 2021. 2021 Dividends/Share represents annualized data for March 31, 2021. Great Recession & Pandemic Recession TBV/Share Div/Share '06 '07 '08 '09 '10 '11 '12 '13 '14 '15 '16 '17 '18 '19 '20 '21(1) $0.00 $5.00 $10.00 $15.00 $20.00 $25.00 $30.00 $0.20 $0.30 $0.40 $0.50 $0.60 $0.70 $0.80 TBV 14YR CAGR = 7.2% Div/Share 14YR CAGR = 7.5% 21 Example Total Return Performance ABC Company NASDAQ Composite '06 '07 '08 '09 '10 '11 '12 '13 '14 '15 '16 '17 '18 '19 '20 '21(1) — 5 10 15 20 25 — 0.2 0.4 0.6 0.8 1 TBV/Share Div/Share Great Recession & Pandemic Recession '06 '07 '08 '09 '10 '11 '12 '13 '14 '15 '16 '17 '18 '19 '20 '21(1) $8 $10 $13 $15 $18 $20 $23 $25

Trading at Discount to Peer Group Price / Tangible Book Value 1. Uses 5/3/2021 closing stock price of $27.24/share. Note: Peer Group defined as publicly-traded banks with total assets between $1 billion and $4 billion. 22 Consensus 2021 P/E(1) = 7.5x Consensus 2022 P/E(1) = 8.8x Current Price1 to TBV = 1.16x

Note: Peer Group defined as publicly-traded banks with total assets between $1 billion and $4 billion. Dividend Yield Above Peer Group Median 23 On January 29th, 2021, FBIZ announced a 9% increase in its quarterly dividend rate. This represents the 9th consecutive annual dividend increase.

•Organic growth remains the foundation for the future • Scale Private Wealth Management business in current markets outside of Madison • Significant commercial loan growth opportunity augmented by niche specialty finance lending programs •Demonstrated ability to grow in-market deposits commensurate with robust loan growth •Opportunity to increase market share in the Kansas City metro, Northeast and Southeast Wisconsin regions Scalable Franchise Positioned for Sustainable Growth 24

STRATEGIC PLAN

FBIZ Strategic Plan 2019-2023 4 Strategies Designed to Navigate the Company over a 5-Year Time Horizon 26

FBIZ Strategic Plan 2019-2023 Goals Set to Deliver Above Average Shareholder Return 27 Goal Actual 2018 Actual 2019 Actual 2020 Actual 2021 Goal 2023 Return on average equity (1) 9.41% 12.55% 8.64% 18.48% 13.50% Return on average assets (1) 0.86% 1.14% 0.70% 1.51% 1.15% Top line revenue growth 10.70% 9.10% 11.50% 19.58%3 ≥ 10% per year In-market deposits to total bank funding 68.20% 75.50% 74.80% 74.93% ≥ 70% Fee income ratio 21.20% 25.10% 25.90% 25.64% 25% Specialty finance loan mix 16.60% 17.40% 17.00% 17.80% 25% Employee engagement (2) 81% 82% 91% N/A ≥ 80% Client satisfaction (2) 91% 93% 96% N/A ≥ 90% 1. 2021 represents annualized data for the three months ended March 31, 2021. 2. Surveys conducted annually. 3. Growth is compared to the three months ended March 31, 2020

APPENDIX SUPPLEMENTAL DATA & NON-GAAP RECONCILIATIONS

APPENDIX Commercial Banking Products & Services
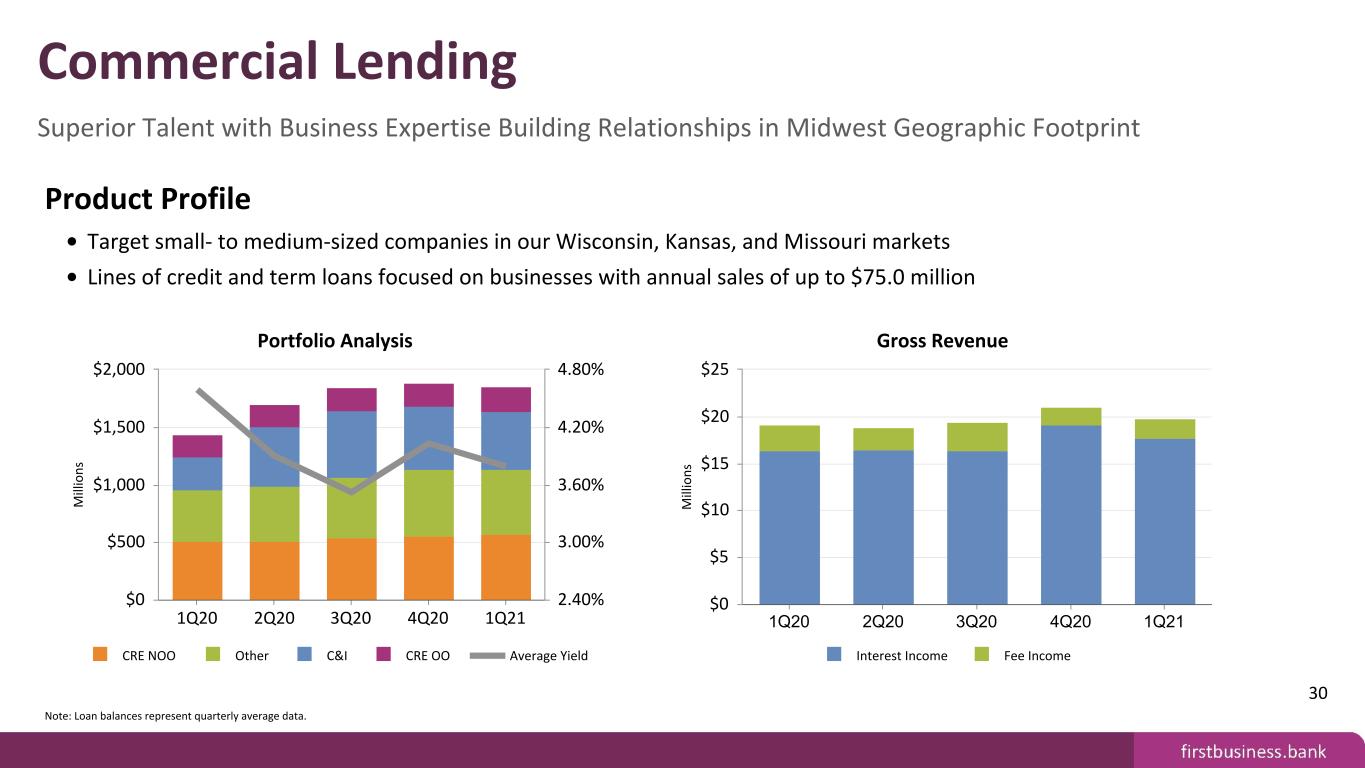
Product Profile • Target small- to medium-sized companies in our Wisconsin, Kansas, and Missouri markets • Lines of credit and term loans focused on businesses with annual sales of up to $75.0 million M ill io n s Portfolio Analysis CRE NOO Other C&I CRE OO Average Yield 1Q20 2Q20 3Q20 4Q20 1Q21 $0 $500 $1,000 $1,500 $2,000 2.40% 3.00% 3.60% 4.20% 4.80% M ill io n s Gross Revenue Interest Income Fee Income 1Q20 2Q20 3Q20 4Q20 1Q21 $0 $5 $10 $15 $20 $25 Note: Loan balances represent quarterly average data. 30 Commercial Lending Superior Talent with Business Expertise Building Relationships in Midwest Geographic Footprint

Product Profile • Target small- to medium-sized companies in our Wisconsin, Kansas, and Missouri markets • Comprehensive services for commercial clients to manage their cash and liquidity, including lockbox, accounts receivable collection services, electronic payment solutions, fraud protection, information reporting, reconciliation, and data integration solutions M ill io n s Funding Mix Non-Transaction Accounts Transaction Accounts Bank Wholesale Funding Cost of Funds 1Q20 2Q20 3Q20 4Q20 1Q21 $0 $600 $1,200 $1,800 $2,400 0.00% 0.50% 1.00% 1.50% 2.00% M ill io n s Fee Revenue 1Q20 2Q20 3Q20 4Q20 1Q21 $0.5 $0.6 $0.7 $0.8 $0.9 $1 Note: Funding mix represents quarterly average balance data. Transaction Accounts include interest-bearing DDA, non-interest-bearing DDA and NOW accounts. Bank Wholesale Funding includes brokered deposits, deposits gathered through internet listing services, FHLB advances, and the Federal Reserve PPPLF. Non-Transaction Accounts includes in-market CDs and money market accounts. "Cost of Funds" is a non-GAAP measure. See appendix for non-GAAP reconciliation schedules. 31 Treasury Management Superior Talent with Business Expertise Building Relationships in Midwest Geographic Footprint

Product Profile • Fiduciary and investment manager for individual and corporate clients, creating, and executing asset allocation strategies tailored to each client’s unique situation • Full fiduciary powers and offers trust, estate, financial planning, and investment services, acting in a trustee or agent capacity as well as Employee Benefit/Retirement Plan services • Also includes brokerage and custody-only services, for which we administer and safeguard assets but do not provide investment advice M ill io n s Assets Under Management & Administration Private Wealth Employee Benefits Other 1Q20 2Q20 3Q20 4Q20 1Q21 $0 $500 $1,000 $1,500 $2,000 $2,500 $3,000 M ill io n s Fee Revenue 1Q20 2Q20 3Q20 4Q20 1Q21 $0 $0.5 $1 $1.5 $2 $2.5 $3 Note: Total Assets Under Management & Administration represent period-end balances. 32 Trust / Private Wealth Wealth Management Services for Businesses, Executives, and High Net Worth Individuals

Product Profile • Target medium-sized companies nationwide • Primarily provide revolving lines of credit and term loans for leveraged buyouts, capital expenditures, working capital, bank debt refinancing, debt restructuring, corporate turnaround strategies and debtor-in-possession financing in the course of bankruptcy proceedings or the exit therefrom • Positioned to provide cost-effective financing solutions to companies who do not have the established stable cash flows necessary to qualify for traditional commercial lending products • Financings generally range between $1.0 million and $10.0 million with terms of 24 to 60 months M ill io n s Portfolio Analysis Average Gross Loans Average Yield 1Q20 2Q20 3Q20 4Q20 1Q21 $0 $25 $50 $75 $100 $125 $150 $175 4.00% 6.00% 8.00% 10.00% M ill io n s Gross Revenue Interest Income Fees in Lieu of Interest Fee Income 1Q20 2Q20 3Q20 4Q20 1Q21 $0 $1 $2 $3 $4 Note: Loan balances represent quarterly average data. 33 Asset-Based Lending High-Yielding, Counter-Cyclical Product Complements Conventional Commercial Lending

Product Profile • Target small- to medium-sized companies nationwide • Primarily provide funding to clients by purchasing accounts receivable on a full recourse basis • Positioned to provide competitive rates to clients starting up, seeking growth, and needing cash flow support, or who are experiencing financial issues • Similar to asset-based lending, receivable financing typically generates higher yields than conventional commercial lending and complements our conventional commercial portfolio M ill io n s Portfolio Analysis Average NFE Average Yield 1Q20 2Q20 3Q20 4Q20 1Q21 $0 $5 $10 $15 $20 $25 $30 $35 $40 0.00% 5.00% 10.00% 15.00% M ill io n s Gross Revenue Interest Income Fees in Lieu of Interest Fee Income 1Q20 2Q20 3Q20 4Q20 1Q21 $0 $0.25 $0.5 $0.75 $1 Note: Average Net Funds Employed balances represent quarterly average data. 34 Accounts Receivable Financing High-Yielding, Counter-Cyclical Product Complements Conventional Commercial Lending

Product Profile • Primarily originate variable rate term loans through the 7(a) program which typically provides a guaranty of 75% of principal and interest • Product offering is designed to generate new business opportunities by meeting the needs of clients whose borrowing needs cannot be met with conventional bank loans • Sources of revenue include interest income on the retained portion of loan, gain on sale of the guaranteed portion of loan, loan packaging fee income, and loan servicing fee income M ill io n s Portfolio Analysis Total Retained Total Sold Average Yield 1Q20 2Q20 3Q20 4Q20 1Q21 $0 $25 $50 $75 $100 $125 $150 $175 $200 1.60% 3.20% 4.80% 6.40% 8.00% M ill io n s Gross Revenue Interest Income Gain on Sale Servicing Fees Packaging Fees 1Q20 2Q20 3Q20 4Q20 1Q21 $0 $1 $2 $3 Note: Total Retained and Total Sold represent period-end balances. Excludes PPP loans and related interest income and loan fee amortization. 35 SBA Lending & Servicing Full Client Acquisition Strategy for Small Businesses Non-accrual interest recovery of $340K in 2Q20

Product Profile • Includes broad range of equipment finance products to address the financing needs of commercial clients in a variety of industries • Focus includes manufacturing equipment, industrial assets, construction, and transportation equipment, and a wide variety of other commercial equipment • Financings generally < $250,000 with 48 month terms M ill io n s Portfolio Analysis Average Gross Loans & Leases Average Yield 1Q20 2Q20 3Q20 4Q20 1Q21 $0 $10 $20 $30 $40 $50 $60 $70 $80 $90 $100 6.00% 5.60% 6.40% 6.80% M ill io n s Gross Revenue Interest Income Fee Income 1Q20 2Q20 3Q20 4Q20 1Q21 $0 $0.5 $1 $1.5 Note: Loan and lease balances represent quarterly average data. 36 Vendor Finance Aligned with the Equipment Loan and Lease Needs of our Niche Client Base

NON-GAAP RECONCILIATIONS

"Pure Net Interest Income" is defined as net interest income less fees in lieu of interest. "Fees in Lieu of Interest" is defined as prepayment fees, asset-based loan fees, non-accrual interest, and loan fee amortization. We believe that this measure is important to many investors in the marketplace who are interested in the trends in our net interest margin. In compliance with applicable rules of the SEC, this non-GAAP measure is reconciled to net interest income, which is the most directly comparable GAAP financial measure. For the Three Months Ended For the Year Ended (Dollars in Thousands) March 31, 2020 March 31, 2021 December 31, 2017 December 31, 2018 December 31, 2019 December 31, 2020 Net interest income $ 17,050 $ 20,863 $ 60,609 $ 67,342 $ 69,856 $ 77,071 Less fees in lieu of interest 798 3,085 3,801 5,592 6,478 9,317 Pure net interest income (non-GAAP) $ 16,252 $ 17,778 $ 56,808 $ 61,750 $ 63,378 $ 67,754 38 Pure Net Interest Income Non-GAAP Reconciliation

"Net Operating Income" is a non-GAAP financial measure. We believe net operating income allows investors to better assess the Company’s operating expenses in relation to its top line revenue by removing the volatility that is associated with certain one-time and other discrete items. In compliance with applicable rules of the SEC, this non-GAAP measure is reconciled to net income, which is the most directly comparable GAAP financial measure. For the Three Months Ended For the Year Ended (Dollars in thousands) March 31, 2020 March 31, 2021 December 31, 2017 December 31, 2018 December 31, 2019 December 31, 2020 Net income $ 3,278 $ 9,731 $ 11,905 $ 16,303 $ 23,324 $ 16,978 Less income tax (expense) benefit (858) (3,065) (2,326) (1,351) (1,175) (1,327) Less provision for loan and lease losses (3,182) 2,068 (6,172) (5,492) (2,085) (16,808) Income before taxes and provision for loan and lease losses (non-GAAP) 7,318 10,728 20,403 23,146 26,584 35,113 Less non-operating income Net gain on sale of state tax credits — — — — — 275 Net gain (loss) on sale of securities (4) — (403) (4) (46) (4) Total non-operating income (non-GAAP) (4) — (403) (4) (46) 271 Less non-operating expense Net loss (gain) on foreclosed properties 102 3 (143) 367 224 383 Amortization of other intangible assets 9 8 54 47 40 35 SBA recourse provision (benefit) 25 (130) 2,240 1,913 188 (278) Tax credit investment impairment 113 — 2,784 2,083 4,094 2,395 Loss on early extinguishment of debt — — — — — 744 Deconversion fees — — 300 — — — Total non-operating expense (non-GAAP) 249 (119) 5,235 4,410 4,546 3,279 Add net tax credit benefit (non-GAAP) 8 — 526 494 1,352 969 Net operating income $ 7,579 $ 10,609 $ 26,567 $ 28,054 $ 32,528 $ 39,090 39 Net Operating Income Non-GAAP Reconciliation
