Attached files
| file | filename |
|---|---|
| 8-K - FORM 8-K - LAKELAND FINANCIAL CORP | tm2115074d1_8k.htm |
Exhibit 99.1
A Proven History of Shareholder Value Creation And Commitment to Our Communities 1 st Quarter 2021 Lakeland Financial Corporation LKFN LISTED
David M. Findlay President & Chief Executive Officer david.findlay@lakecitybank.com (574) 267 - 9197 Lisa M. O’Neill Executive Vice President & Chief Financial Officer lisa.oneill@lakecitybank.com (574) 267 - 9125 2
This presentation contains, and future oral and written statements of the Company and its management may contain, forward - looking statements within the meaning of the Private Securities Litigation Reform Act of 1995 with respect to the financial condition, results of operations, plans, objectives, future performance and business of the Company. Forward - looking statements are generally identifiable by the use of words such as “believe”, “expect”, “anticipate”, “estimate”, “could”, and other similar expressions. All statements in this presentation, including forward - looking statements, speak only as of today’s date, and the Company undertakes no obligation to update any statement in light of new information or future events. A number of factors, many of which are beyond the ability of the Company to control or predict, could cause actual results to differ materially from those in its forward - looking statements. Additional information is included in the Company’s filings with the Securities and Exchange Commission. Factors that could have a material adverse effect on the Company’s financial condition, results of operations and future prospects can be found in the “Risk Factors” section of the prospectus included in the Registration Statement on Form S - 1 filed on October 26, 2009, as amended under Item 1A “Risk Factors” in the Company’s Annual Report on Form 10 - K for the year ended December 31, 2008 and elsewhere in the Company’s periodic and current reports filed with the Securities and Exchange Commission. These factors include, but are not limited to, the effects of future economic, business and market conditions and changes, domestic and foreign, including competition, governmental policies and seasonality; legislative and regulatory changes, including changes in banking, securities and tax laws and regulations and their application by Company regulators, and changes in the scope and cost of FDIC insurance and other coverages; the risks of changes in interest rates on the levels, composition and costs of deposits, loan demand and other interest sensitive assets and liabilities; the failure of assumptions and estimates underlying the establishment of reserves for possible loan losses, analysis of capital needs and other estimates; changes in borrowers’ credit risks and payment behaviors; and changes in the availability and cost of credit and capital in the financial markets. Forward - Looking Information 3
4
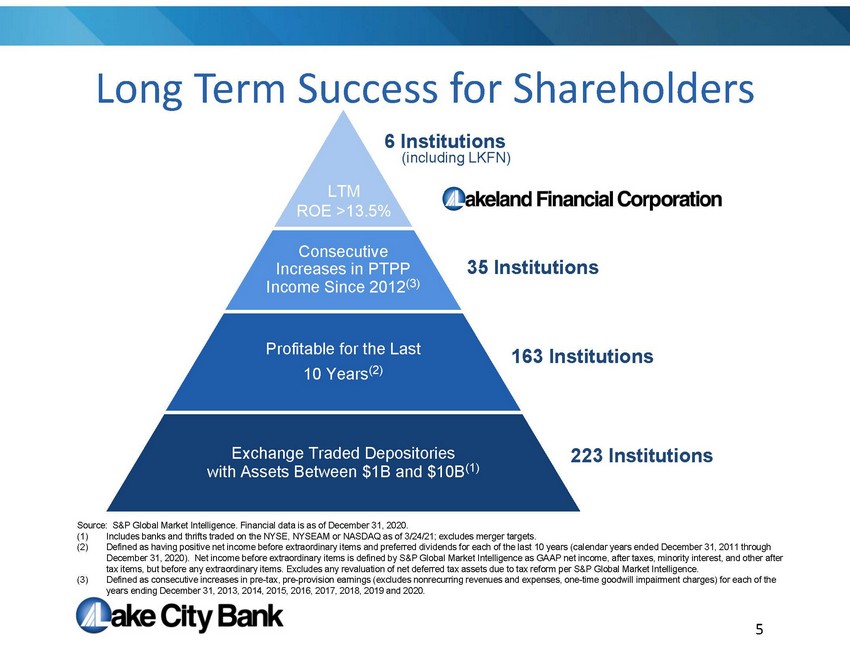
Consecutive Increases in PTPP Income Since 2012 (3) Profitable for the Last 10 Years (2) Exchange Traded Depositories with Assets Between $1B and $10B (1) 6 Institutions 35 Institutions 163 Institutions 223 Institutions (including LKFN) 5 Long Term Success for Shareholders Source: S&P Global Market Intelligence. Financial data is as of December 31, 2020. (1) Includes banks and thrifts traded on the NYSE, NYSEAM or NASDAQ as of 3/24/21; excludes merger targets. (2) Defined as having positive net income before extraordinary items and preferred dividends for each of the last 10 years (calen dar years ended December 31, 2011 through December 31, 2020). Net income before extraordinary items is defined by S&P Global Market Intelligence as GAAP net income, a fte r taxes, minority interest, and other after tax items, but before any extraordinary items. Excludes any revaluation of net deferred tax assets due to tax reform per S&P Glo bal Market Intelligence. (3) Defined as consecutive increases in pre - tax, pre - provision earnings (excludes nonrecurring revenues and expenses, one - time goodw ill impairment charges) for each of the years ending December 31, 2013, 2014, 2015, 2016, 2017, 2018, 2019 and 2020. LTM ROE >13.5%
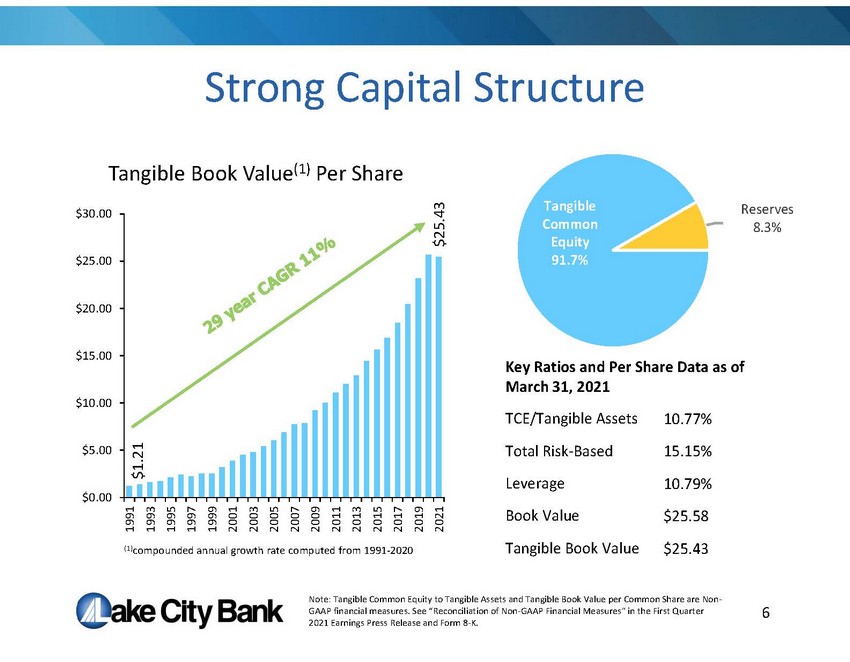
Strong Capital Structure 6 Tangible Common Equity 91.7% Reserves 8.3% $1.21 $25.43 $0.00 $5.00 $10.00 $15.00 $20.00 $25.00 $30.00 1991 1993 1995 1997 1999 2001 2003 2005 2007 2009 2011 2013 2015 2017 2019 2021 Tangible Book Value (1) Per Share (1) compounded annual growth rate computed from 1991 - 2020 Key Ratios and Per Share Data as of March 31, 2021 TCE/Tangible Assets 10.77% Total Risk - Based 15.15% Leverage 10.79% Book Value $25.58 Tangible Book Value $25.43 Note: Tangible Common Equity to Tangible Assets and Tangible Book Value per Common Share are Non - GAAP financial measures. See “Reconciliation of Non - GAAP Financial Measures” in the First Quarter 2021 Earnings Press Release and Form 8 - K.
7 COVID - 19 Crisis Management • Active Credit Risk Management • COVID - 19 Related Loan Deferrals • Paycheck Protection Program
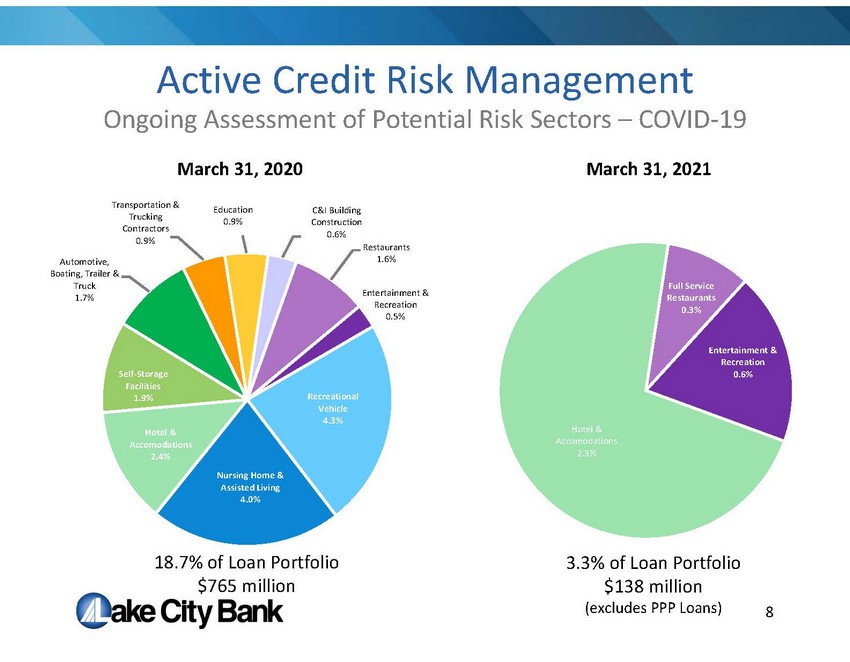
Active Credit Risk Management Recreational Vehicle 4.3% Nursing Home & Assisted Living 4.0% Hotel & Accomodations 2.4% Self - Storage Facilities 1.9% Automotive, Boating, Trailer & Truck 1.7% Transportation & Trucking Contractors 0.9% Education 0.9% C&I Building Construction 0.6% Restaurants 1.6% Entertainment & Recreation 0.5% 18.7% of Loan Portfolio $765 million Ongoing Assessment of Potential Risk Sectors – COVID - 19 Hotel & Accomodations 2.3% Full Service Restaurants 0.3% Entertainment & Recreation 0.6% March 31, 2020 March 31, 2021 3.3% of Loan Portfolio $138 million (excludes PPP Loans) 8
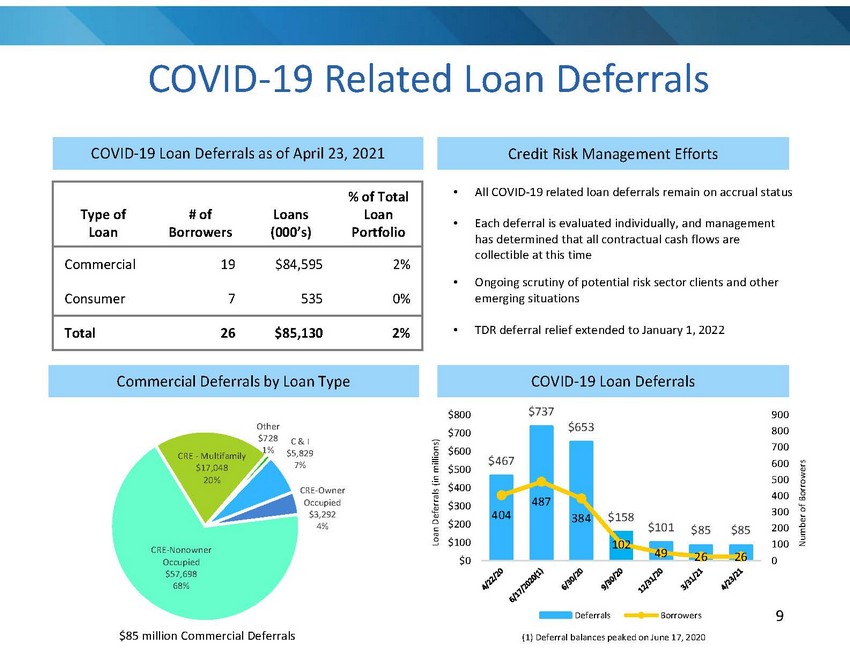
$467 $737 $653 $158 $101 $85 $85 404 487 384 102 49 26 26 0 100 200 300 400 500 600 700 800 900 $0 $100 $200 $300 $400 $500 $600 $700 $800 Deferrals Borrowers COVID - 19 Related Loan Deferrals COVID - 19 Loan Deferrals as of April 23, 2021 Credit Risk Management Efforts Type of Loan # of Borrowers Loans (000’s) % of Total Loan Portfolio Commercial 19 $84,595 2% Consumer 7 535 0% Total 26 $85,130 2% • All COVID - 19 related loan deferrals remain on accrual status • Each deferral is evaluated individually, and management has determined that all contractual cash flows are collectible at this time • Ongoing scrutiny of potential risk sector clients and other emerging situations • TDR deferral relief extended to January 1, 2022 COVID - 19 Loan Deferrals Loan Deferrals (in millions) Number of Borrowers (1) Deferral balances peaked on June 17, 2020 C & I $5,829 7% CRE - Owner Occupied $3,292 4% CRE - Nonowner Occupied $57,698 68% CRE - Multifamily $17,048 20% Other $728 1% $85 million Commercial Deferrals Commercial Deferrals by Loan Type 9
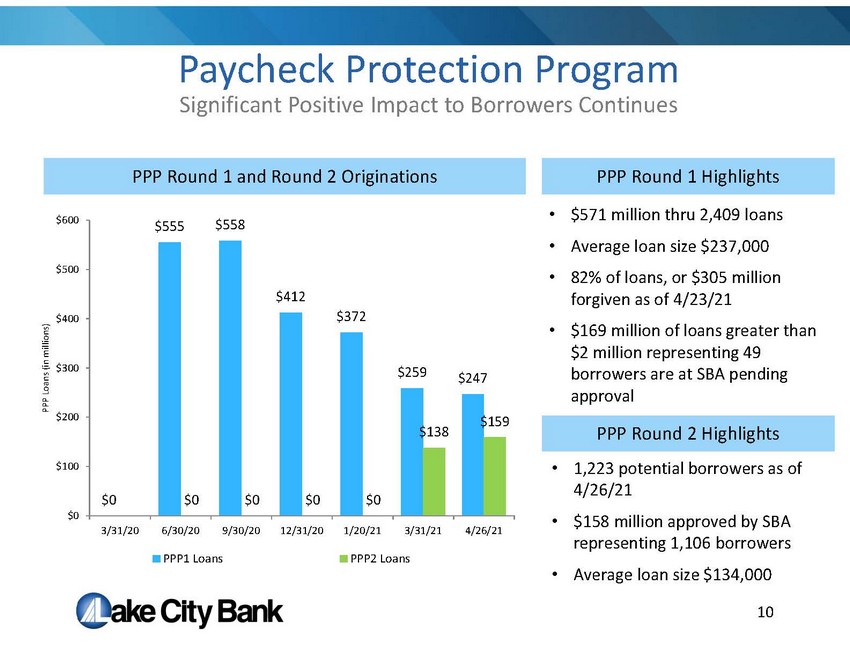
• 1,223 potential borrowers as of 4/26/21 • $158 million approved by SBA representing 1,106 borrowers • Average loan size $134,000 10 Paycheck Protection Program Significant Positive Impact to Borrowers Continues • $571 million thru 2,409 loans • Average loan size $237,000 • 82% of loans, or $305 million forgiven as of 4/23/21 • $169 million of loans greater than $2 million representing 49 borrowers are at SBA pending approval PPP Round 1 and Round 2 Originations PPP Round 1 Highlights PPP Round 2 Highlights $0 $555 $558 $412 $372 $259 $247 $0 $0 $0 $0 $0 $138 $159 $0 $100 $200 $300 $400 $500 $600 3/31/20 6/30/20 9/30/20 12/31/20 1/20/21 3/31/21 4/26/21 PPP Loans (in millions) PPP1 Loans PPP2 Loans
Lake City Bank Today • A long - term and consistent organic growth story • Headquartered in Warsaw, Indiana • 50 branch offices - $6.0 billion banking assets - $2.7 billion trust and investment brokerage assets • Focused on execution – “blocking and tackling” • Continued growth potential 11
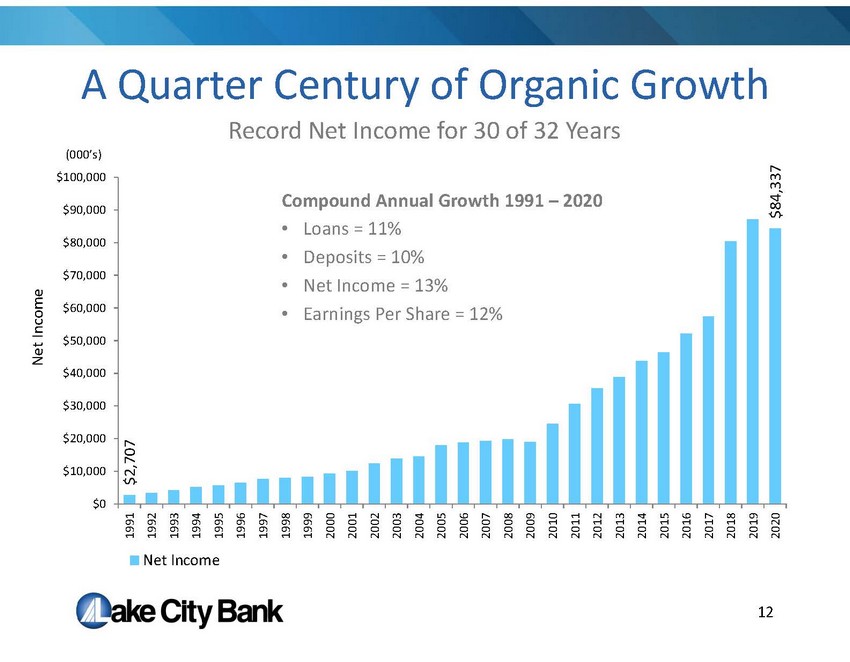
A Quarter Century of Organic Growth 12 $2,707 $84,337 $0 $10,000 $20,000 $30,000 $40,000 $50,000 $60,000 $70,000 $80,000 $90,000 $100,000 1991 1992 1993 1994 1995 1996 1997 1998 1999 2000 2001 2002 2003 2004 2005 2006 2007 2008 2009 2010 2011 2012 2013 2014 2015 2016 2017 2018 2019 2020 Net Income Compound Annual Growth 1991 – 2020 • Loans = 11% • Deposits = 10% • Net Income = 13% • Earnings Per Share = 12% Record Net Income for 30 of 32 Years (000’s) Net Income
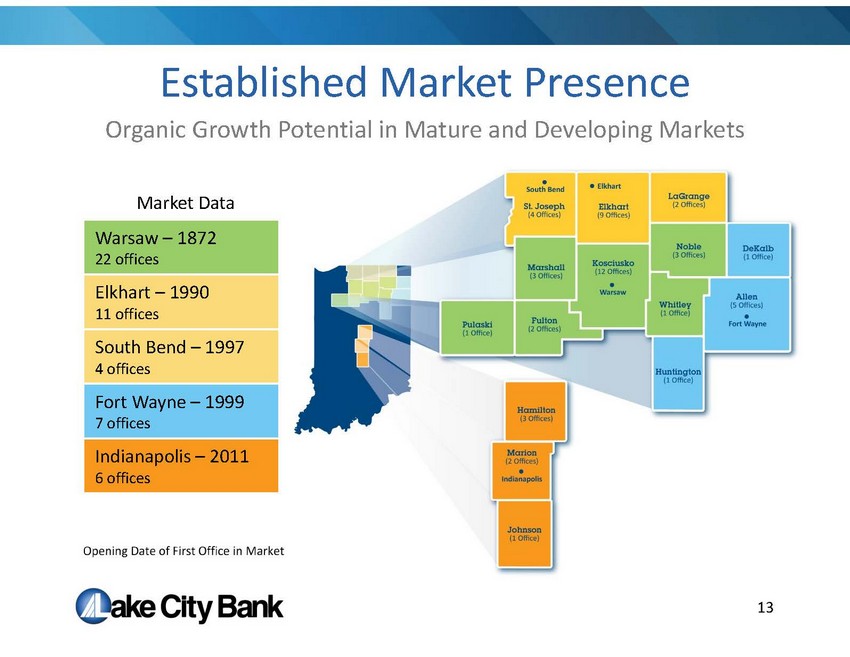
Established Market Presence Organic Growth Potential in Mature and Developing Markets 13 Market Data Warsaw – 1872 22 offices Elkhart – 1990 11 offices South Bend – 1997 4 offices Fort Wayne – 1999 7 offices Indianapolis – 2011 6 offices
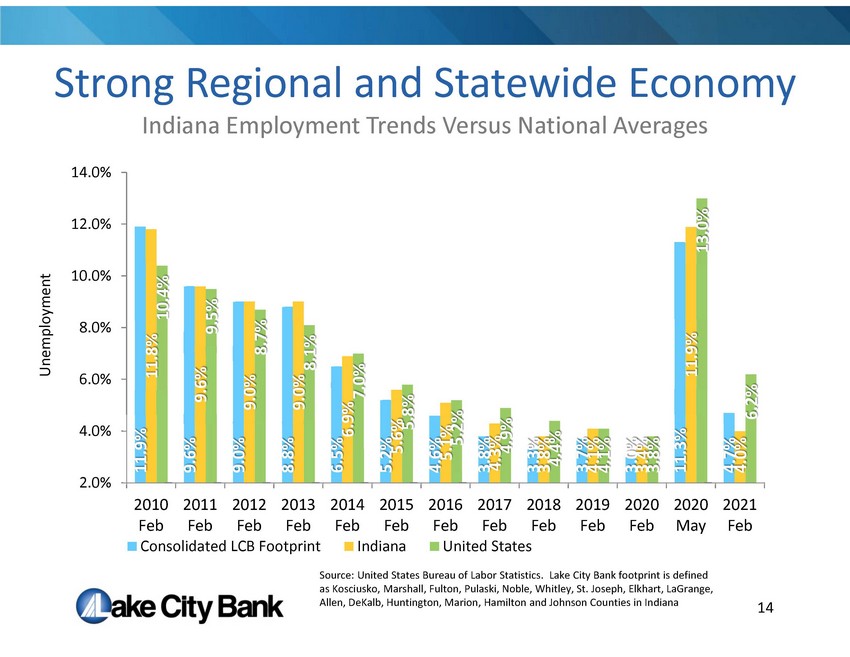
Strong Regional and Statewide Economy Indiana Employment Trends Versus National Averages 14 11.9% 9.6% 9.0% 8.8% 6.5% 5.2% 4.6% 3.8% 3.3% 3.7% 3.0% 11.3% 4.7% 11.8% 9.6% 9.0% 9.0% 6.9% 5.6% 5.1% 4.3% 3.8% 4.1% 3.4% 11.9% 4.0% 10.4% 9.5% 8.7% 8.1% 7.0% 5.8% 5.2% 4.9% 4.4% 4.1% 3.8% 13.0% 6.2% 2.0% 4.0% 6.0% 8.0% 10.0% 12.0% 14.0% 2010 Feb 2011 Feb 2012 Feb 2013 Feb 2014 Feb 2015 Feb 2016 Feb 2017 Feb 2018 Feb 2019 Feb 2020 Feb 2020 May 2021 Feb Consolidated LCB Footprint Indiana United States Source: United States Bureau of Labor Statistics. Lake City Bank footprint is defined as Kosciusko, Marshall, Fulton, Pulaski, Noble, Whitley, St. Joseph, Elkhart, LaGrange, Allen, DeKalb, Huntington, Marion, Hamilton and Johnson Counties in Indiana Unemployment
Shareholder Value Strategy 15 1. Commercial Banking Focus 2. High Quality Team Members 3. Proven Organic Growth Experience 4. Focus on Core Deposit Funding 5. Commitment to Technology
• 41 credit “smart” commercial bankers • Average 20 years in banking & 11 years at Lake City Bank • We live where we lend • Face to face calling matters and is a team effort • We understand our client needs • Deep organizational structure provides credit and administrative support • We cross - sell aggressively by leveraging technology Experienced Relationship Driven Team Commercial Banking Focus 16
Credit Process • We are in - market lender to in - market clients • Character matters – we lend to people first • Our credit discipline has never changed • We focus on management/cash flow • We have a centralized committee structure • Structure is important • Orientation towards owner - occupied and well structured nonowner occupied real estate 17 Commercial Banking Focus
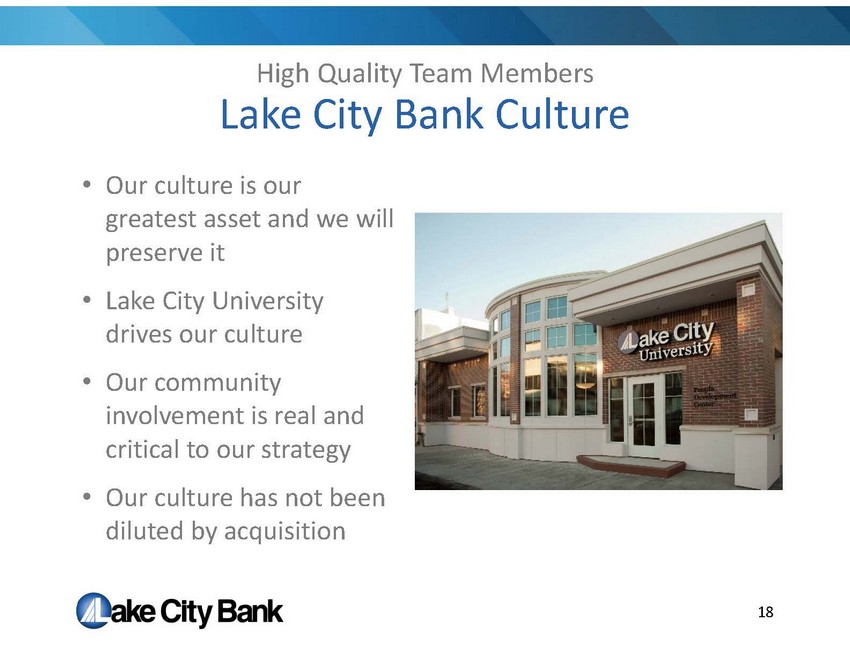
Lake City Bank Culture • Our culture is our greatest asset and we will preserve it • Lake City University drives our culture • Our community involvement is real and critical to our strategy • Our culture has not been diluted by acquisition 18 High Quality Team Members
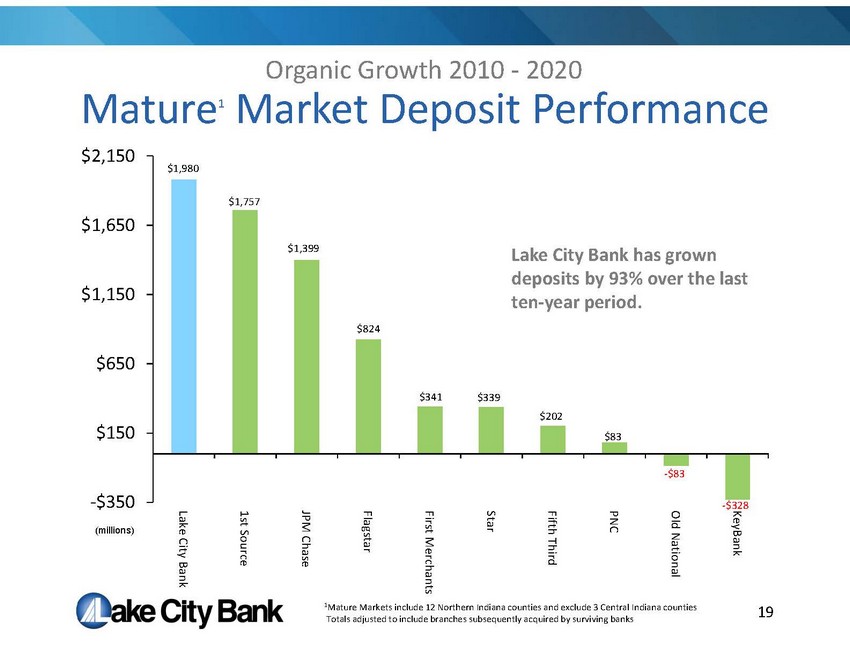
Mature 1 Market Deposit Performance $1,980 $1,757 $1,399 $824 $341 $339 $202 $83 - $83 - $328 -$350 $150 $650 $1,150 $1,650 $2,150 Lake City Bank 1st Source JPM Chase Flagstar First Merchants Star Fifth Third PNC Old National KeyBank Organic Growth 2010 - 2020 1 Mature Markets include 12 Northern Indiana counties and exclude 3 Central Indiana counties Totals adjusted to include branches subsequently acquired by surviving banks 19 Lake City Bank has grown deposits by 93% over the last ten - year period. (millions)
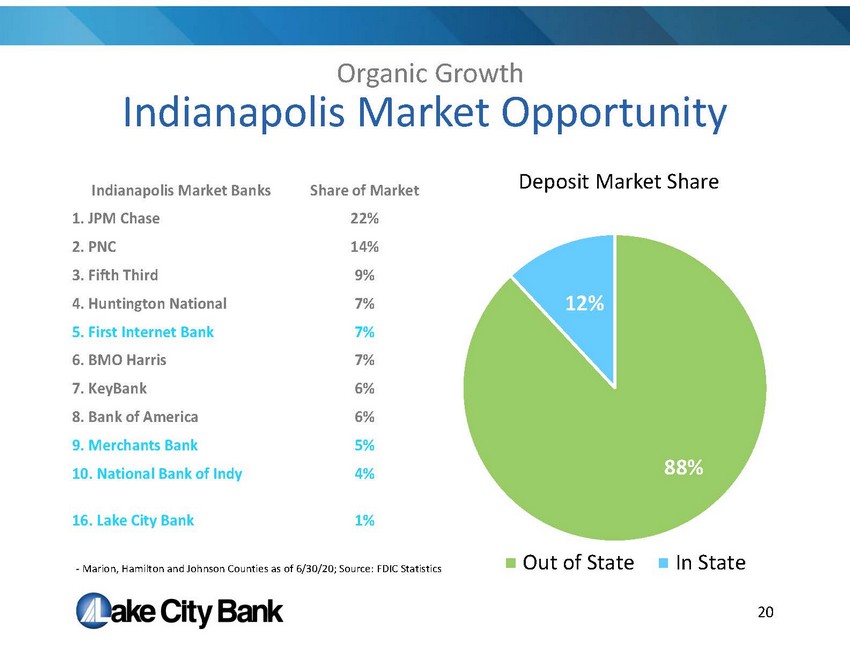
Organic Growth 20 Indianapolis Market Opportunity Indianapolis Market Banks Share of Market 1. JPM Chase 22% 2. PNC 14% 3. Fifth Third 9% 4. Huntington National 7% 5. First Internet Bank 7% 6. BMO Harris 7% 7. KeyBank 6% 8. Bank of America 6% 9. Merchants Bank 5% 10. National Bank of Indy 4% 16. Lake City Bank 1% 88% 12% Out of State In State - Marion, Hamilton and Johnson Counties as of 6/30/20; Source: FDIC Statistics Deposit Market Share
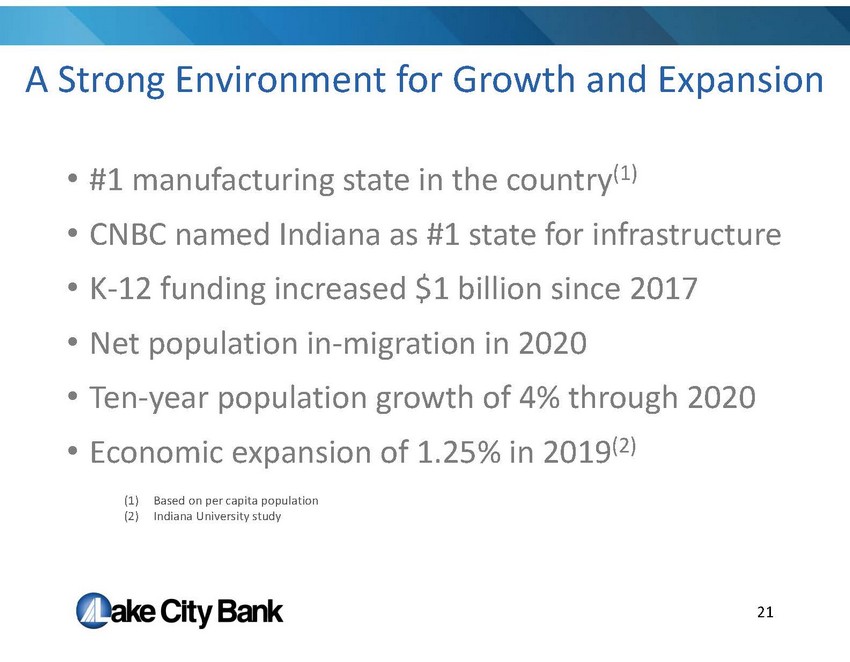
21 A Strong Environment for Growth and Expansion • #1 manufacturing state in the country (1) • CNBC named Indiana as #1 state for infrastructure • K - 12 funding increased $1 billion since 2017 • Net population in - migration in 2020 • Ten - year population growth of 4% through 2020 • Economic expansion of 1.25% in 2019 (2) (1) Based on per capita population (2) Indiana University study
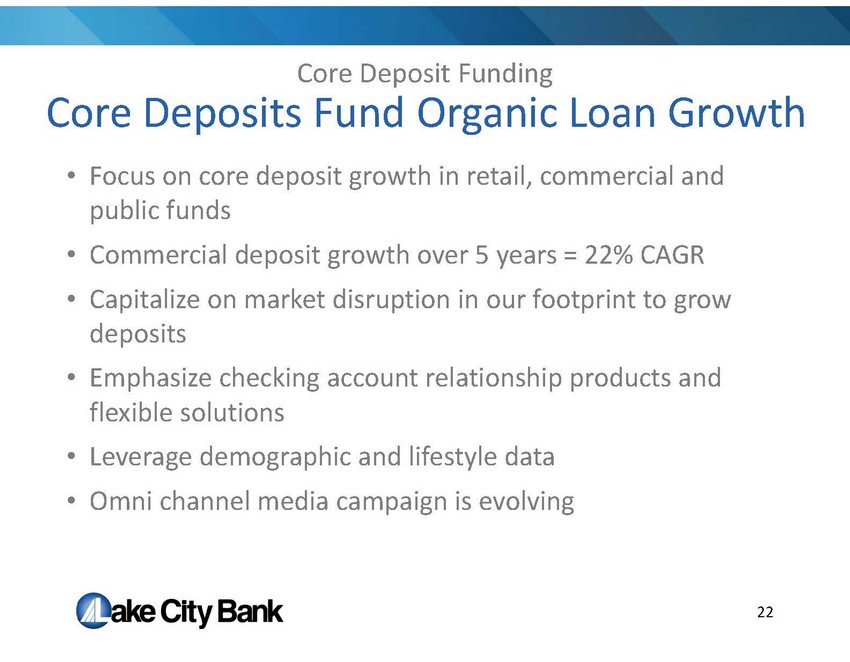
22 Core Deposits Fund Organic Loan Growth • Focus on core deposit growth in retail, commercial and public funds • Commercial deposit growth over 5 years = 22% CAGR • Capitalize on market disruption in our footprint to grow deposits • Emphasize checking account relationship products and flexible solutions • Leverage demographic and lifestyle data • Omni channel media campaign is evolving Core Deposit Funding
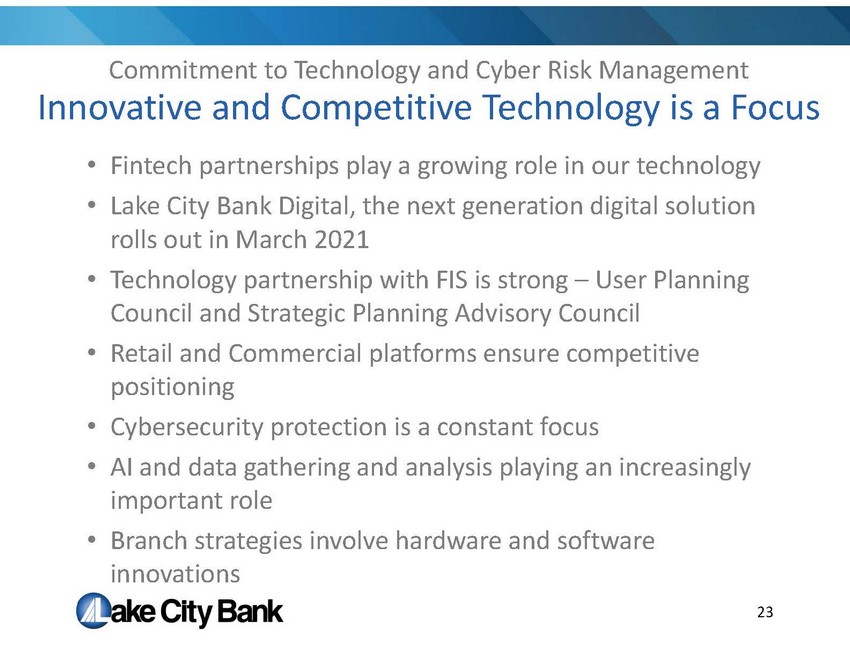
• Fintech partnerships play a growing role in our technology • Lake City Bank Digital, the next generation digital solution rolls out in March 2021 • Technology partnership with FIS is strong – User Planning Council and Strategic Planning Advisory Council • Retail and Commercial platforms ensure competitive positioning • Cybersecurity protection is a constant focus • AI and data gathering and analysis playing an increasingly important role • Branch strategies involve hardware and software innovations 23 Innovative and Competitive Technology is a Focus Commitment to Technology and Cyber Risk Management
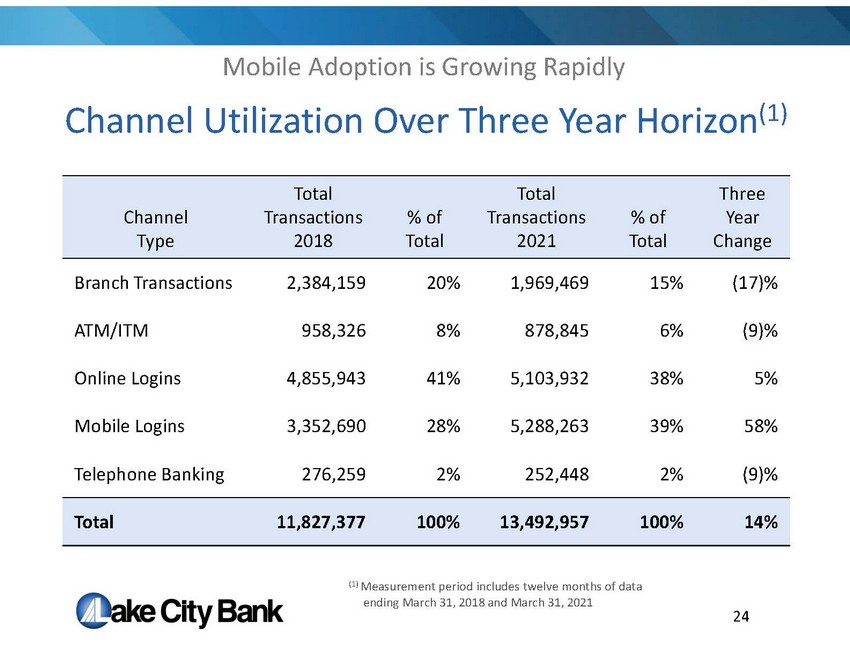
Mobile Adoption is Growing Rapidly 24 Channel Utilization Over Three Year Horizon (1) Channel Type Total Transactions 2018 % of Total Total Transactions 2021 % of Total Three Year Change Branch Transactions 2,384,159 20% 1,969,469 15% (17)% ATM/ITM 958,326 8% 878,845 6% (9)% Online Logins 4,855,943 41% 5,103,932 38% 5% Mobile Logins 3,352,690 28% 5,288,263 39% 58% Telephone Banking 276,259 2% 252,448 2% (9)% Total 11,827,377 100% 13,492,957 100% 14% (1) Measurement period includes twelve months of data ending March 31, 2018 and March 31, 2021
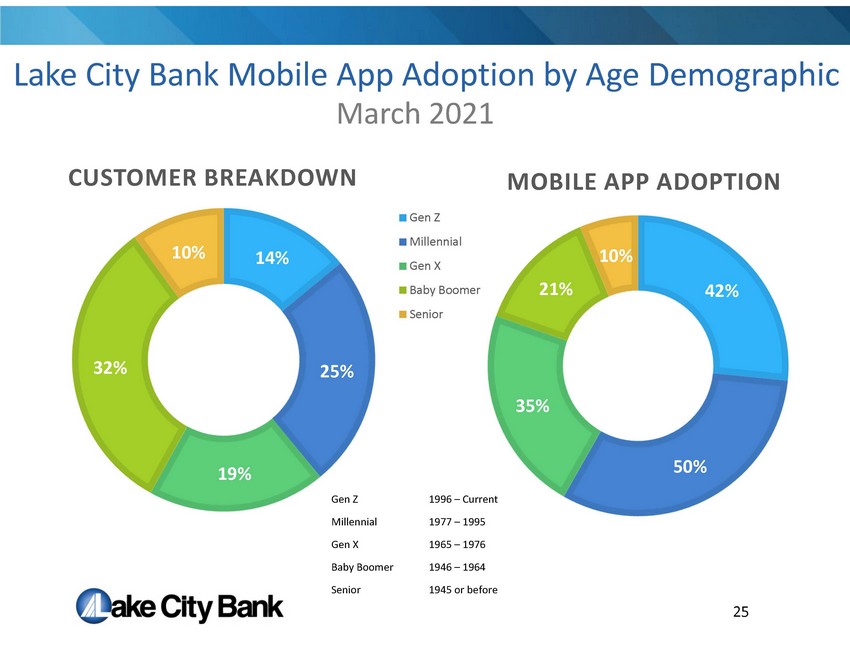
Lake City Bank Mobile App Adoption by Age Demographic 14% 25% 19% 32% 10% CUSTOMER BREAKDOWN 42% 50% 35% 21% 10% MOBILE APP ADOPTION Gen Z Millennial Gen X Baby Boomer Senior Gen Z 1996 – Current Millennial 1977 – 1995 Gen X 1965 – 1976 Baby Boomer 1946 – 1964 Senior 1945 or before March 2021 25
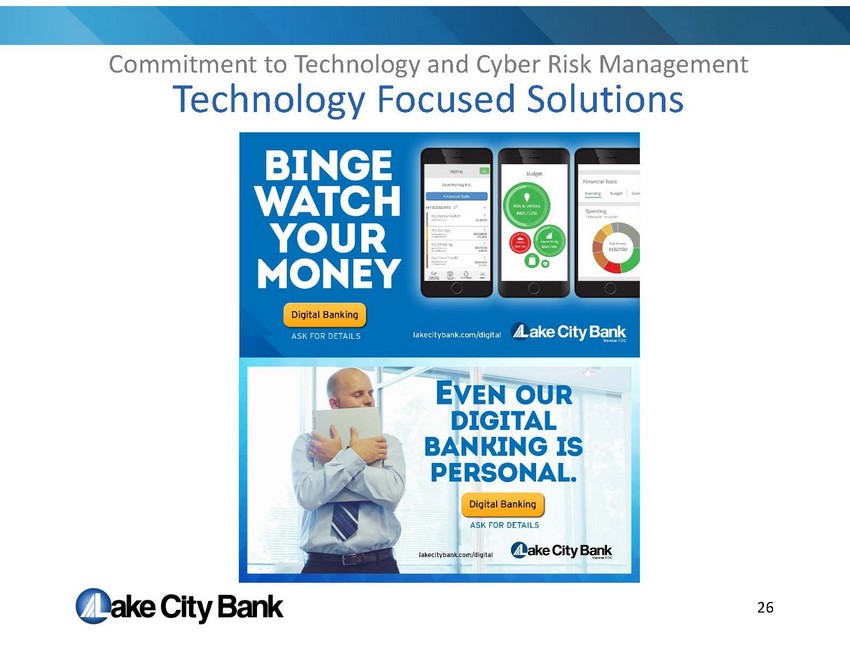
26 Technology Focused Solutions Commitment to Technology and Cyber Risk Management
Financial Performance
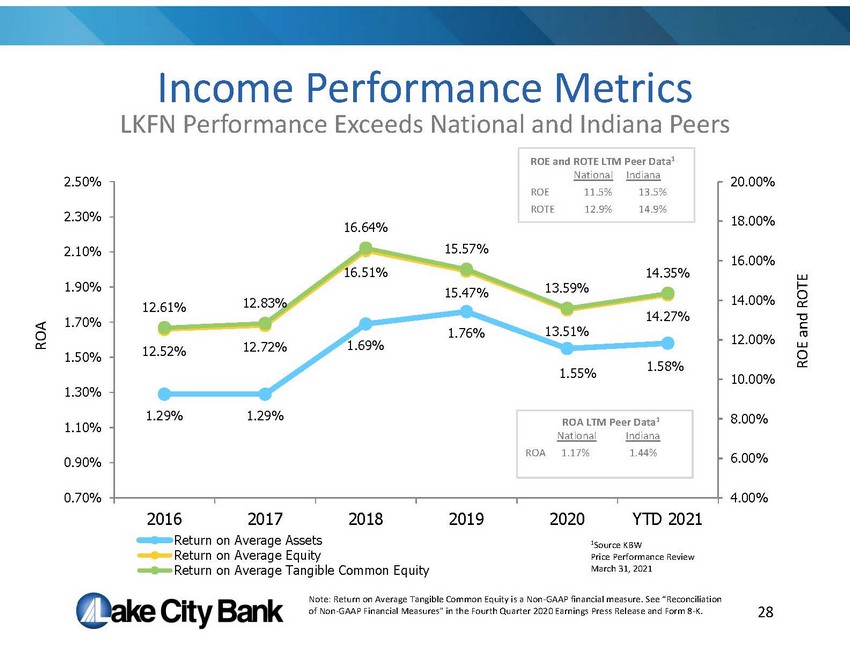
1.29% 1.29% 1.69% 1.76% 1.55% 1.58% 12.52% 12.72% 16.51% 15.47% 13.51% 14.27% 12.61% 12.83% 16.64% 15.57% 13.59% 14.35% 4.00% 6.00% 8.00% 10.00% 12.00% 14.00% 16.00% 18.00% 20.00% 0.70% 0.90% 1.10% 1.30% 1.50% 1.70% 1.90% 2.10% 2.30% 2.50% 2016 2017 2018 2019 2020 YTD 2021 Return on Average Assets Return on Average Equity Return on Average Tangible Common Equity Income Performance Metrics ROA LTM Peer Data 1 National Indiana ROA 1.17% 1.44% 1 Source KBW Price Performance Review March 31, 2021 LKFN Performance Exceeds National and Indiana Peers 28 ROA ROE and ROTE ROE and ROTE LTM Peer Data 1 National Indiana ROE 11.5% 13.5% ROTE 12.9% 14.9% Note: Return on Average Tangible Common Equity is a Non - GAAP financial measure. See “Reconciliation of Non - GAAP Financial Measures” in the Fourth Quarter 2020 Earnings Press Release and Form 8 - K.
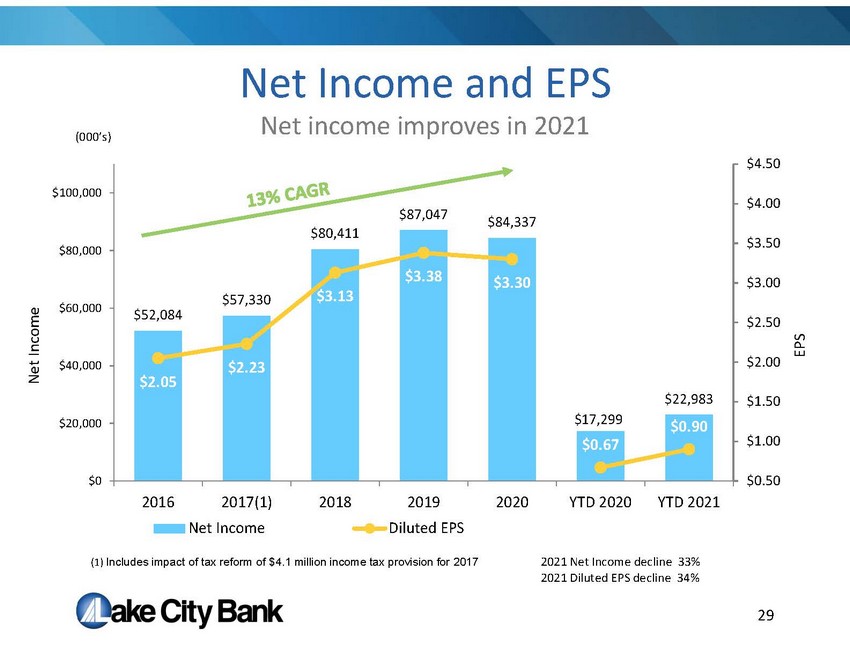
$52,084 $57,330 $80,411 $87,047 $84,337 $17,299 $22,983 $2.05 $2.23 $3.13 $3.38 $3.30 $0.67 $0.90 $0.50 $1.00 $1.50 $2.00 $2.50 $3.00 $3.50 $4.00 $4.50 $0 $20,000 $40,000 $60,000 $80,000 $100,000 2016 2017(1) 2018 2019 2020 YTD 2020 YTD 2021 Net Income Diluted EPS Net Income and EPS 2021 Net Income decline 33% 2021 Diluted EPS decline 34% Net income improves in 2021 29 Net Income EPS (000’s) (1) Includes impact of tax reform of $4.1 million income tax provision for 2017
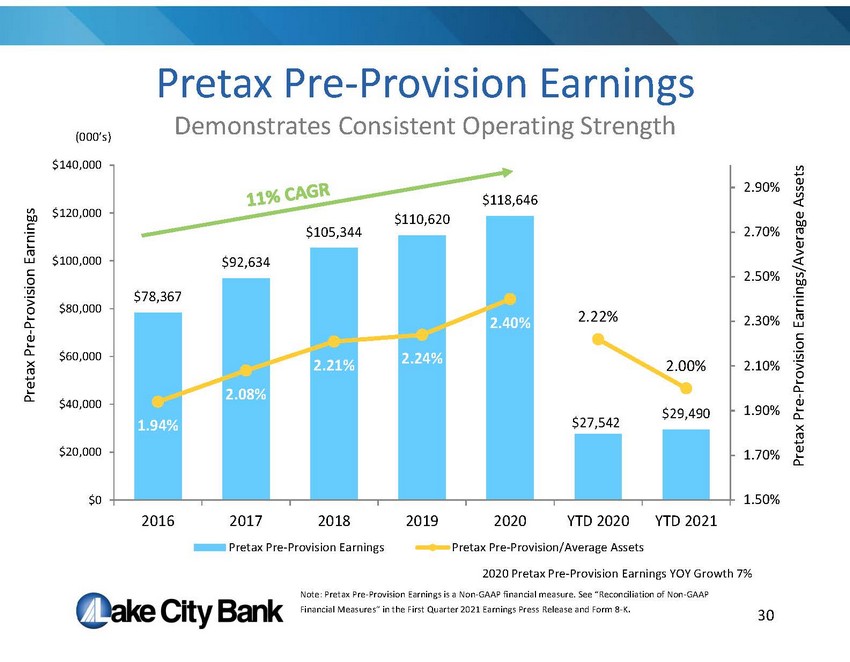
$78,367 $92,634 $105,344 $110,620 $118,646 $27,542 $29,490 1.94% 2.08% 2.21% 2.24% 2.40% 2.22% 2.00% 1.50% 1.70% 1.90% 2.10% 2.30% 2.50% 2.70% 2.90% $0 $20,000 $40,000 $60,000 $80,000 $100,000 $120,000 $140,000 2016 2017 2018 2019 2020 YTD 2020 YTD 2021 Pretax Pre-Provision Earnings Pretax Pre-Provision/Average Assets Pretax Pre - Provision Earnings 2020 Pretax Pre - Provision Earnings YOY Growth 7% Demonstrates Consistent Operating Strength 30 Pretax Pre - Provision Earnings Pretax Pre - Provision Earnings/Average Assets (000’s) Note: Pretax Pre - Provision Earnings is a Non - GAAP financial measure. See “Reconciliation of Non - GAAP Financial Measures” in the First Quarter 2021 Earnings Press Release and Form 8 - K .
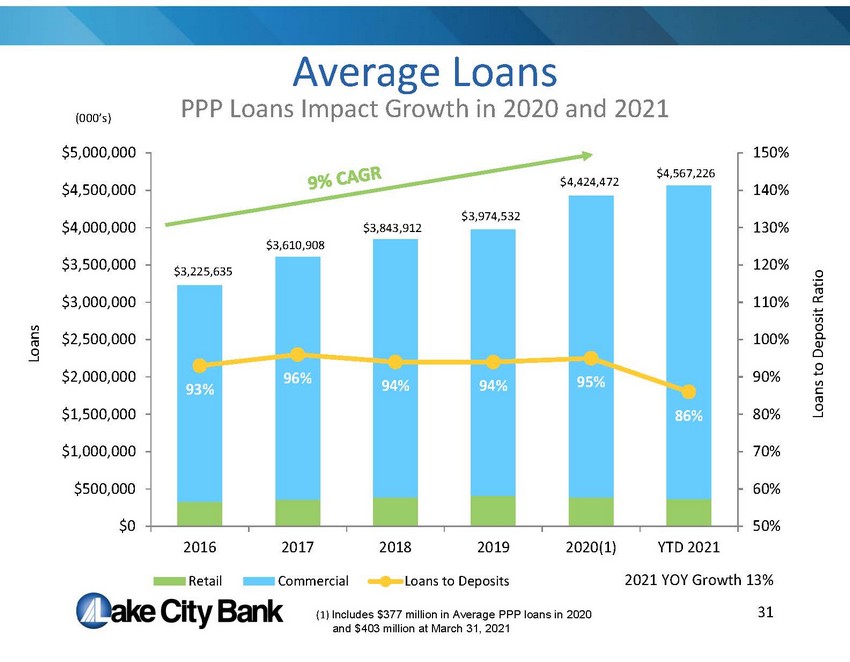
Average Loans PPP Loans Impact Growth in 2020 and 2021 93% 96% 94% 94% 95% 86% 50% 60% 70% 80% 90% 100% 110% 120% 130% 140% 150% $0 $500,000 $1,000,000 $1,500,000 $2,000,000 $2,500,000 $3,000,000 $3,500,000 $4,000,000 $4,500,000 $5,000,000 2016 2017 2018 2019 2020(1) YTD 2021 Retail Commercial Loans to Deposits 2021 YOY Growth 13% 31 $3,225,635 $3,610,908 Loans Loans to Deposit Ratio (000’s) $3,843,912 $3,974,532 $4,424,472 (1) Includes $377 million in Average PPP loans in 2020 and $403 million at March 31, 2021 $4,567,226
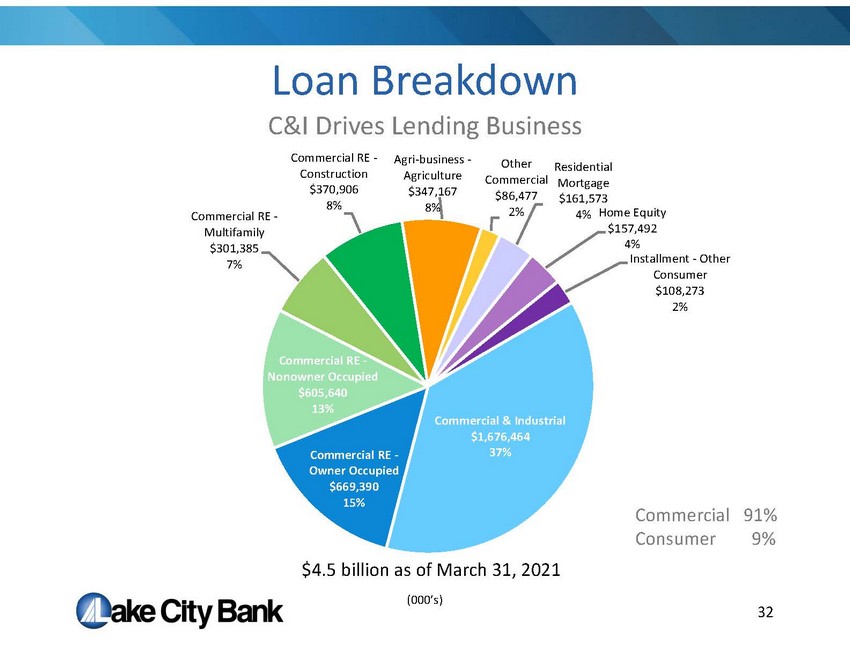
Loan Breakdown C&I Drives Lending Business Commercial & Industrial $1,676,464 37% Commercial RE - Owner Occupied $669,390 15% Commercial RE - Nonowner Occupied $605,640 13% Commercial RE - Multifamily $301,385 7% Commercial RE - Construction $370,906 8% Agri - business - Agriculture $347,167 8% Other Commercial $86,477 2% Residential Mortgage $161,573 4% Home Equity $157,492 4% Installment - Other Consumer $108,273 2% $4.5 billion as of March 31, 2021 32 Commercial 91% Consumer 9% (000’s)
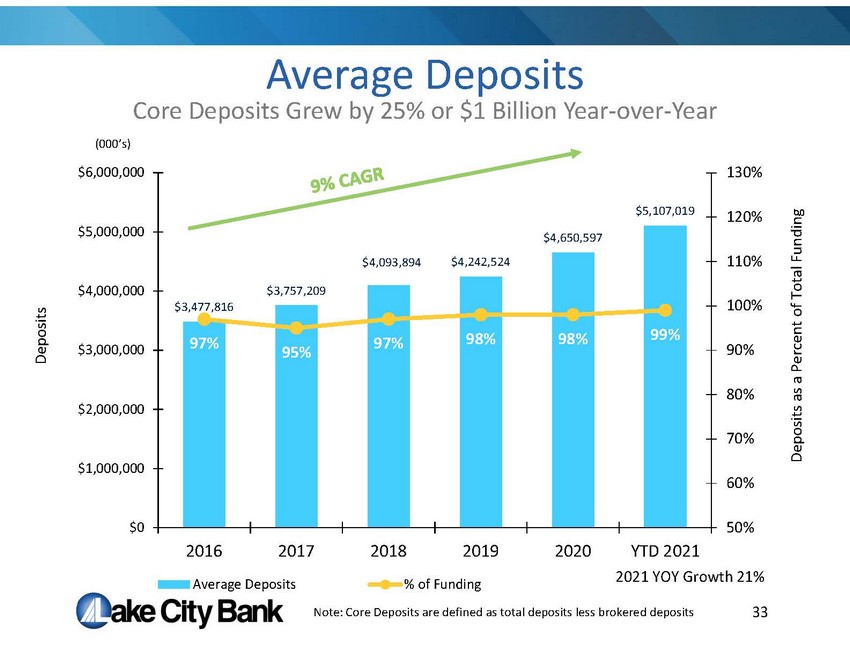
$3,477,816 $3,757,209 $4,093,894 $4,242,524 $4,650,597 $5,107,019 97% 95% 97% 98% 98% 99% 50% 60% 70% 80% 90% 100% 110% 120% 130% $0 $1,000,000 $2,000,000 $3,000,000 $4,000,000 $5,000,000 $6,000,000 2016 2017 2018 2019 2020 YTD 2021 Average Deposits % of Funding Average Deposits Core Deposits Grew by 25% or $1 Billion Year - over - Year 33 2021 YOY Growth 21% Note: Core Deposits are defined as total deposits less brokered deposits Deposits Deposits as a Percent of Total Funding (000’s)
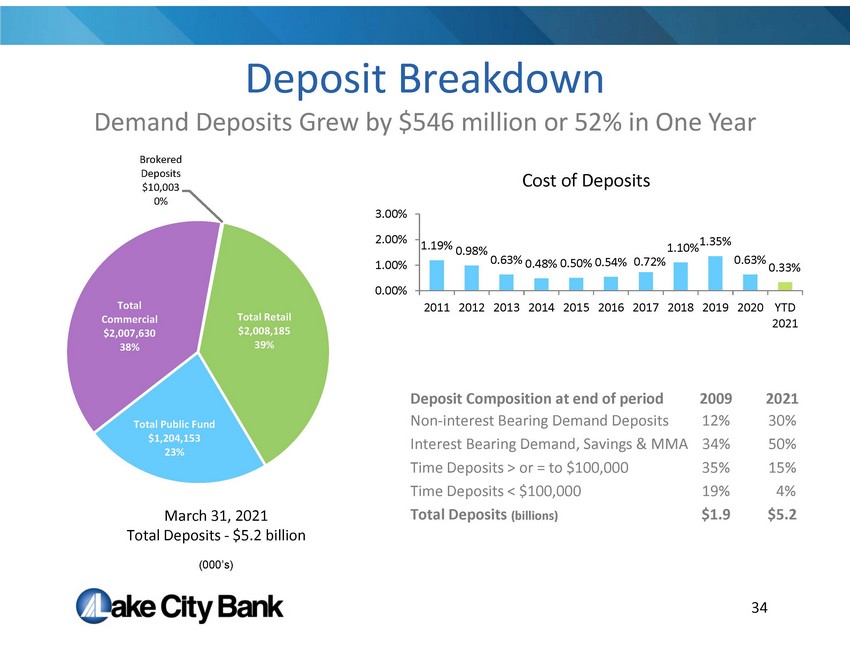
Total Retail $2,008,185 39% Total Public Fund $1,204,153 23% Total Commercial $2,007,630 38% Brokered Deposits $10,003 0% Deposit Breakdown Demand Deposits Grew by $546 million or 52% in One Year 1.19% 0.98% 0.63% 0.48% 0.50% 0.54% 0.72% 1.10% 1.35% 0.63% 0.33% 0.00% 1.00% 2.00% 3.00% 2011 2012 2013 2014 2015 2016 2017 2018 2019 2020 YTD 2021 Cost of Deposits March 31, 2021 Total Deposits - $5.2 billion 34 Deposit Composition at end of period 2009 2021 Non - interest Bearing Demand Deposits 12% 30% Interest Bearing Demand, Savings & MMA 34% 50% Time Deposits > or = to $100,000 35% 15% Time Deposits < $100,000 19% 4% Total Deposits (billions) $1.9 $5.2 (000’s)
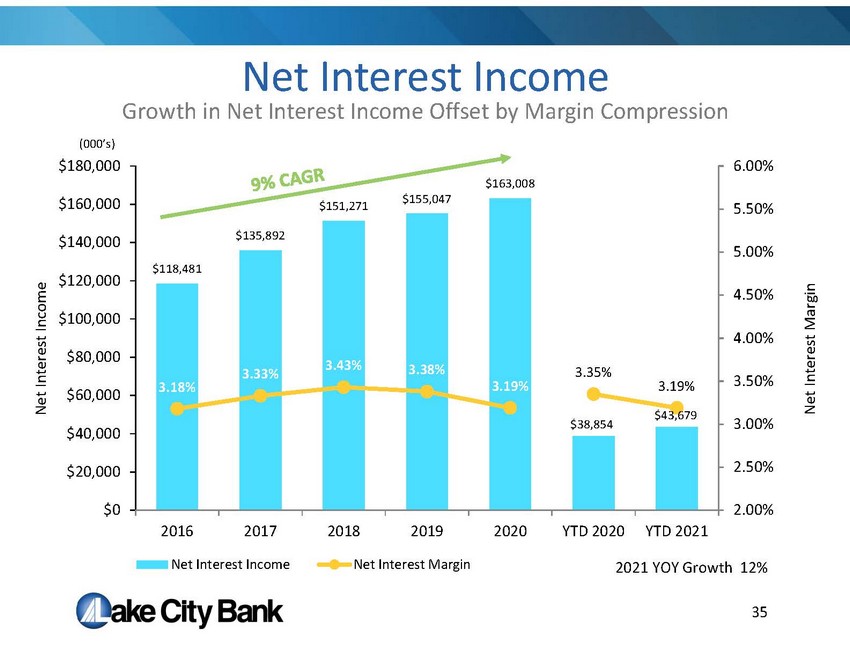
Net Interest Income Growth in Net Interest Income Offset by Margin Compression $118,481 $135,892 $151,271 $155,047 $163,008 $38,854 $43,679 3.18% 3.33% 3.43% 3.38% 3.19% 3.35% 3.19% 2.00% 2.50% 3.00% 3.50% 4.00% 4.50% 5.00% 5.50% 6.00% $0 $20,000 $40,000 $60,000 $80,000 $100,000 $120,000 $140,000 $160,000 $180,000 2016 2017 2018 2019 2020 YTD 2020 YTD 2021 Net Interest Income Net Interest Margin 2021 YOY Growth 12% 35 Net Interest Income Net Interest Margin (000’s)
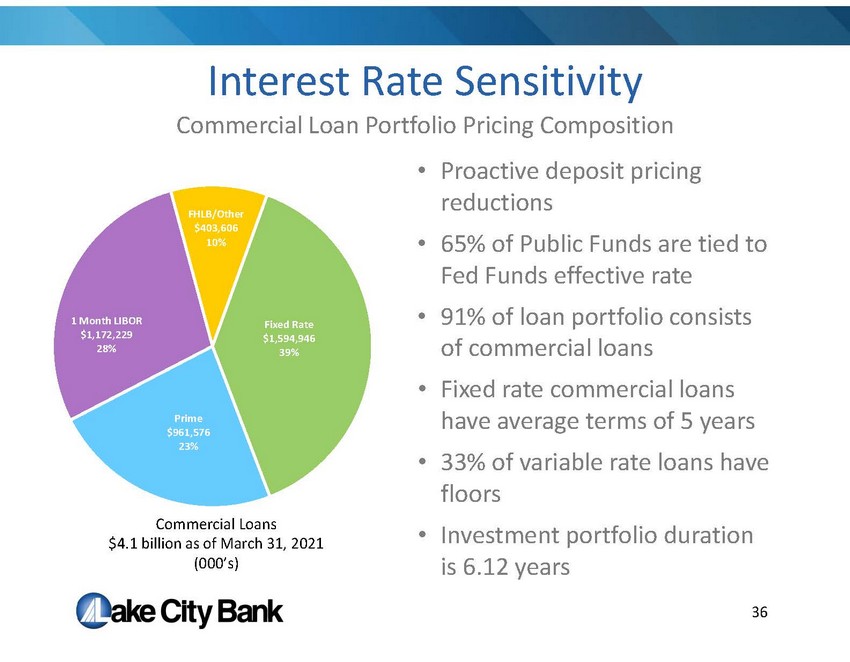
Fixed Rate $1,594,946 39% Prime $961,576 23% 1 Month LIBOR $1,172,229 28% FHLB/Other $403,606 10% Interest Rate Sensitivity • Proactive deposit pricing reductions • 65% of Public Funds are tied to Fed Funds effective rate • 91% of loan portfolio consists of commercial loans • Fixed rate commercial loans have average terms of 5 years • 33% of variable rate loans have floors • Investment portfolio duration is 6.12 years 36 Commercial Loans $4.1 billion as of March 31, 2021 (000’s) Commercial Loan Portfolio Pricing Composition
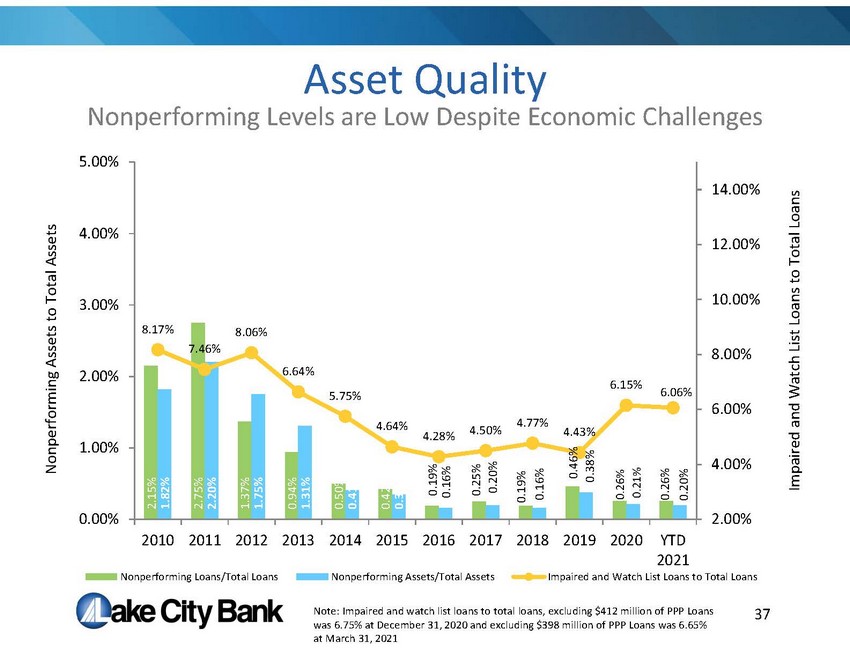
Asset Quality Nonperforming Levels are Low Despite Economic Challenges 2.15% 2.75% 1.37% 0.94% 0.50% 0.42% 0.19% 0.25% 0.19% 0.46% 0.26% 0.26% 1.82% 2.20% 1.75% 1.31% 0.41% 0.35% 0.16% 0.20% 0.16% 0.38% 0.21% 0.20% 8.17% 7.46% 8.06% 6.64% 5.75% 4.64% 4.28% 4.50% 4.77% 4.43% 6.15% 6.06% 2.00% 4.00% 6.00% 8.00% 10.00% 12.00% 14.00% 0.00% 1.00% 2.00% 3.00% 4.00% 5.00% 2010 2011 2012 2013 2014 2015 2016 2017 2018 2019 2020 YTD 2021 Nonperforming Loans/Total Loans Nonperforming Assets/Total Assets Impaired and Watch List Loans to Total Loans Nonperforming Assets to Total Assets Impaired and Watch List Loans to Total Loans 37 Note: Impaired and watch list loans to total loans, excluding $412 million of PPP Loans was 6.75% at December 31, 2020 and excluding $398 million of PPP Loans was 6.65% at March 31, 2021
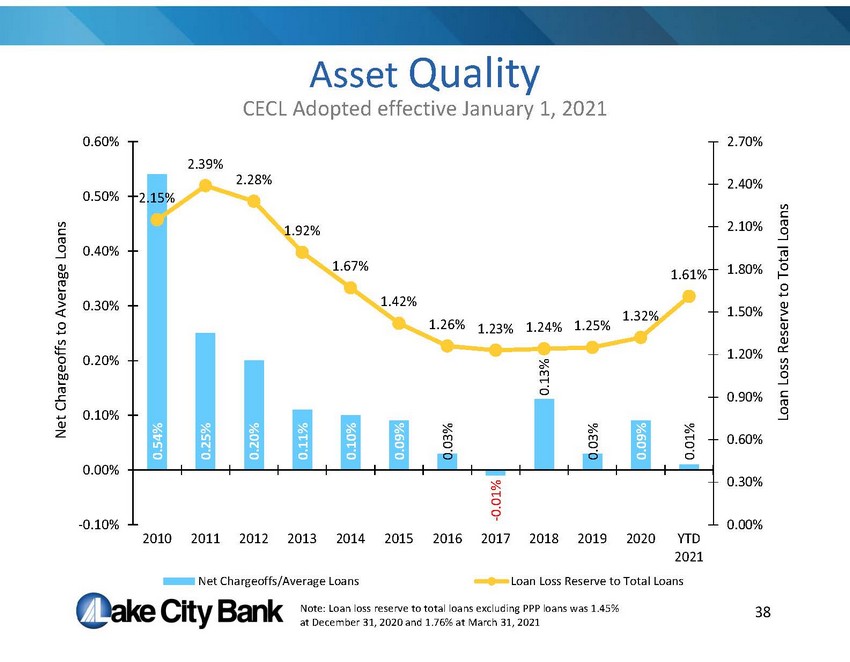
0.54% 0.25% 0.20% 0.11% 0.10% 0.09% 0.03% - 0.01% 0.13% 0.03% 0.09% 0.01% 2.15% 2.39% 2.28% 1.92% 1.67% 1.42% 1.26% 1.23% 1.24% 1.25% 1.32% 1.61% 0.00% 0.30% 0.60% 0.90% 1.20% 1.50% 1.80% 2.10% 2.40% 2.70% -0.10% 0.00% 0.10% 0.20% 0.30% 0.40% 0.50% 0.60% 2010 2011 2012 2013 2014 2015 2016 2017 2018 2019 2020 YTD 2021 Loan Loss Reserve to Total Loans Net Chargeoffs to Average Loans Net Chargeoffs/Average Loans Loan Loss Reserve to Total Loans Asset Quality CECL Adopted effective January 1, 2021 38 Note: Loan loss reserve to total loans excluding PPP loans was 1.45% at December 31, 2020 and 1.76% at March 31, 2021
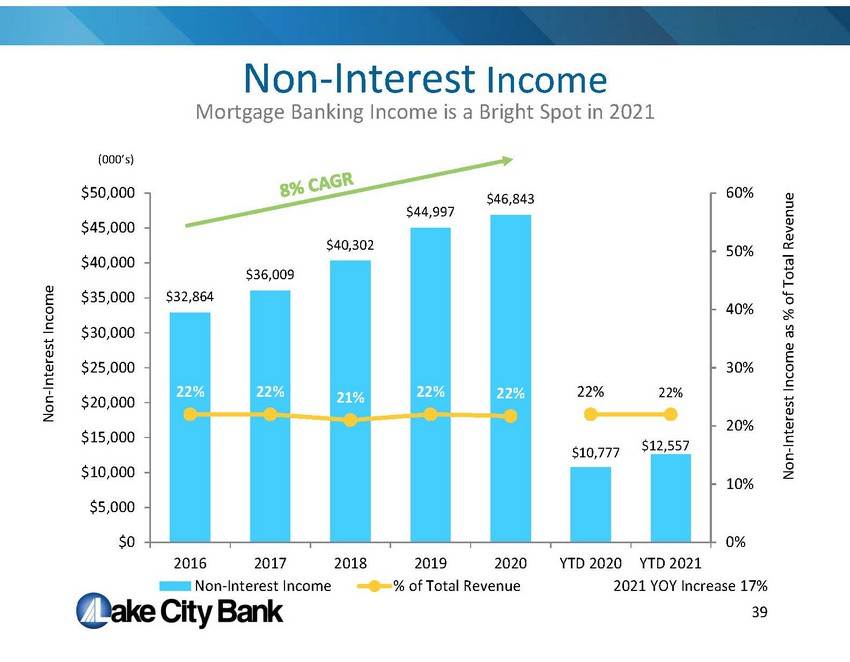
$32,864 $36,009 $40,302 $44,997 $46,843 $10,777 $12,557 22% 22% 21% 22% 22% 22% 22% 0% 10% 20% 30% 40% 50% 60% $0 $5,000 $10,000 $15,000 $20,000 $25,000 $30,000 $35,000 $40,000 $45,000 $50,000 2016 2017 2018 2019 2020 YTD 2020 YTD 2021 Non - Interest Income as % of Total Revenue Non - Interest Income Non-Interest Income % of Total Revenue Non - Interest Income Mortgage Banking Income is a Bright Spot in 2021 2021 YOY Increase 17% 39 (000’s)
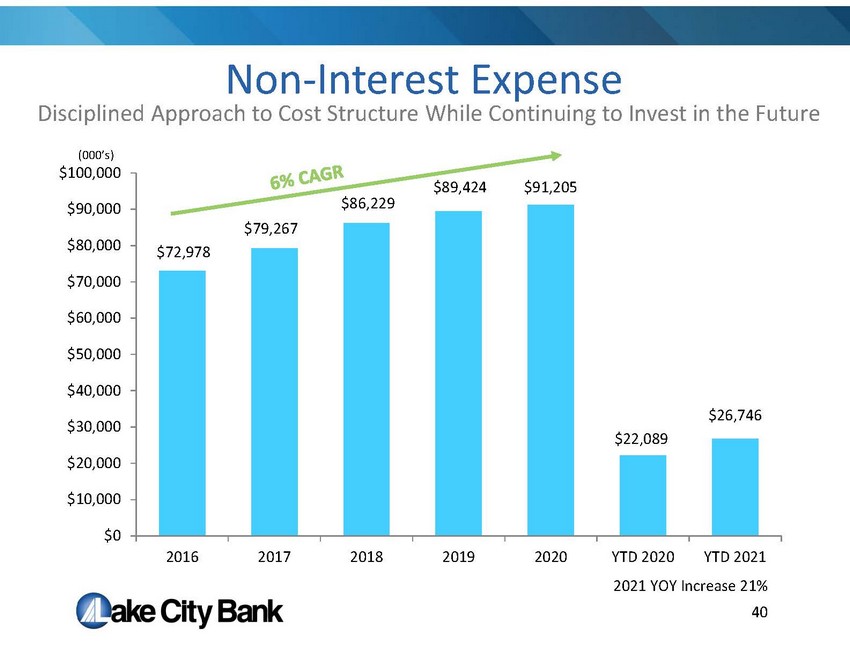
Non - Interest Expense Disciplined Approach to Cost Structure While Continuing to Invest in the Future 40 $72,978 $79,267 $86,229 $89,424 $91,205 $22,089 $26,746 $0 $10,000 $20,000 $30,000 $40,000 $50,000 $60,000 $70,000 $80,000 $90,000 $100,000 2016 2017 2018 2019 2020 YTD 2020 YTD 2021 2021 YOY Increase 21% (000’s)
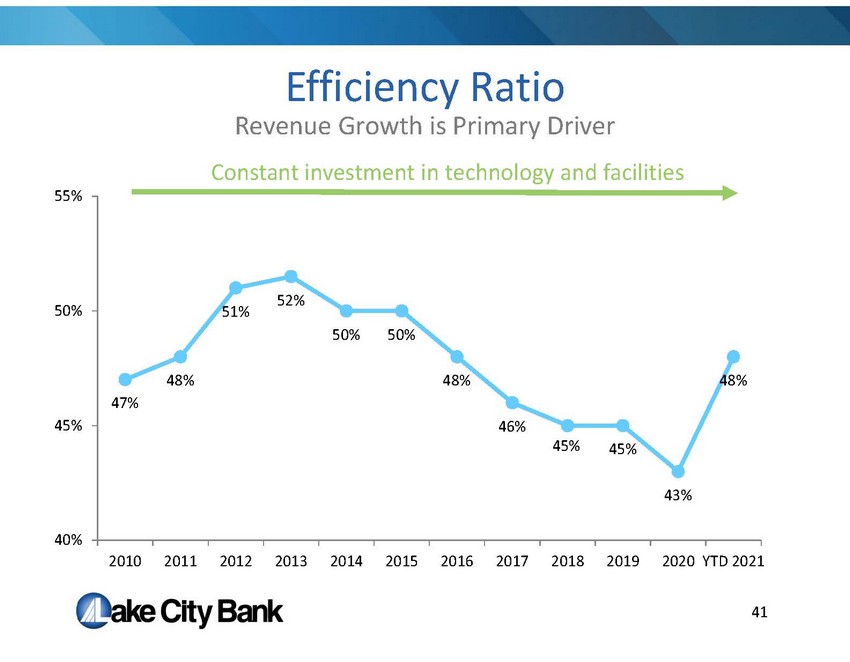
47% 48% 51% 52% 50% 50% 48% 46% 45% 45% 43% 48% 40% 45% 50% 55% 2010 2011 2012 2013 2014 2015 2016 2017 2018 2019 2020 YTD 2021 Efficiency Ratio Revenue Growth is Primary Driver Constant investment in technology and facilities 41
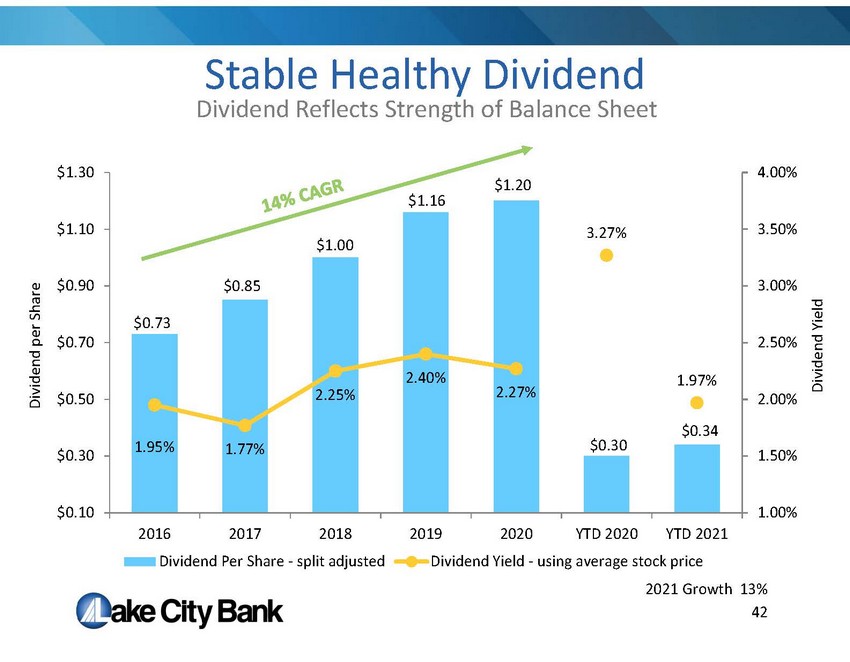
Stable Healthy Dividend $0.73 $0.85 $1.00 $1.16 $1.20 $0.30 $0.34 1.95% 1.77% 2.25% 2.40% 2.27% 3.27% 1.97% 1.00% 1.50% 2.00% 2.50% 3.00% 3.50% 4.00% $0.10 $0.30 $0.50 $0.70 $0.90 $1.10 $1.30 2016 2017 2018 2019 2020 YTD 2020 YTD 2021 Dividend Per Share - split adjusted Dividend Yield - using average stock price 2021 Growth 13% 42 Dividend Reflects Strength of Balance Sheet Dividend per Share Dividend Yield
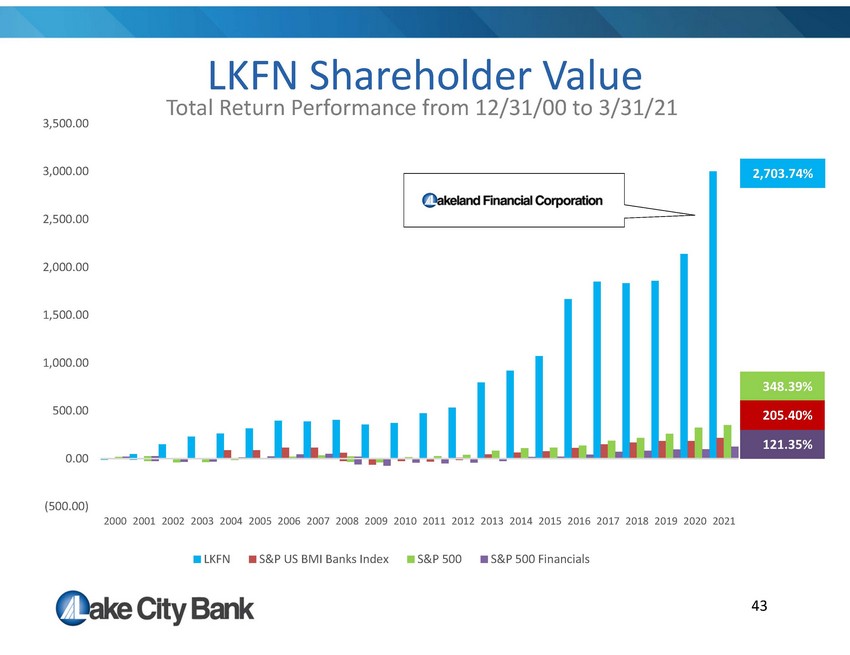
(500.00) 0.00 500.00 1,000.00 1,500.00 2,000.00 2,500.00 3,000.00 3,500.00 2000 2001 2002 2003 2004 2005 2006 2007 2008 2009 2010 2011 2012 2013 2014 2015 2016 2017 2018 2019 2020 2021 LKFN S&P US BMI Banks Index S&P 500 S&P 500 Financials 2,703.74% 121.35% 348.39% 205.40% LKFN Shareholder Value Total Return Performance from 12/31/00 to 3/31/21 43
Investment Highlights • Proven History of Organic Growth • Disciplined and Focused Strategy • Strong Internal Culture • Consistent Execution • Service Excellence Drives Shareholder Value 44
Supplemental Information
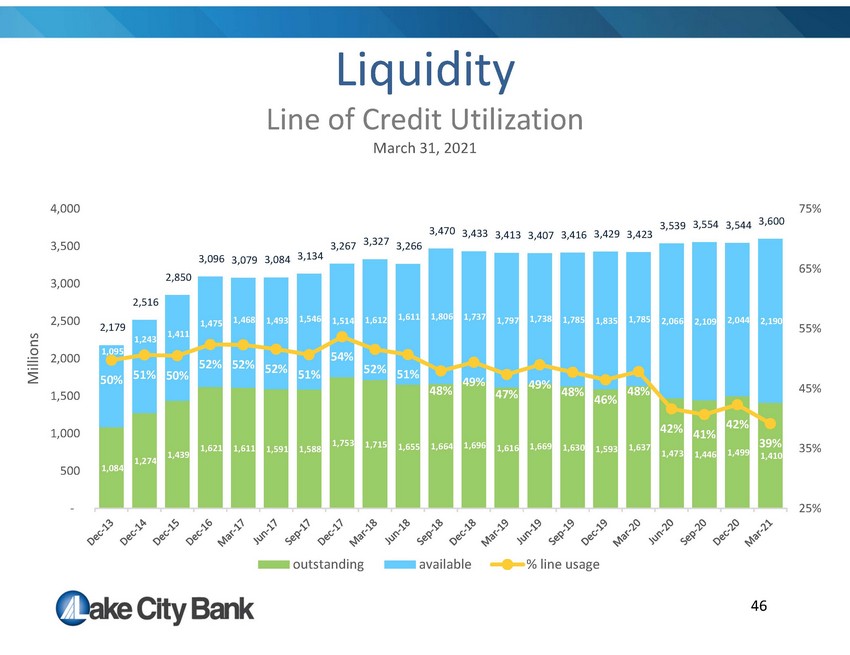
Liquidity Line of Credit Utilization March 31, 2021 1,084 1,274 1,439 1,621 1,611 1,591 1,588 1,753 1,715 1,655 1,664 1,696 1,616 1,669 1,630 1,593 1,637 1,473 1,446 1,499 1,410 1,095 1,243 1,411 1,475 1,468 1,493 1,546 1,514 1,612 1,611 1,806 1,737 1,797 1,738 1,785 1,835 1,785 2,066 2,109 2,044 2,190 2,179 2,516 2,850 3,096 3,079 3,084 3,134 3,267 3,327 3,266 3,470 3,433 3,413 3,407 3,416 3,429 3,423 3,539 3,554 3,544 3,600 50% 51% 50% 52% 52% 52% 51% 54% 52% 51% 48% 49% 47% 49% 48% 46% 48% 42% 41% 42% 39% 25% 35% 45% 55% 65% 75% - 500 1,000 1,500 2,000 2,500 3,000 3,500 4,000 Millions outstanding available % line usage 46
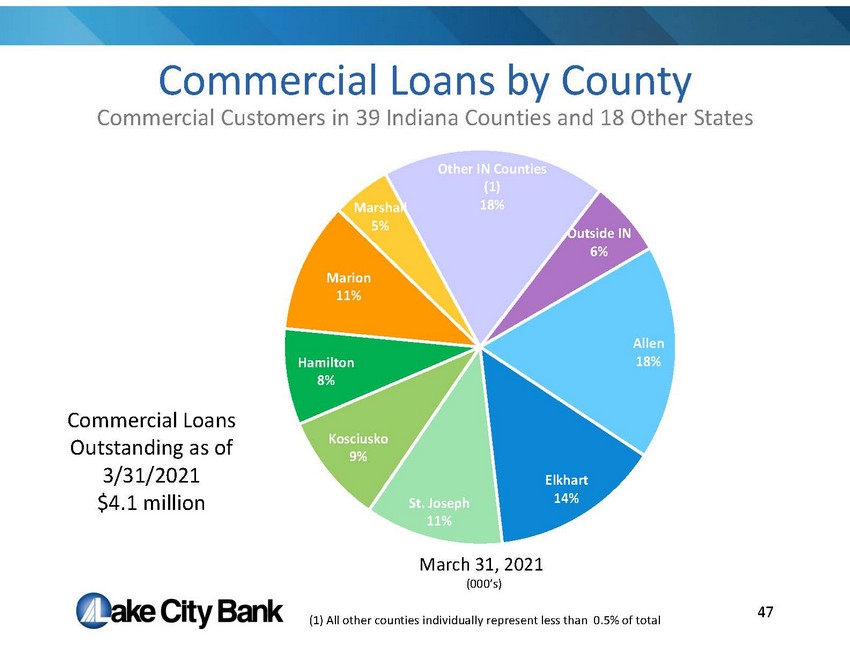
Commercial Loans by County Allen 18% Elkhart 14% St. Joseph 11% Kosciusko 9% Hamilton 8% Marion 11% Marshall 5% Other IN Counties (1) 18% Outside IN 6% March 31, 2021 47 (000’s) Commercial Loans Outstanding as of 3/31/2021 $4.1 million (1) All other counties individually represent less than 0.5% of total Commercial Customers in 39 Indiana Counties and 18 Other States
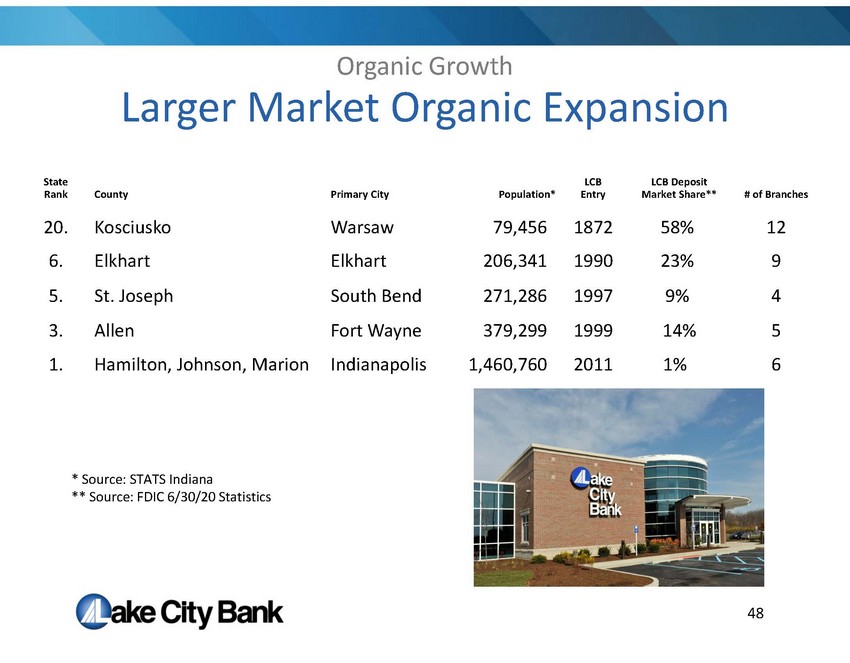
Larger Market Organic Expansion 48 State Rank County Primary City Population* LCB Entry LCB Deposit Market Share** # of Branches 20. Kosciusko Warsaw 79,456 1872 58% 12 6. Elkhart Elkhart 206,341 1990 23% 9 5. St. Joseph South Bend 271,286 1997 9% 4 3. Allen Fort Wayne 379,299 1999 14% 5 1. Hamilton, Johnson, Marion Indianapolis 1,460,760 2011 1% 6 * Source: STATS Indiana ** Source: FDIC 6/30/20 Statistics Organic Growth
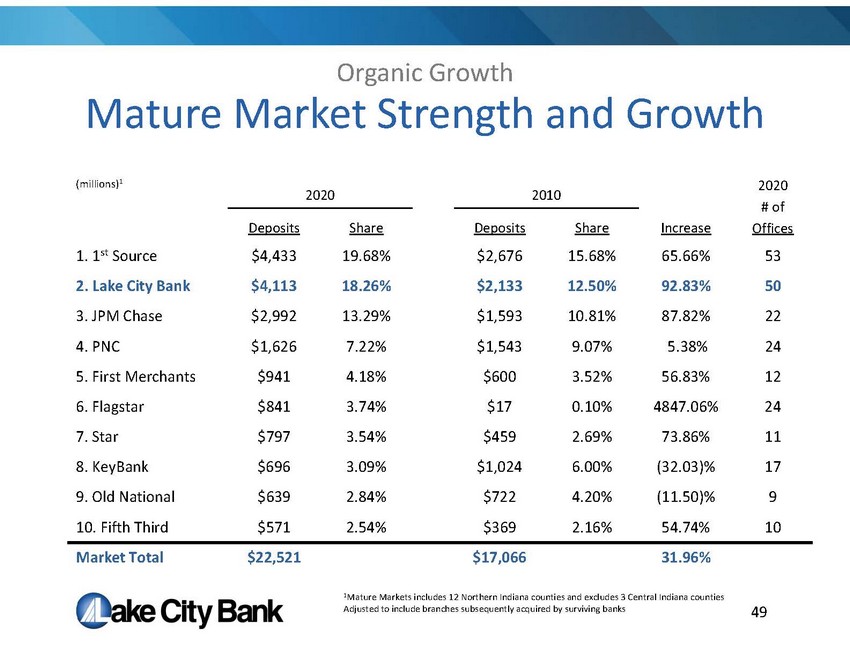
Mature Market Strength and Growth (millions) 1 2020 2010 2020 # of Offices Deposits Share Deposits Share Increase 1. 1 st Source $4,433 19.68% $2,676 15.68% 65.66% 53 2. Lake City Bank $4,113 18.26% $2,133 12.50% 92.83% 50 3. JPM Chase $2,992 13.29% $1,593 10.81% 87.82% 22 4. PNC $1,626 7.22% $1,543 9.07% 5.38% 24 5. First Merchants $941 4.18% $600 3.52% 56.83% 12 6. Flagstar $841 3.74% $17 0.10% 4847.06% 24 7. Star $797 3.54% $459 2.69% 73.86% 11 8. KeyBank $696 3.09% $1,024 6.00% (32.03)% 17 9. Old National $639 2.84% $722 4.20% (11.50)% 9 10. Fifth Third $571 2.54% $369 2.16% 54.74% 10 Market Total $22,521 $17,066 31.96% Organic Growth 1 Mature Markets includes 12 Northern Indiana counties and excludes 3 Central Indiana counties Adjusted to include branches subsequently acquired by surviving banks 49
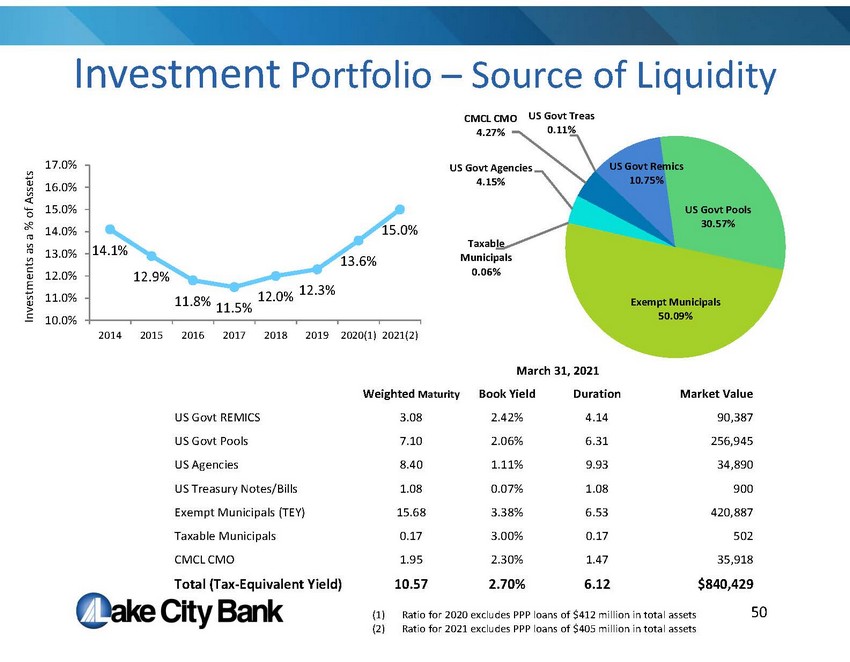
(1) Ratio for 2020 excludes PPP loans of $412 million in total assets (2) Ratio for 2021 excludes PPP loans of $405 million in total assets 14.1% 12.9% 11.8% 11.5% 12.0% 12.3% 13.6% 15.0% 10.0% 11.0% 12.0% 13.0% 14.0% 15.0% 16.0% 17.0% 2014 2015 2016 2017 2018 2019 2020(1) 2021(2) US Govt Treas 0.11% US Govt Remics 10.75% US Govt Pools 30.57% Exempt Municipals 50.09% Taxable Municipals 0.06% US Govt Agencies 4.15% CMCL CMO 4.27% Investment Portfolio – Source of Liquidity 50 March 31, 2021 Weighted Maturity Book Yield Duration Market Value US Govt REMICS 3.08 2.42% 4.14 90,387 US Govt Pools 7.10 2.06% 6.31 256,945 US Agencies 8.40 1.11% 9.93 34,890 US Treasury Notes/Bills 1.08 0.07% 1.08 900 Exempt Municipals (TEY) 15.68 3.38% 6.53 420,887 Taxable Municipals 0.17 3.00% 0.17 502 CMCL CMO 1.95 2.30% 1.47 35,918 Total (Tax - Equivalent Yield) 10.57 2.70% 6.12 $840,429 Investments as a % of Assets
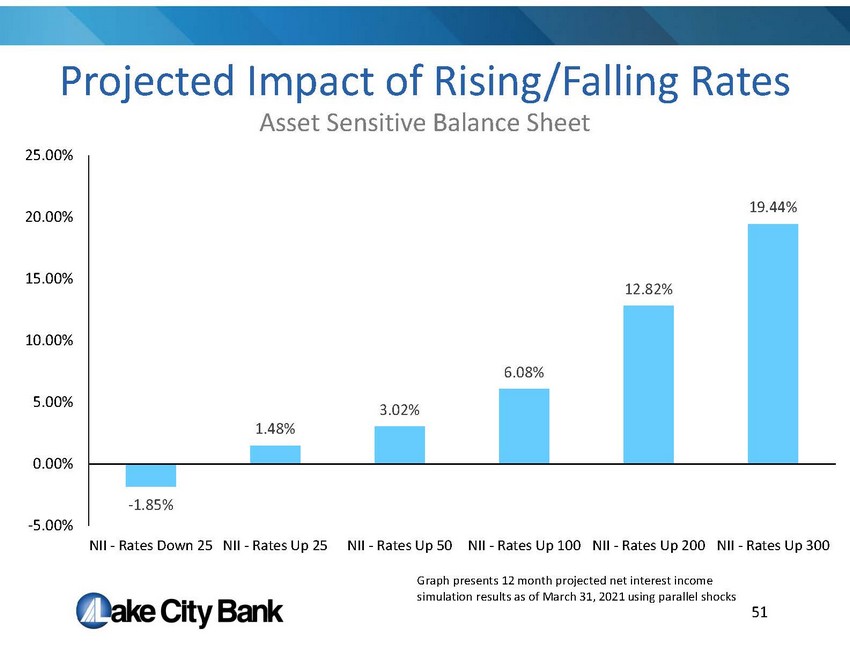
Projected Impact of Rising/Falling Rates Asset Sensitive Balance Sheet - 1.85% 1.48% 3.02% 6.08% 12.82% 19.44% -5.00% 0.00% 5.00% 10.00% 15.00% 20.00% 25.00% NII - Rates Down 25 NII - Rates Up 25 NII - Rates Up 50 NII - Rates Up 100 NII - Rates Up 200 NII - Rates Up 300 Graph presents 12 month projected net interest income simulation results as of March 31, 2021 using parallel shocks 51
(800) 827 - 4522 LAKECITYBANK.COM