Attached files
| file | filename |
|---|---|
| EX-99.1 - EX-99.1 - FARMERS & MERCHANTS BANCORP INC | d174432dex991.htm |
| EX-2.1 - EX-2.1 - FARMERS & MERCHANTS BANCORP INC | d174432dex21.htm |
| 8-K - 8-K - FARMERS & MERCHANTS BANCORP INC | d174432d8k.htm |

Exhibit 99.2 Farmers & Merchants Bancorp, Inc. (NASDAQ: FMAO) Acquisition of Perpetual Federal Savings Bank May 4, 2021 We Nurture Lasting RelationshipsExhibit 99.2 Farmers & Merchants Bancorp, Inc. (NASDAQ: FMAO) Acquisition of Perpetual Federal Savings Bank May 4, 2021 We Nurture Lasting Relationships

Transaction Overview Farmers & Merchants Bancorp, Inc. to acquire Perpetual Federal Savings Bank ▪ Farmers & Merchants Bancorp, Inc. (“FMAO”) to acquire Perpetual Federal Savings Bank (“PFSB”), a community bank based in Urbana, Ohio, with one full-service location. PFSB represents FMAO’s largest acquisition to date. ▪ PFSB provides a stable net interest margin franchise with a low noninterest expense base ▪ Unique opportunity to transform PFSB’s customer base to FMAO’s full array of retail / commercial products and services ▪ PFSB’s shareholders can elect 1.7766 share of FMAO common shares (with aggregate issuance of 1,833,999 FMAO common shares) or $41.20 per share in cash ▪ PFSB reported 2,470,032 shares outstanding at 03/31/2021 ▪ Based on FMAO’s 05/03/2021 closing price of $24.22, the implied aggregate deal value equals $103.7 million. ▪ PFSB reported approximately $391 million in total assets, $326 million in loans and $305 million in deposits at 03/31/2021 ▪ PFSB’s tangible equity equaled $79.1 million at 03/31/2021 ▪ PFSB’s net income equaled $1.2 million for the quarter-ended 03/31/2021 and $4.8 million for the 12-month period ended 03/31/2021 We Nurture Lasting Relationships 2Transaction Overview Farmers & Merchants Bancorp, Inc. to acquire Perpetual Federal Savings Bank ▪ Farmers & Merchants Bancorp, Inc. (“FMAO”) to acquire Perpetual Federal Savings Bank (“PFSB”), a community bank based in Urbana, Ohio, with one full-service location. PFSB represents FMAO’s largest acquisition to date. ▪ PFSB provides a stable net interest margin franchise with a low noninterest expense base ▪ Unique opportunity to transform PFSB’s customer base to FMAO’s full array of retail / commercial products and services ▪ PFSB’s shareholders can elect 1.7766 share of FMAO common shares (with aggregate issuance of 1,833,999 FMAO common shares) or $41.20 per share in cash ▪ PFSB reported 2,470,032 shares outstanding at 03/31/2021 ▪ Based on FMAO’s 05/03/2021 closing price of $24.22, the implied aggregate deal value equals $103.7 million. ▪ PFSB reported approximately $391 million in total assets, $326 million in loans and $305 million in deposits at 03/31/2021 ▪ PFSB’s tangible equity equaled $79.1 million at 03/31/2021 ▪ PFSB’s net income equaled $1.2 million for the quarter-ended 03/31/2021 and $4.8 million for the 12-month period ended 03/31/2021 We Nurture Lasting Relationships 2

PFSB Profile – Investment Highlights • Strong profitability – average annual net income and ROAA of $5.7 million and 1.45%, respectively, between 2018 and 2020 • Consistent earnings - LTM ended 03/31/2021 net income equaled $4.8 million. Net income equaled $1.2 Financial Stability million in each of the last five quarters. ROAA between 1.20% to 1.25% over the same five quarters and Asset Quality • Superior capital ratios - 20.3% equity to asset ratio at 03/31/2021 and 35.6% total risk-based ratio • Strong credit quality - NPAs to assets were 0.23% at 03/31/2021; 1.50% ALLL to 03/31/2021 loans ($1.1 million PPP loans outstanding); annual net loan recoveries in each of the last 5 calendar years • PFSB’s loan to deposit ratio equaled 107% at 03/31/2021 • PFSB’s loan portfolio focused on real estate lending with average life of approximately 5.5 years • Total loans equaled $326 million at 03/31/2021 and between approximately $325 to $350 million over the last Balance Sheet Mix 11 quarters and NIM • Stable deposit levels with total deposits between $300 to $310 million over the last 11 quarters • NIM (FTE) equaled 2.57% for the quarter ended 03/31/2021 vs 2.55% for the quarter ended 12/31/2020 • NIM expansion opportunity from interest expense reduction as time deposits reprice and potential reinvestment of cash/investments redeployed at higher yields We Nurture Lasting Relationships 3PFSB Profile – Investment Highlights • Strong profitability – average annual net income and ROAA of $5.7 million and 1.45%, respectively, between 2018 and 2020 • Consistent earnings - LTM ended 03/31/2021 net income equaled $4.8 million. Net income equaled $1.2 Financial Stability million in each of the last five quarters. ROAA between 1.20% to 1.25% over the same five quarters and Asset Quality • Superior capital ratios - 20.3% equity to asset ratio at 03/31/2021 and 35.6% total risk-based ratio • Strong credit quality - NPAs to assets were 0.23% at 03/31/2021; 1.50% ALLL to 03/31/2021 loans ($1.1 million PPP loans outstanding); annual net loan recoveries in each of the last 5 calendar years • PFSB’s loan to deposit ratio equaled 107% at 03/31/2021 • PFSB’s loan portfolio focused on real estate lending with average life of approximately 5.5 years • Total loans equaled $326 million at 03/31/2021 and between approximately $325 to $350 million over the last Balance Sheet Mix 11 quarters and NIM • Stable deposit levels with total deposits between $300 to $310 million over the last 11 quarters • NIM (FTE) equaled 2.57% for the quarter ended 03/31/2021 vs 2.55% for the quarter ended 12/31/2020 • NIM expansion opportunity from interest expense reduction as time deposits reprice and potential reinvestment of cash/investments redeployed at higher yields We Nurture Lasting Relationships 3

PFSB Profile – Investment Highlights (Cont.) • Implement FMAO’s retail culture by providing more traditional community bank lending and deposit products/services Margin Improvement • Implement FMAO’s ALCO management process to effectively manage interest rate risk Included in Pro Forma Model • Transition PFSB’s high-cost CD portfolio to a more traditional core deposit base comparable to other FMAO branches • Significant opportunity to expand commercial lending through FMAO’s CRE and Agricultural lending expertise Revenue Enhancement Opportunities • Origination and sale of residential mortgage loans in secondary market (Not Included in Pro Forma Model) • Mortgage servicing revenue not currently in place • Noninterest expense to average assets equaled just 1.10% for the quarter ended 03/31/2021 and 1.08% in full calendar year 2020 • PFSB’s last 12 months ended 03/31/2021 efficiency ratio equaled 41.4% • 20 FTE employees at 03/31/2021 • Fully phased-in annual gross cost savings estimated at $1.75 million or approximately 37% of noninterest Noninterest Expense Controls expense before any expense add-back and Cost Savings • Minimal employee level cost savings outside of normal retirements/attrition • Majority of the cost savings recognized in other operating expenses • Annual expense add-back of $200,000 to provide support and transition resources to effectively implement FMAO culture We Nurture Lasting Relationships 4PFSB Profile – Investment Highlights (Cont.) • Implement FMAO’s retail culture by providing more traditional community bank lending and deposit products/services Margin Improvement • Implement FMAO’s ALCO management process to effectively manage interest rate risk Included in Pro Forma Model • Transition PFSB’s high-cost CD portfolio to a more traditional core deposit base comparable to other FMAO branches • Significant opportunity to expand commercial lending through FMAO’s CRE and Agricultural lending expertise Revenue Enhancement Opportunities • Origination and sale of residential mortgage loans in secondary market (Not Included in Pro Forma Model) • Mortgage servicing revenue not currently in place • Noninterest expense to average assets equaled just 1.10% for the quarter ended 03/31/2021 and 1.08% in full calendar year 2020 • PFSB’s last 12 months ended 03/31/2021 efficiency ratio equaled 41.4% • 20 FTE employees at 03/31/2021 • Fully phased-in annual gross cost savings estimated at $1.75 million or approximately 37% of noninterest Noninterest Expense Controls expense before any expense add-back and Cost Savings • Minimal employee level cost savings outside of normal retirements/attrition • Majority of the cost savings recognized in other operating expenses • Annual expense add-back of $200,000 to provide support and transition resources to effectively implement FMAO culture We Nurture Lasting Relationships 4

PFSB Profile – Investment Highlights (Cont.) • Extension of FMAO’s franchise into Columbus, Piqua, Sidney, Springfield, Tipp City and Troy markets with Strategically significant fill-in potential Well-Positioned• Eastern suburbs of Dayton and western suburbs of Columbus are approximately 30 miles from Urbana • PFSB currently originates loans in the Columbus market • FMAO recently established a LPO in Oxford, Ohio which is southwest of Dayton • PFSB is located in Champaign County, which has similar demographics and market size to FMAO’s home market of Fulton County PFSB’s Market • Champaign County’s median household income at approximately $64,000, exceeding Ohio average • FMAO operates in similar sized markets in both Ohio and Indiana • Total Champaign County deposits of $752 million • PFSB holds the largest deposit market share in Champaign County at 40.7%; next highest is 19.2% We Nurture Lasting Relationships 5PFSB Profile – Investment Highlights (Cont.) • Extension of FMAO’s franchise into Columbus, Piqua, Sidney, Springfield, Tipp City and Troy markets with Strategically significant fill-in potential Well-Positioned• Eastern suburbs of Dayton and western suburbs of Columbus are approximately 30 miles from Urbana • PFSB currently originates loans in the Columbus market • FMAO recently established a LPO in Oxford, Ohio which is southwest of Dayton • PFSB is located in Champaign County, which has similar demographics and market size to FMAO’s home market of Fulton County PFSB’s Market • Champaign County’s median household income at approximately $64,000, exceeding Ohio average • FMAO operates in similar sized markets in both Ohio and Indiana • Total Champaign County deposits of $752 million • PFSB holds the largest deposit market share in Champaign County at 40.7%; next highest is 19.2% We Nurture Lasting Relationships 5

Pro Forma Footprint Perpetual Federal Savings Bank Jun-20 Deposits Branch Address City County ST ($000) 1 120 N Main St Urbana Champaign OH $306,090 Total $306,090 Farmers & Merchants State Bank **Ohio Branches Listed Below** Jun-20 Deposits Branch Address City County ST ($000) 1 307 N Defiance St (1) Archbold Fulton OH $326,112 2 1130 N Shoop Ave (1) Wauseon Fulton OH $135,963 3 1000 S Main St Bryan Williams OH $66,839 4 2255 Scott St Napoleon Henry OH $65,520 5 7001 Lighthouse Way Perrysburg Wood OH $59,675 6 929 E High St Bryan Williams OH $49,567 7 200 W Jackson St West Unity Williams OH $49,036 8 101 Main St Delta Fulton OH $48,959 9 1175 Hotel Dr Defiance Defiance OH $48,287 10 1150 E Main St Montpelier Williams OH $45,732 11 7 Turtle Creek Cir Swanton Lucas OH $44,575 12 300 S Defiance St Stryker Williams OH $42,184 13 100 N Main St Hicksville Defiance OH $31,264 14 1660 Tiffin Ave Findlay Hancock OH $29,983 15 22973 Defiance Pike Custar Wood OH $29,853 16 5830 Monroe St Sylvania Lucas OH $24,137 17 8720 Waterville Swanton Rd Waterville Lucas OH $21,438 18 1072 N Main St Bowling Green Wood OH $10,250 12 Indiana Branches (Includes Ossian State Bank) $462,240 Total $1,591,614 We Nurture Lasting Relationships (1) Includes deposits from office modifications effective 03/01/2021. 6Pro Forma Footprint Perpetual Federal Savings Bank Jun-20 Deposits Branch Address City County ST ($000) 1 120 N Main St Urbana Champaign OH $306,090 Total $306,090 Farmers & Merchants State Bank **Ohio Branches Listed Below** Jun-20 Deposits Branch Address City County ST ($000) 1 307 N Defiance St (1) Archbold Fulton OH $326,112 2 1130 N Shoop Ave (1) Wauseon Fulton OH $135,963 3 1000 S Main St Bryan Williams OH $66,839 4 2255 Scott St Napoleon Henry OH $65,520 5 7001 Lighthouse Way Perrysburg Wood OH $59,675 6 929 E High St Bryan Williams OH $49,567 7 200 W Jackson St West Unity Williams OH $49,036 8 101 Main St Delta Fulton OH $48,959 9 1175 Hotel Dr Defiance Defiance OH $48,287 10 1150 E Main St Montpelier Williams OH $45,732 11 7 Turtle Creek Cir Swanton Lucas OH $44,575 12 300 S Defiance St Stryker Williams OH $42,184 13 100 N Main St Hicksville Defiance OH $31,264 14 1660 Tiffin Ave Findlay Hancock OH $29,983 15 22973 Defiance Pike Custar Wood OH $29,853 16 5830 Monroe St Sylvania Lucas OH $24,137 17 8720 Waterville Swanton Rd Waterville Lucas OH $21,438 18 1072 N Main St Bowling Green Wood OH $10,250 12 Indiana Branches (Includes Ossian State Bank) $462,240 Total $1,591,614 We Nurture Lasting Relationships (1) Includes deposits from office modifications effective 03/01/2021. 6

Pro Forma Loan Mix Perpetual Federal Savings Farmers & Merchants State Ossian State Bank Combined Banks Bank Bank Other Agric. Other Agric. 0.4% Constr. 1.4% Other 0.1% Other 0.1% 0.4% Constr. Agric. 1.1% 0.9% Constr. Cons. Agric. Cons. 5.8% Constr. 0.2% Farm 8.0% C&I 0.7% 7.4% Cons. 10.2% 2.0% 0.9% Cons. 6.2% 3.3% 4.0% C&I Farm Multi- Farm 14.4% Multi- 19.0% Fam. C&I Farm 11.3% Fam. 1.9% 13.4% C&I 13.6% 19.2% 15.0% 1-4 Fam. Multi- 1-4 Fam. 56.1% 1-4 Fam. 1-4 Fam. Other Fam. Other Multi- 21.2% 18.6% 12.8% CRE 7.3% CRE Fam. 23.7% 10.9% Other 4.6% Other CRE OO CRE OO CRE CRE 17.0% OO CRE OO CRE 13.4% 18.4% 18.3% 12.1% 5.4% Perpetual Federal Balance % of Farmers & Merchants Balance % of Balance % of Balance % of Savings Bank ($000) Total State Bank ($000) Total Ossian State Bank ($000) Total Combined Banks ($000) Total Construction $1,164 0.4% Construction $136,977 10.2% Construction $91 0.2% Construction $138,232 8.0% Farm Loans $3,092 0.9% Farm Loans $182,918 13.6% Farm Loans $10,253 19.0% Farm Loans $196,263 11.3% 1-4 Family $183,172 56.1% 1-4 Family $172,625 12.8% 1-4 Family $10,015 18.6% 1-4 Family $365,812 21.2% Owner-Occupied CRE $17,513 5.4% Owner-Occupied CRE $181,214 13.4% Owner-Occupied CRE $9,920 18.4% Owner-Occupied CRE $208,647 12.1% Other CRE Loans $35,464 10.9% Other CRE Loans $246,391 18.3% Other CRE Loans $12,766 23.7% Other CRE Loans $294,621 17.0% Multi-Family $62,773 19.2% Multi-Family $61,760 4.6% Multi-Family $1,042 1.9% Multi-Family $125,575 7.3% C&I $20,256 6.2% C&I $202,958 15.0% C&I $7,743 14.4% C&I $230,957 13.4% Consumer $2,417 0.7% Consumer $53,879 4.0% Consumer $1,082 2.0% Consumer $57,378 3.3% Agricultural $252 0.1% Agricultural $100,022 7.4% Agricultural $763 1.4% Agricultural $101,037 5.8% Other Loans $369 0.1% Other Loans $14,654 1.1% Other Loans $242 0.4% Other Loans $15,265 0.9% Less: Unearned Income $0 0.0% Less: Unearned Income $4,208 0.3% Less: Unearned Income $0 0.0% Less: Unearned Income $4,208 0.2% Total Loans $326,472 100.0% Total Loans $1,349,190 100.0% Total Loans $53,917 100.0% Total Loans $1,729,579 100.0% We Nurture Lasting Relationships 2021Q1 Loan Yield 4.43% 2021Q1 Loan Yield 4.70% 2021Q1 Loan Yield 4.59% Combined 2021Q1 Loan Yield 4.65% 7Pro Forma Loan Mix Perpetual Federal Savings Farmers & Merchants State Ossian State Bank Combined Banks Bank Bank Other Agric. Other Agric. 0.4% Constr. 1.4% Other 0.1% Other 0.1% 0.4% Constr. Agric. 1.1% 0.9% Constr. Cons. Agric. Cons. 5.8% Constr. 0.2% Farm 8.0% C&I 0.7% 7.4% Cons. 10.2% 2.0% 0.9% Cons. 6.2% 3.3% 4.0% C&I Farm Multi- Farm 14.4% Multi- 19.0% Fam. C&I Farm 11.3% Fam. 1.9% 13.4% C&I 13.6% 19.2% 15.0% 1-4 Fam. Multi- 1-4 Fam. 56.1% 1-4 Fam. 1-4 Fam. Other Fam. Other Multi- 21.2% 18.6% 12.8% CRE 7.3% CRE Fam. 23.7% 10.9% Other 4.6% Other CRE OO CRE OO CRE CRE 17.0% OO CRE OO CRE 13.4% 18.4% 18.3% 12.1% 5.4% Perpetual Federal Balance % of Farmers & Merchants Balance % of Balance % of Balance % of Savings Bank ($000) Total State Bank ($000) Total Ossian State Bank ($000) Total Combined Banks ($000) Total Construction $1,164 0.4% Construction $136,977 10.2% Construction $91 0.2% Construction $138,232 8.0% Farm Loans $3,092 0.9% Farm Loans $182,918 13.6% Farm Loans $10,253 19.0% Farm Loans $196,263 11.3% 1-4 Family $183,172 56.1% 1-4 Family $172,625 12.8% 1-4 Family $10,015 18.6% 1-4 Family $365,812 21.2% Owner-Occupied CRE $17,513 5.4% Owner-Occupied CRE $181,214 13.4% Owner-Occupied CRE $9,920 18.4% Owner-Occupied CRE $208,647 12.1% Other CRE Loans $35,464 10.9% Other CRE Loans $246,391 18.3% Other CRE Loans $12,766 23.7% Other CRE Loans $294,621 17.0% Multi-Family $62,773 19.2% Multi-Family $61,760 4.6% Multi-Family $1,042 1.9% Multi-Family $125,575 7.3% C&I $20,256 6.2% C&I $202,958 15.0% C&I $7,743 14.4% C&I $230,957 13.4% Consumer $2,417 0.7% Consumer $53,879 4.0% Consumer $1,082 2.0% Consumer $57,378 3.3% Agricultural $252 0.1% Agricultural $100,022 7.4% Agricultural $763 1.4% Agricultural $101,037 5.8% Other Loans $369 0.1% Other Loans $14,654 1.1% Other Loans $242 0.4% Other Loans $15,265 0.9% Less: Unearned Income $0 0.0% Less: Unearned Income $4,208 0.3% Less: Unearned Income $0 0.0% Less: Unearned Income $4,208 0.2% Total Loans $326,472 100.0% Total Loans $1,349,190 100.0% Total Loans $53,917 100.0% Total Loans $1,729,579 100.0% We Nurture Lasting Relationships 2021Q1 Loan Yield 4.43% 2021Q1 Loan Yield 4.70% 2021Q1 Loan Yield 4.59% Combined 2021Q1 Loan Yield 4.65% 7

Pro Forma Deposit Mix Perpetual Federal Savings Farmers & Merchants State Ossian State Bank Combined Banks Bank Bank Jumbo Jumbo Jumbo Retail Time Retail Nonint. Time Time Time Jumbo Deposits NOW, Time Deposits Bearing Deposits Deposits Time 4.0% MMDA, Deposits 1.0% 1.1% 1.9% 9.3% Deposits Savings 12.3% 16.6% 19.5% Retail Time Nonint. Nonint. Deposits Bearing Nonint. Bearing 19.4% 20.9% Bearing 23.9% 30.1% NOW, Retail NOW, MMDA, NOW, Time MMDA, Savings MMDA, Deposits Savings 59.5% Savings 62.9% 61.9% 55.7% Perpetual Federal Balance % of Farmers & Merchants Balance % of Balance % of Balance % of Savings Bank ($000) Total State Bank ($000) Total Ossian State Bank ($000) Total Combined Banks ($000) Total Noninterest Bearing $3,048 1.0% Noninterest Bearing $407,392 23.9% Noninterest Bearing $35,225 30.1% Noninterest Bearing $445,665 20.9% NOW, MMDA, Savings $1,185,724 55.7% NOW, MMDA, Savings $59,393 19.5% NOW, MMDA, Savings $1,056,576 61.9% NOW, MMDA, Savings $69,755 59.5% Retail Time Deposits $192,051 62.9% Retail Time Deposits $210,573 12.3% Retail Time Deposits $10,915 9.3% Retail Time Deposits $413,539 19.4% Jumbo Time Deposits $50,661 16.6% Jumbo Time Deposits $32,143 1.9% Jumbo Time Deposits $1,311 1.1% Jumbo Time Deposits $84,115 4.0% Total Deposits $2,129,043 100.0% Total Deposits $305,153 100.0% Total Deposits $1,706,684 100.0% Total Deposits $117,206 100.0% 2021Q1 Cost of Total Deposits 1.62% 2021Q1 Cost of Total Deposits 0.32% 2021Q1 Cost of Total Deposits 0.13% Combined 2021Q1 Cost of Total Deposits 0.50% We Nurture Lasting Relationships 8Pro Forma Deposit Mix Perpetual Federal Savings Farmers & Merchants State Ossian State Bank Combined Banks Bank Bank Jumbo Jumbo Jumbo Retail Time Retail Nonint. Time Time Time Jumbo Deposits NOW, Time Deposits Bearing Deposits Deposits Time 4.0% MMDA, Deposits 1.0% 1.1% 1.9% 9.3% Deposits Savings 12.3% 16.6% 19.5% Retail Time Nonint. Nonint. Deposits Bearing Nonint. Bearing 19.4% 20.9% Bearing 23.9% 30.1% NOW, Retail NOW, MMDA, NOW, Time MMDA, Savings MMDA, Deposits Savings 59.5% Savings 62.9% 61.9% 55.7% Perpetual Federal Balance % of Farmers & Merchants Balance % of Balance % of Balance % of Savings Bank ($000) Total State Bank ($000) Total Ossian State Bank ($000) Total Combined Banks ($000) Total Noninterest Bearing $3,048 1.0% Noninterest Bearing $407,392 23.9% Noninterest Bearing $35,225 30.1% Noninterest Bearing $445,665 20.9% NOW, MMDA, Savings $1,185,724 55.7% NOW, MMDA, Savings $59,393 19.5% NOW, MMDA, Savings $1,056,576 61.9% NOW, MMDA, Savings $69,755 59.5% Retail Time Deposits $192,051 62.9% Retail Time Deposits $210,573 12.3% Retail Time Deposits $10,915 9.3% Retail Time Deposits $413,539 19.4% Jumbo Time Deposits $50,661 16.6% Jumbo Time Deposits $32,143 1.9% Jumbo Time Deposits $1,311 1.1% Jumbo Time Deposits $84,115 4.0% Total Deposits $2,129,043 100.0% Total Deposits $305,153 100.0% Total Deposits $1,706,684 100.0% Total Deposits $117,206 100.0% 2021Q1 Cost of Total Deposits 1.62% 2021Q1 Cost of Total Deposits 0.32% 2021Q1 Cost of Total Deposits 0.13% Combined 2021Q1 Cost of Total Deposits 0.50% We Nurture Lasting Relationships 8
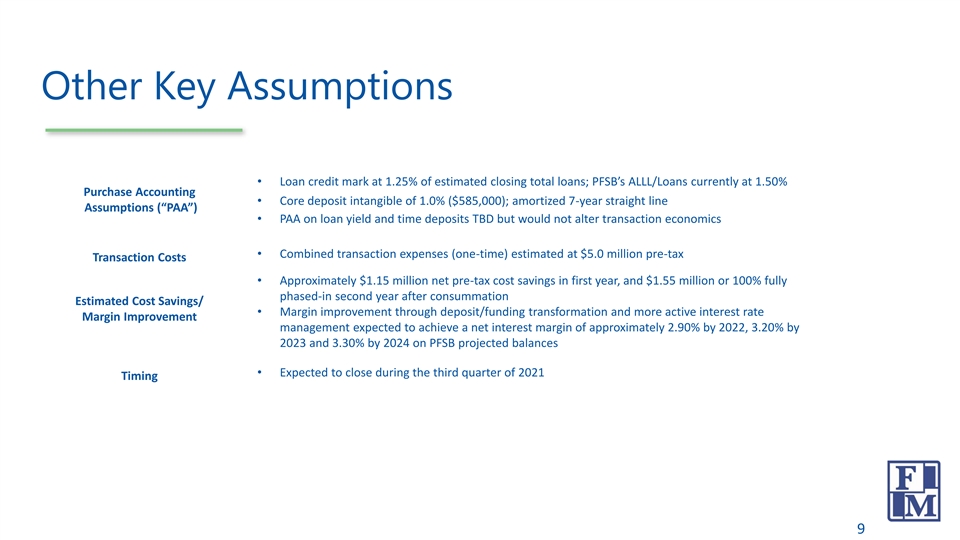
Other Key Assumptions • Loan credit mark at 1.25% of estimated closing total loans; PFSB’s ALLL/Loans currently at 1.50% Purchase Accounting • Core deposit intangible of 1.0% ($585,000); amortized 7-year straight line Assumptions (“PAA”) • PAA on loan yield and time deposits TBD but would not alter transaction economics • Combined transaction expenses (one-time) estimated at $5.0 million pre-tax Transaction Costs • Approximately $1.15 million net pre-tax cost savings in first year, and $1.55 million or 100% fully phased-in second year after consummation Estimated Cost Savings/ • Margin improvement through deposit/funding transformation and more active interest rate Margin Improvement management expected to achieve a net interest margin of approximately 2.90% by 2022, 3.20% by 2023 and 3.30% by 2024 on PFSB projected balances • Expected to close during the third quarter of 2021 Timing We Nurture Lasting Relationships 9Other Key Assumptions • Loan credit mark at 1.25% of estimated closing total loans; PFSB’s ALLL/Loans currently at 1.50% Purchase Accounting • Core deposit intangible of 1.0% ($585,000); amortized 7-year straight line Assumptions (“PAA”) • PAA on loan yield and time deposits TBD but would not alter transaction economics • Combined transaction expenses (one-time) estimated at $5.0 million pre-tax Transaction Costs • Approximately $1.15 million net pre-tax cost savings in first year, and $1.55 million or 100% fully phased-in second year after consummation Estimated Cost Savings/ • Margin improvement through deposit/funding transformation and more active interest rate Margin Improvement management expected to achieve a net interest margin of approximately 2.90% by 2022, 3.20% by 2023 and 3.30% by 2024 on PFSB projected balances • Expected to close during the third quarter of 2021 Timing We Nurture Lasting Relationships 9

Transaction Multiples / Pro Forma Results FMAO Acquisition of PFSB Aggregate Shares Issued 1,833,999 Aggregate Cash Consideration $59.2 million (1) Aggregate Deal Value $103.7 million (2) Price/TBV (03/31/2021) 131% (3) Price/LTM Earnings (03/31/2021) 21.7x (4) Expected Year 1 EPS Accretion 10.0% Expected Year 2 EPS Accretion 14.5% TBV Dilution at Closing 6.6% TBV Payback Period (crossover method) 3.9 years Internal Rate of Return >20% (1) Based on FMAO’s May 3, 2021 closing price of $24.22 (2) Based on PFSB’s tangible equity of $79.1 million at 03/31/2021 (3) PFSB’s last 12 months (LTM) net income for the period ended 03/31/2021 of $4.8 million (4) Excluding estimated one-time transaction costs to be incurred year one We Nurture Lasting Relationships 10Transaction Multiples / Pro Forma Results FMAO Acquisition of PFSB Aggregate Shares Issued 1,833,999 Aggregate Cash Consideration $59.2 million (1) Aggregate Deal Value $103.7 million (2) Price/TBV (03/31/2021) 131% (3) Price/LTM Earnings (03/31/2021) 21.7x (4) Expected Year 1 EPS Accretion 10.0% Expected Year 2 EPS Accretion 14.5% TBV Dilution at Closing 6.6% TBV Payback Period (crossover method) 3.9 years Internal Rate of Return >20% (1) Based on FMAO’s May 3, 2021 closing price of $24.22 (2) Based on PFSB’s tangible equity of $79.1 million at 03/31/2021 (3) PFSB’s last 12 months (LTM) net income for the period ended 03/31/2021 of $4.8 million (4) Excluding estimated one-time transaction costs to be incurred year one We Nurture Lasting Relationships 10

History of Organic & Acquisition Growth FMAO Achieves Record Earnings FMAO - Total Assets ($Millions) FMAO - Net Income ($Millions) $2,750 $30.0 Implied CAGR = 31.1% Implied CAGR = 20.1% $2,513 $2,250 $25.0 $26.4 $1,993 $1,750 $20.0 $1,910 $20.1 $1,607 $18.4 $1,250 $15.0 $14.9 $1,116 $12.7 $750 $10.0 2018Y 2019Y 2020Y 2021Q1 Pro Forma 2017Y 2018Y 2019Y 2020Y Pro Forma CAGR = Compound Annual Growth Rate • FMAO’s pro forma 03/31/2021 (including stated Ossian and PFSB) total assets over $2.5 billion representing 125% increase from YE 2018 and last 12 months net income (Ossian tax-adjusted) over $26.4 million representing an implied CAGR over 20% since 2017 • Record earnings in 2018, 2019 and 2020 M&A Complements Organic • Net income of more than $20 million in 2020 including $7.0 million loan loss provision expense Growth to Achieve Record • Announces PFSB transaction on 05/04/2021 with current total assets of $390 million Earnings • Announced Ossian Financial Services transaction in December 2020 and closed April 2021 with 03/31/2021 total assets at $130 million • Acquired Adams County Financial Resources with $83 million in AUM – November 2020 We Nurture Lasting Relationships • Closed Limberlost Bancshares, Inc. on 01/01/2019 with $290 million in total assets 11History of Organic & Acquisition Growth FMAO Achieves Record Earnings FMAO - Total Assets ($Millions) FMAO - Net Income ($Millions) $2,750 $30.0 Implied CAGR = 31.1% Implied CAGR = 20.1% $2,513 $2,250 $25.0 $26.4 $1,993 $1,750 $20.0 $1,910 $20.1 $1,607 $18.4 $1,250 $15.0 $14.9 $1,116 $12.7 $750 $10.0 2018Y 2019Y 2020Y 2021Q1 Pro Forma 2017Y 2018Y 2019Y 2020Y Pro Forma CAGR = Compound Annual Growth Rate • FMAO’s pro forma 03/31/2021 (including stated Ossian and PFSB) total assets over $2.5 billion representing 125% increase from YE 2018 and last 12 months net income (Ossian tax-adjusted) over $26.4 million representing an implied CAGR over 20% since 2017 • Record earnings in 2018, 2019 and 2020 M&A Complements Organic • Net income of more than $20 million in 2020 including $7.0 million loan loss provision expense Growth to Achieve Record • Announces PFSB transaction on 05/04/2021 with current total assets of $390 million Earnings • Announced Ossian Financial Services transaction in December 2020 and closed April 2021 with 03/31/2021 total assets at $130 million • Acquired Adams County Financial Resources with $83 million in AUM – November 2020 We Nurture Lasting Relationships • Closed Limberlost Bancshares, Inc. on 01/01/2019 with $290 million in total assets 11

Forward-Looking Statements This presentation may contain “forward-looking statements” within the meaning of the U.S. Private Securities Litigation Reform Act of 1995. Any statements about our expectations, beliefs, plans, strategies, predictions, forecasts, objectives or assumptions of future events or performance are not historical facts and may be forward-looking. These statements include, but are not limited to, the expected completion date, financial benefits and other effects of the proposed merger of FMAO and PFSB. These statements are often, but not always, made through the use of words or phrases such as “anticipates,” “believes,” “expects,” “can,” “could,” “may,” “predicts,” “potential,” “opportunity,” “should,” “will,” “estimate,” “plans,” “projects,” “continuing,” “ongoing,” “expects,” “seeks,” “intends” and similar words or phrases. Accordingly, these statements involve estimates, known and unknown risks, assumptions and uncertainties that could cause actual strategies, actions or results to differ materially from those expressed in them, and are not guarantees of timing, future results or other events or performance. Because forward-looking statements are necessarily only estimates of future strategies, actions or results, based on management’s current expectations, assumptions and estimates on the date hereof, and there can be no assurance that actual strategies, actions or results will not differ materially from expectations, readers are cautioned not to place undue reliance on such statements. Factors that may cause such a difference include, but are not limited to, the reaction to the transaction of the companies’ customers, employees and counterparties; customer disintermediation; inflation; expected synergies, cost savings and other financial benefits of the proposed transaction might not be realized within the expected timeframes or might be less than projected; the requisite shareholder and regulatory approvals for the proposed transaction might not be obtained; credit and interest rate risks associated with FMAO’s and PFSB’s respective businesses, customers, borrowings, repayment, investment, and deposit practices; general economic conditions, either nationally or in the market areas in which FMAO and PFSB operate or anticipate doing business, are less favorable than expected; new regulatory or legal requirements or obligations; and other risks; certain risks and important factors that could affect FMAO’s future results are identified in its Annual Report on Form10-K for the year ended December 31, 2020 and other reports filed with the SEC, including among other things under the heading “Risk Factors” in such Annual Report on Form 10-K. Any forward-looking statement speaks only as of the date on which it is made, and FMAO undertakes no obligation to update any forward-looking state We Nurture Lasting Relationships 12Forward-Looking Statements This presentation may contain “forward-looking statements” within the meaning of the U.S. Private Securities Litigation Reform Act of 1995. Any statements about our expectations, beliefs, plans, strategies, predictions, forecasts, objectives or assumptions of future events or performance are not historical facts and may be forward-looking. These statements include, but are not limited to, the expected completion date, financial benefits and other effects of the proposed merger of FMAO and PFSB. These statements are often, but not always, made through the use of words or phrases such as “anticipates,” “believes,” “expects,” “can,” “could,” “may,” “predicts,” “potential,” “opportunity,” “should,” “will,” “estimate,” “plans,” “projects,” “continuing,” “ongoing,” “expects,” “seeks,” “intends” and similar words or phrases. Accordingly, these statements involve estimates, known and unknown risks, assumptions and uncertainties that could cause actual strategies, actions or results to differ materially from those expressed in them, and are not guarantees of timing, future results or other events or performance. Because forward-looking statements are necessarily only estimates of future strategies, actions or results, based on management’s current expectations, assumptions and estimates on the date hereof, and there can be no assurance that actual strategies, actions or results will not differ materially from expectations, readers are cautioned not to place undue reliance on such statements. Factors that may cause such a difference include, but are not limited to, the reaction to the transaction of the companies’ customers, employees and counterparties; customer disintermediation; inflation; expected synergies, cost savings and other financial benefits of the proposed transaction might not be realized within the expected timeframes or might be less than projected; the requisite shareholder and regulatory approvals for the proposed transaction might not be obtained; credit and interest rate risks associated with FMAO’s and PFSB’s respective businesses, customers, borrowings, repayment, investment, and deposit practices; general economic conditions, either nationally or in the market areas in which FMAO and PFSB operate or anticipate doing business, are less favorable than expected; new regulatory or legal requirements or obligations; and other risks; certain risks and important factors that could affect FMAO’s future results are identified in its Annual Report on Form10-K for the year ended December 31, 2020 and other reports filed with the SEC, including among other things under the heading “Risk Factors” in such Annual Report on Form 10-K. Any forward-looking statement speaks only as of the date on which it is made, and FMAO undertakes no obligation to update any forward-looking state We Nurture Lasting Relationships 12

We Nurture Lasting RelationshipsWe Nurture Lasting Relationships