Attached files
| file | filename |
|---|---|
| 8-K - CURRENT REPORT - Custom Truck One Source, Inc. | ea140305-8k_customtruck.htm |
Exhibit 99.1
1 Custom Truck One Source Oppenheimer 16 th Annual Industrial Growth Conference May 4, 2021 CONFIDENTIAL DRAFT
2 This presentation includes certain financial measures that have not been prepared in a manner that complies with generally ac cep ted accounting principles in the United States (“GAAP”), including, without limitation, EBITDA, Adjusted EBITDA, and Pro Forma Adjusted EBITDA (collectively, the “non - GAAP financial measures”). These non - GAAP financial measures are not measures of financial performance in accordance with GAAP and may exclude items that are significant in understanding and assessing the Company’s financial result s. Therefore, these measures should not be considered in isolation or as an alternative to net income, net revenue, net cash provided by operating activities, earnings per fully - diluted share or other mea sures of profitability, liquidity or performance under GAAP. Management believes that these non - GAAP financial measures provide meaningful information to investors because they provide insight into how effecti vely we operate our business. You should be aware that these non - GAAP financial measures may not be comparable to similarly - titled measures used by other companies. Reconciliations of these non - GAAP financial measures to the most directly comparable GAAP financial measures can be found in the appendix of this presentation. Forward - Looking Statements Certain statements contained in this presentation may be considered forward - looking statements within the meaning of U.S. securi ties laws, including section 21E of the Securities Exchange Act of 1934, as amended, including statements regarding the proposed transaction and the ability to consummate the proposed transaction. When us ed in this communication, the words "potential," "estimates," "projected," "expects," "anticipates," "forecasts," "plans," "intends," "believes," "seeks," "may," "will," "should," "future," "propose" and variations of these words or similar expressions (or the negative versions of such words or expressions) are intended to identify forward - looking statements. These forward - looking statements are not guarantees of futu re performance, conditions or results, and involve a number of known and unknown risks, uncertainties, assumptions and other important factors, many of which are outside CTOS's control, that could c aus e actual results or outcomes to differ materially from those discussed in the forward - looking statements. Important factors, among others, that may affect actual results or outcomes include, on a combined b asis: that the financial condition and results of operations of the combined business may be adversely affected by the recent COVID - 19 pandemic or other similar outbreaks; the cyclical demand for CTOS’s se rvices and vulnerability to industry downturns and regional and national downturns; CTOS’s ability to obtain raw materials, component parts and/or finished goods in a timely and cost - effective manner; competition from existing and new competitors; increases in the cost of new equipment and CTOS’s ability to procure such equipment in a timely fashion; CTOS’s ability to recruit and retain experienced per sonnel; the impact of the current or additional unionization of CTOS’s workforce; the effect of disruptions in CTOS’s information technology systems, including CTOS’s customer relationship management system; CT OS’s ability to obtain additional capital on commercially reasonable terms; CTOS’s ability to renew its leases upon their expiration; CTOS’s ability to keep pace with technological developments; potent ial disruptions at CTOS’s production and manufacturing locations; the potential impact of material weaknesses in CTOS’s system of internal controls; the impact of third party reports on market perception o f C TOS’s financial performance; unfavorable conditions or further disruptions in the capital and credit markets; CTOS’s relationships with equipment suppliers and dependence on key suppliers to obtain adequate or timely equipment; CTOS’s dependence on third - party contractors to provide us with various services; a need to recognize additional impairment charges related to goodwill, identified intangible assets an d f ixed assets; CTOS’s ability to collect on accounts receivable; risks related to CTOS’s international operations; risks related to legal proceedings or claims, including liability claims; laws and regulatory devel opm ents that may fail to result in increased demand for CTOS’s services; safety and environmental requirements that may subject us to unanticipated liabilities; expenses associated with the acquisition of Cust om Truck and a potential inability to integrate the combined business; impacts of the accounting treatment applicable to the Acquisition; the risk that the cost savings, synergies and growth from the acquisi tio n of Custom Truck may not be fully realized or may take longer to realize than expected; the uncertainty associated with CTOS’s pro forma condensed combined financial information; CTOS’s substantial indeb ted ness and maintaining compliance with debt covenants; CTOS’s ability to incur additional indebtedness; CTOS’s ability to generate cash to service its indebtedness; the amount and nature of the debt in curred to finance the acquisition of Custom Truck; and other factors discussed under the heading “Risk Factors” in the offering memorandum. Should one or more of these material risks occur, or should the und erlying assumptions change or prove incorrect, CTOS's actual results, performance, achievements or plans could differ materially from those expressed or implied in any forward - looking statement. The forward - looking statements contained herein speak only as of the date hereof, and CTOS undertakes no obligation to update or revise any forward - looking statements, whether as a result of new information, fu ture events or otherwise, except as required by law. This presentation includes market data and other statistical information from third party sources, including independent indu str y publications, government publications and other published independent sources. Although CTOS believes these third party sources are reliable as of their respective dates, CTOS has not independent ly verified the accuracy or completeness of this information. CTOS makes no representation or warranty as to the accuracy or completeness of the information contained in this presentation. This present ati on is not intended to be all - inclusive or to contain all the information that a person may desire in considering an investment in CTOS. This presentation is for informational purposes only and is not intended to and does not constitute, or form part of, an offe r, invitation or the solicitation of an offer or invitation to purchase, otherwise acquire, subscribe for, sell or otherwise dispose of any securities, or the solicitation of any vote or approval in any jurisdiction o f t he acquisition of CTOS or otherwise, nor shall there be any sale, issuance or transfer of securities in any jurisdiction in contravention of applicable law. in particular, this document is not an offer of securitie s f or sale into the united states. no offer of securities shall be made into the united states absent registration under the Securities Act of 1933, as amended, or pursuant to an exemption from, or in a transaction not s ubj ect to such registration requirements. Disclaimer 2
3 Presenters Fred Ross Chief Executive Officer Ryan McMonagle President & Chief Operating Officer Brad Meader Chief Financial Officer
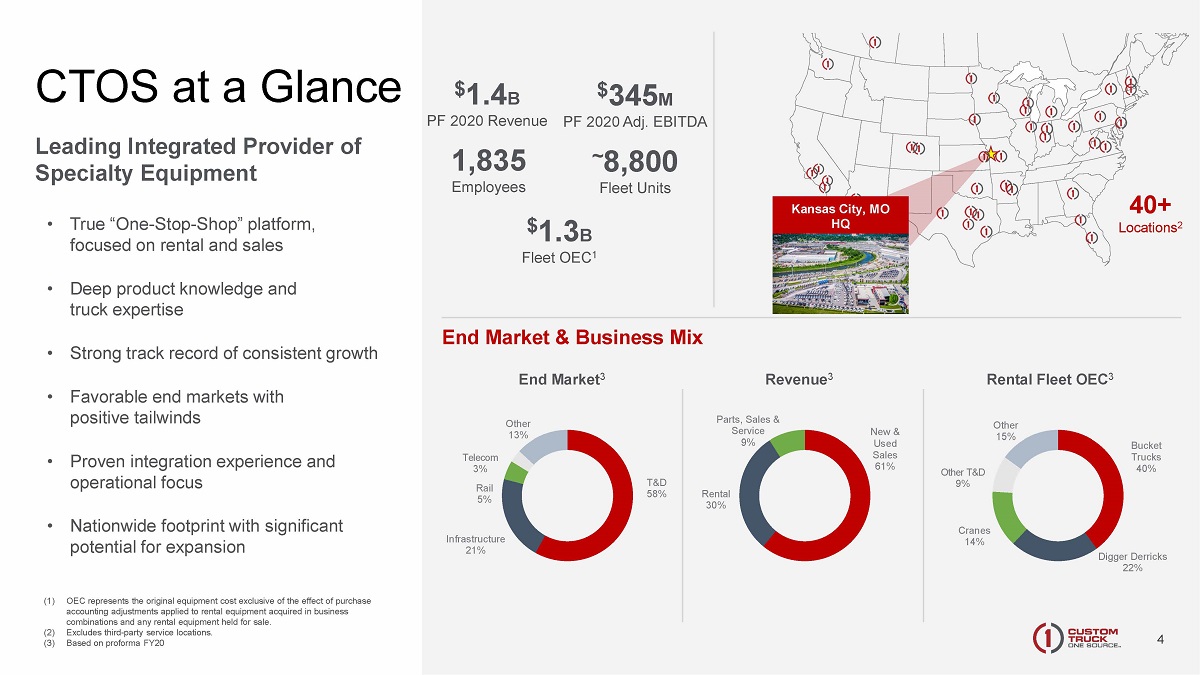
4 CTOS at a Glance 4 End Market & Business Mix Rental Fleet OEC 3 Revenue 3 End Market 3 Bucket Trucks 40% Digger Derricks 22% Cranes 14% Other T&D 9% Other 15% T&D 58% Infrastructure 21% Rail 5% Telecom 3% Other 13% New & Used Sales 61% Rental 30% Parts, Sales & Service 9% ~ 8 ,800 Fleet Units $ 1.4 B PF 2020 Revenue $ 345 M PF 2020 Adj. EBITDA $ 1.3 B Fleet OEC 1 1,835 Employees 40+ Locations 2 Leading Integrated Provider of Specialty Equipment • True “One - Stop - Shop” platform, focused on rental and sales • Deep product knowledge and truck expertise • Strong track record of consistent growth • Favorable end markets with positive tailwinds • Proven integration experience and operational focus • Nationwide footprint with significant potential for expansion (1) OEC represents the original equipment cost exclusive of the effect of purchase accounting adjustments applied to rental equipment acquired in business combinations and any rental equipment held for sale. (2) Excludes third - party service locations. (3) Based on proforma FY20 Kansas City, MO HQ
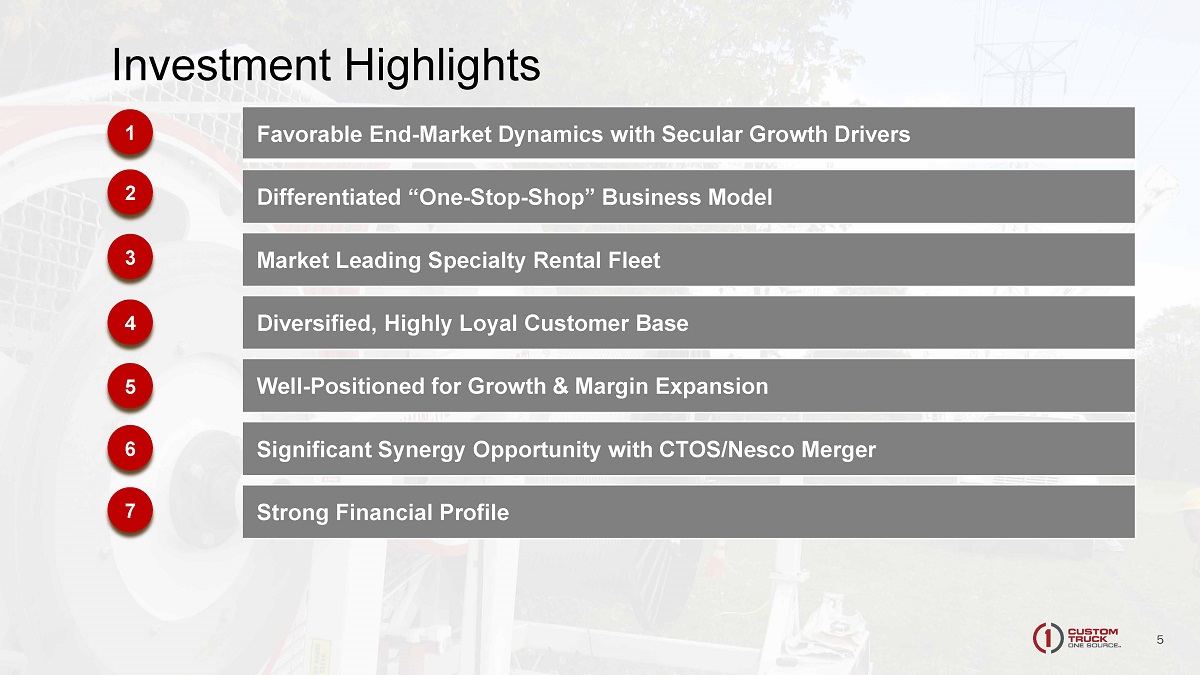
5 5 Favorable End - Market Dynamics with Secular Growth Drivers Differentiated “One - Stop - Shop” Business Model Market Leading Specialty Rental Fleet Diversified, Highly Loyal Customer Base Well - Positioned for Growth & Margin Expansion Significant Synergy Opportunity with CTOS/ Nesco Merger Strong Financial Profile 1 2 3 4 5 6 7 Investment Highlights
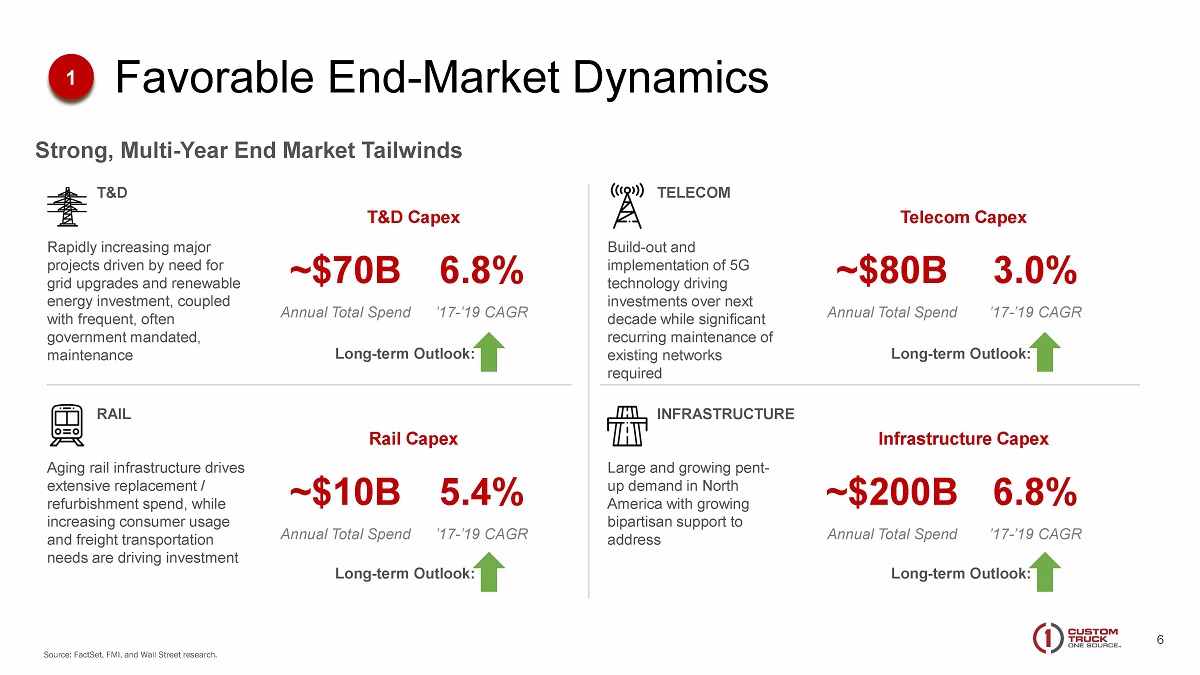
6 Favorable End - Market Dynamics 1 Telecom Capex Rail Capex T&D Infrastructure Capex Rapidly increasing major projects driven by need for grid upgrades and renewable energy investment, coupled with frequent, often government mandated, maintenance Aging rail infrastructure drives extensive replacement / refurbishment spend, while increasing consumer usage and freight transportation needs are driving investment RAIL TELECOM Build - out and implementation of 5G technology driving investments over next decade while significant recurring maintenance of existing networks required INFRASTRUCTURE Large and growing pent - up demand in North America with growing bipartisan support to address T&D Capex 5.4% ’17 - ’19 CAGR 6.8% ’17 - ’19 CAGR 3.0% ’17 - ’19 CAGR 6.8% ’17 - ’19 CAGR Long - term Outlook: Long - term Outlook: Long - term Outlook: Long - term Outlook: Source: FactSet , FMI, and Wall Street research. ~$10B Annual Total Spend ~$70B Annual Total Spend ~$80B Annual Total Spend ~$200B Annual Total Spend Strong, Multi - Year End Market Tailwinds
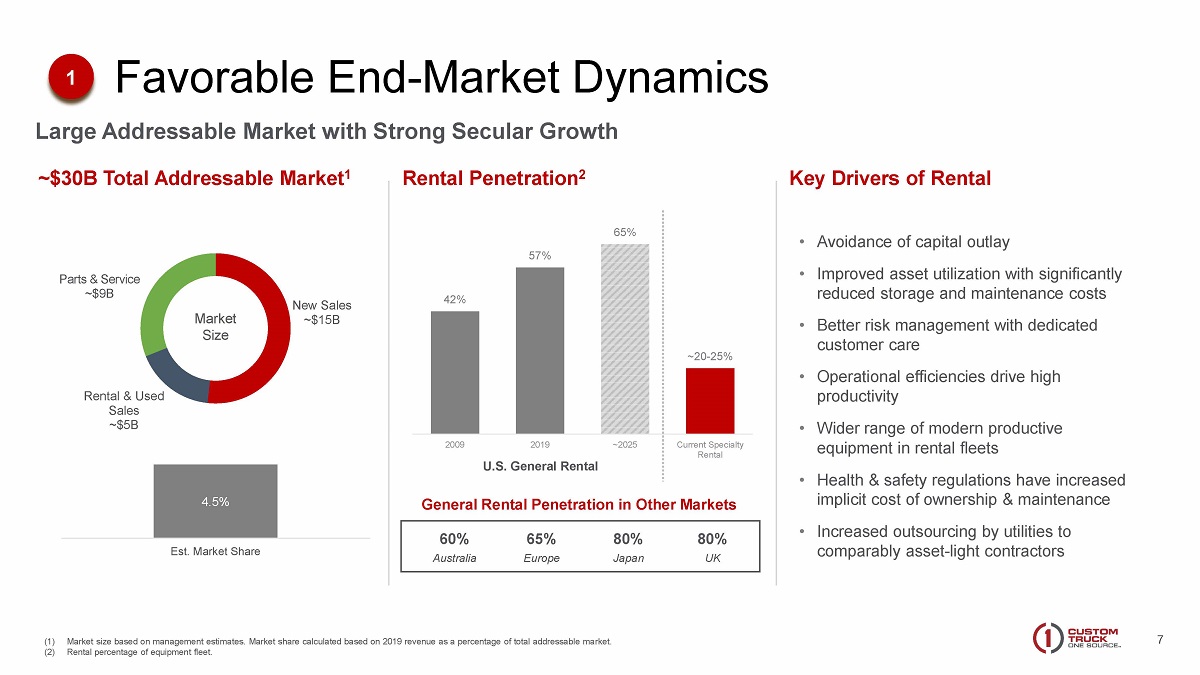
7 (1) Market size based on management estimates. Market share calculated based on 2019 revenue as a percentage of total addressable ma rket. (2) Rental percentage of equipment fleet. Rental Penetration 2 Key Drivers of Rental New Sales ~$15B Rental & Used Sales ~$5B Parts & Service ~$9B Market Size 4.5% Est. Market Share • Avoidance of capital outlay • Improved asset utilization with significantly reduced storage and maintenance costs • Better risk management with dedicated customer care • Operational efficiencies drive high productivity • Wider range of modern productive equipment in rental fleets • Health & safety regulations have increased implicit cost of ownership & maintenance • Increased outsourcing by utilities to comparably asset - light contractors ~$30B Total Addressable Market 1 42% 57% 65% ~20 - 25% 2009 2019 ~2025 Current Specialty Rental U.S. General Rental General Rental Penetration in Other Markets 60% Australia 65% Europe 80% Japan 80% UK Favorable End - Market Dynamics 1 Large Addressable Market with Strong Secular Growth
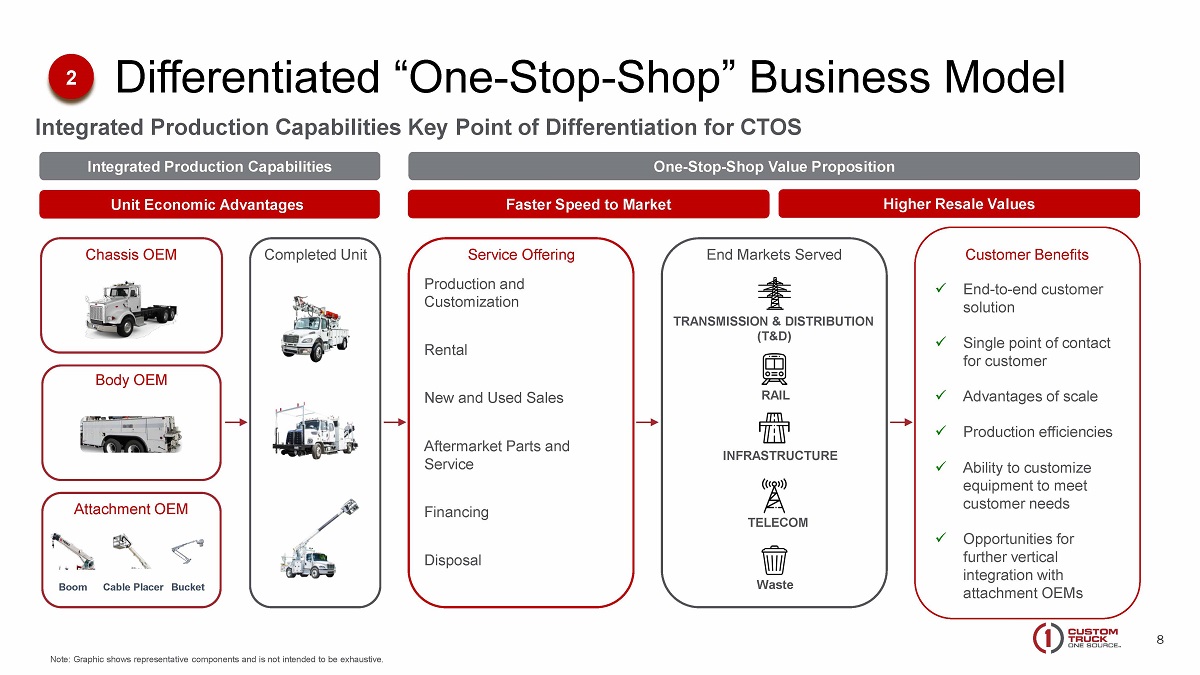
8 Production and Customization Rental New and Used Sales Aftermarket Parts and Service Financing Disposal x End - to - end customer solution x Single point of contact for customer x Advantages of scale x Production efficiencies x Ability to customize equipment to meet customer needs x Opportunities for further vertical integration with attachment OEMs Boom Bucket Cable Placer Note: Graphic shows representative components and is not intended to be exhaustive. Integrated Production Capabilities Key Point of Differentiation for CTOS TRANSMISSION & DISTRIBUTION (T&D) RAIL TELECOM INFRASTRUCTURE Waste Integrated Production Capabilities One - Stop - Shop Value Proposition End Markets Served Service Offering Customer Benefits Chassis OEM Body OEM Attachment OEM Completed Unit Differentiated “One - Stop - Shop” Business Model 2 Faster Speed to Market Higher Resale Values Unit Economic Advantages
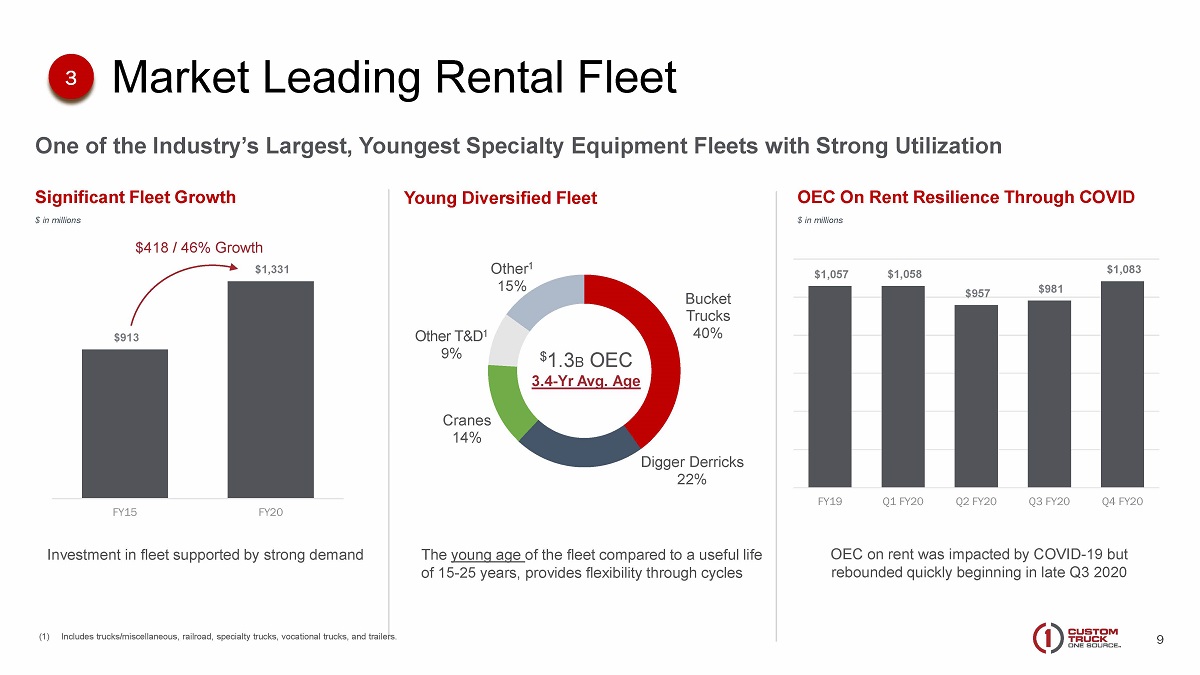
9 One of the Industry’s Largest, Youngest Specialty Equipment Fleets with Strong Utilization Market Leading Rental Fleet Note: Excludes CTOS PTA leased parts and accessories. All metrics as of 12/31/20. (1) Includes underground equipment, pressure diggers and line equipment for CTOS and track equipment for CTOS. (2) Includes trucks/miscellaneous for CTOS and railroad, specialty trucks, vocational trucks, trailers and other for CTOS. Bucket Truck Digger Derrick Crane Bucket Trucks 40% Digger Derricks 22% Cranes 14% Other T&D 1 9% Other 1 15% $ 1.3 B OEC 3.4 - Yr Avg. Age Roll - Off Track Digger 3 Young Diversified Fleet Significant Fleet Growth $ in millions $913 $1,331 FY15 FY20 $418 / 46% Growth Investment in fleet supported by strong demand The young age of the fleet compared to a useful life of 15 - 25 years, provides flexibility through cycles OEC on rent was impacted by COVID - 19 but rebounded quickly beginning in late Q3 2020 $1,057 $1,058 $957 $981 $1,083 FY19 Q1 FY20 Q2 FY20 Q3 FY20 Q4 FY20 OEC On Rent Resilience Through COVID $ in millions (1) Includes trucks/miscellaneous, railroad, specialty trucks, vocational trucks, and trailers.
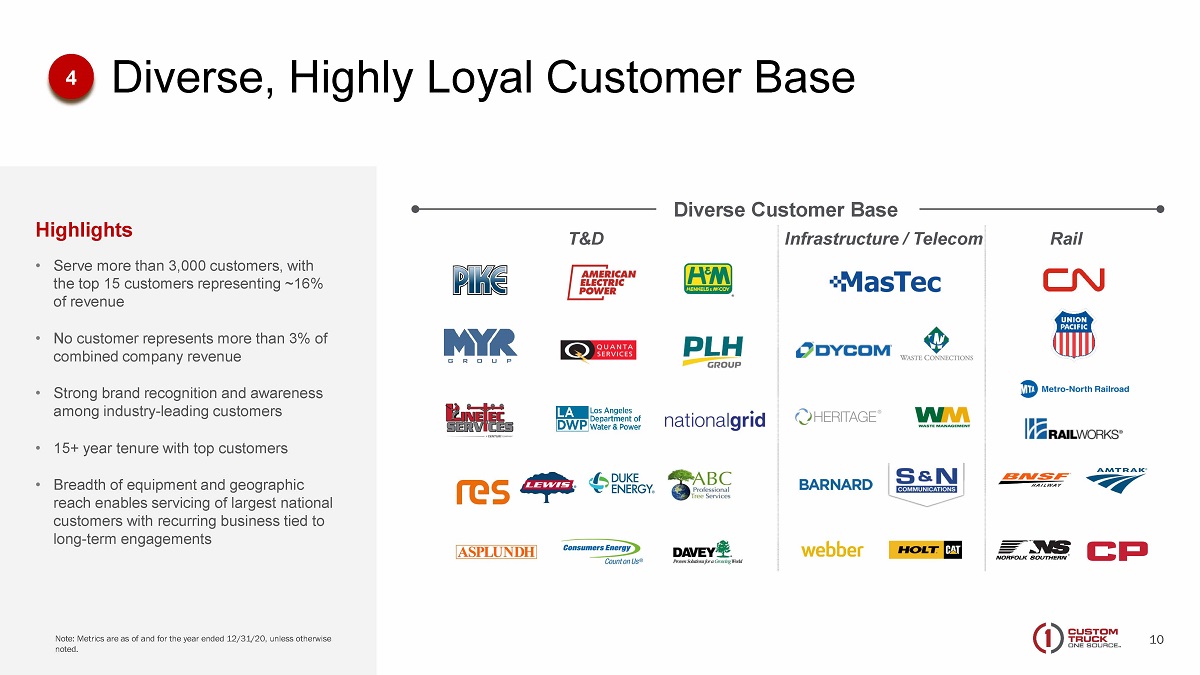
10 Note: Metrics are as of and for the year ended 12/31/20, unless otherwise noted. T&D Infrastructure / Telecom Rail Highlights • Serve more than 3,000 customers, with the top 15 customers representing ~16% of revenue • No customer represents more than 3% of combined company revenue • Strong brand recognition and awareness among industry - leading customers • 15+ year tenure with top customers • Breadth of equipment and geographic reach enables servicing of largest national customers with recurring business tied to long - term engagements Diverse Customer Base Diverse, Highly Loyal Customer Base 4
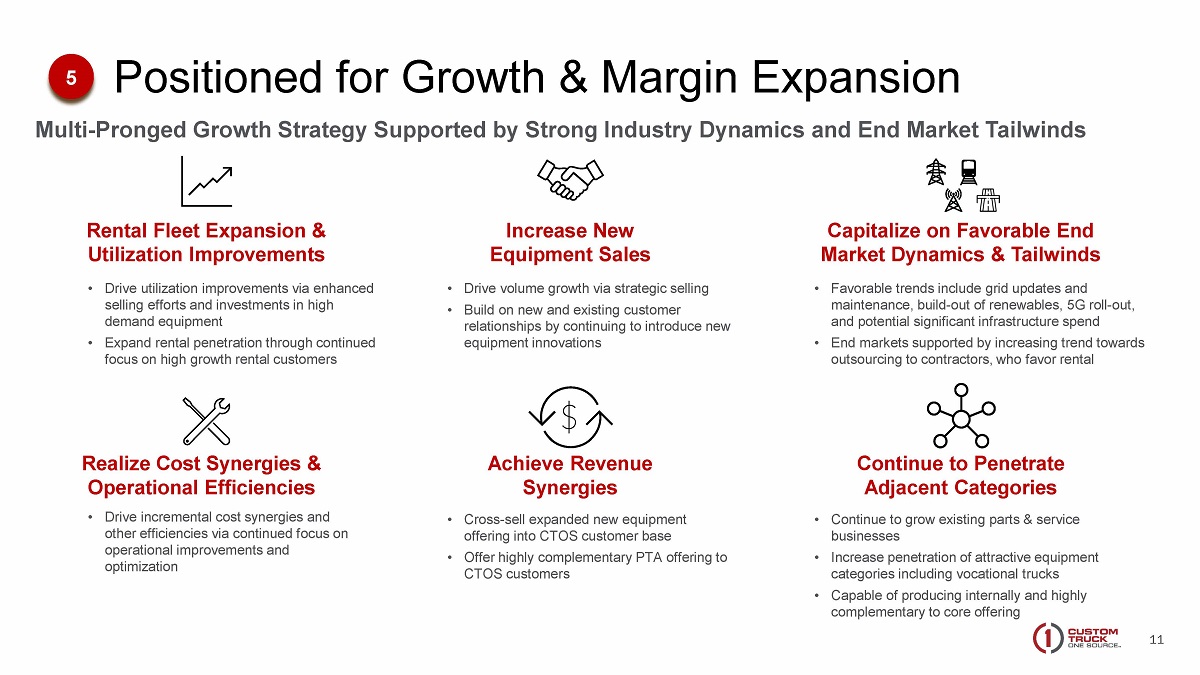
11 Positioned for Growth & Margin Expansion 11 5 Rental Fleet Expansion & Utilization Improvements Achieve Revenue Synergies Increase New Equipment Sales Capitalize on Favorable End Market Dynamics & Tailwinds Continue to Penetrate Adjacent Categories Realize Cost Synergies & Operational Efficiencies • Drive utilization improvements via enhanced selling efforts and investments in high demand equipment • Expand rental penetration through continued focus on high growth rental customers • Cross - sell expanded new equipment offering into CTOS customer base • Offer highly complementary PTA offering to CTOS customers • Drive volume growth via strategic selling • Build on new and existing customer relationships by continuing to introduce new equipment innovations • Favorable trends include grid updates and maintenance, build - out of renewables, 5G roll - out, and potential significant infrastructure spend • End markets supported by increasing trend towards outsourcing to contractors, who favor rental • Drive incremental cost synergies and other efficiencies via continued focus on operational improvements and optimization Multi - Pronged Growth Strategy Supported by Strong Industry Dynamics and End Market Tailwinds • Continue to grow existing parts & service businesses • Increase penetration of attractive equipment categories including vocational trucks • Capable of producing internally and highly complementary to core offering
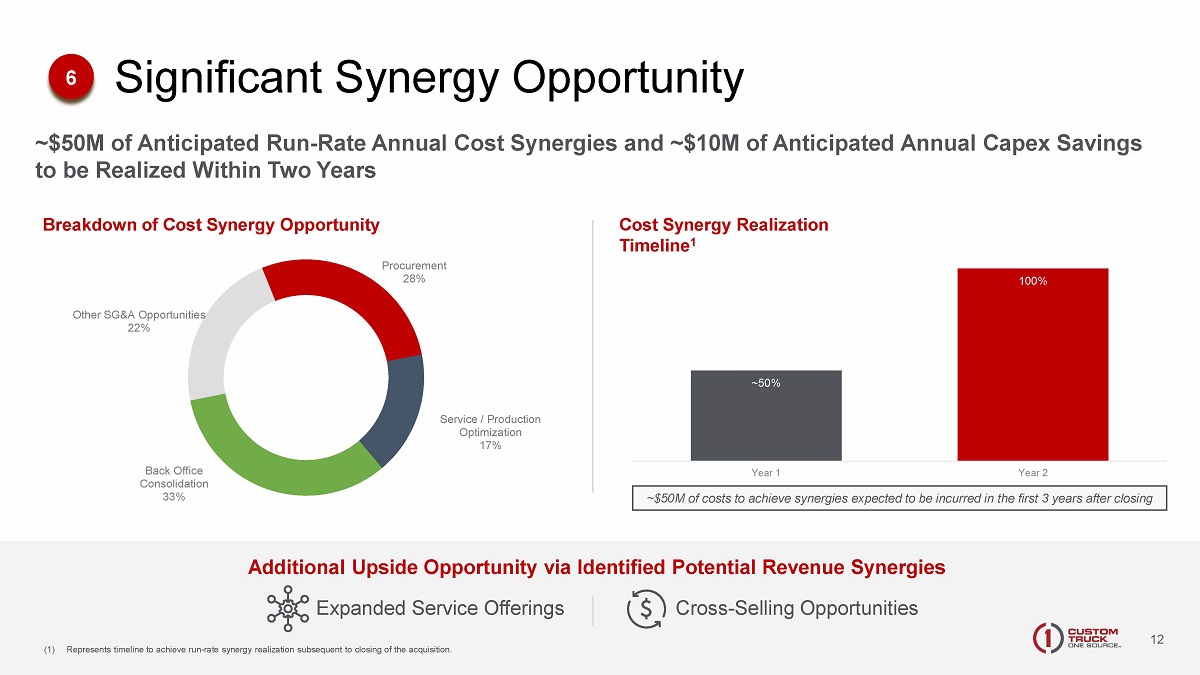
12 ~50% 100% Year 1 Year 2 ~$50M of Anticipated Run - Rate Annual Cost Synergies and ~$10M of Anticipated Annual Capex Savings to be Realized Within Two Years 12 Additional Upside Opportunity via Identified Potential Revenue Synergies Expanded Service Offerings Cross - Selling Opportunities Cost Synergy Realization Timeline 1 (1) Represents timeline to achieve run - rate synergy realization subsequent to closing of the acquisition. Procurement 28% Service / Production Optimization 17% Back Office Consolidation 33% Other SG&A Opportunities 22% Breakdown of Cost Synergy Opportunity Significant Synergy Opportunity 6 ~$50M of costs to achieve synergies expected to be incurred in the first 3 years after closing
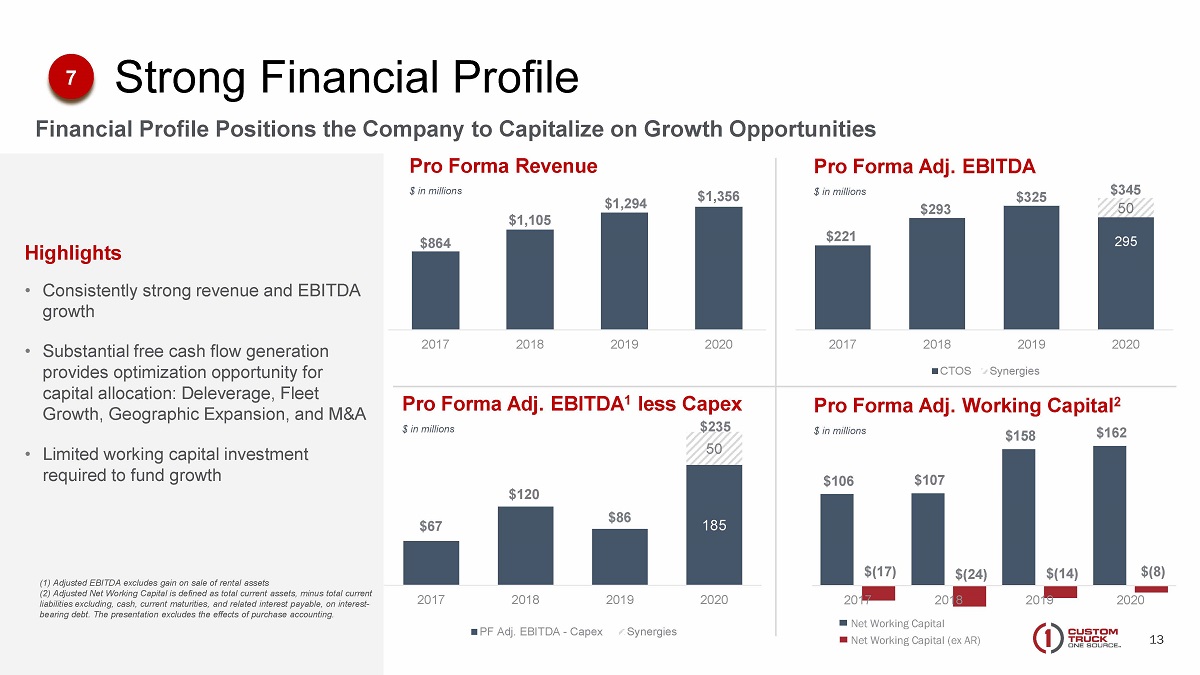
13 Financial Profile Positions the Company to Capitalize on Growth Opportunities Highlights • Consistently strong revenue and EBITDA growth • Substantial free cash flow generation provides optimization opportunity for capital allocation: Deleverage, Fleet Growth, Geographic Expansion, and M&A • Limited working capital investment required to fund growth Strong Financial Profile 7 $864 $1,105 $1,294 $1,356 2017 2018 2019 2020 $221 $293 $325 $345 295 50 2017 2018 2019 2020 CTOS Synergies Pro Forma Adj. EBITDA $ in millions Pro Forma Revenue $ in millions $67 $120 $86 $235 185 50 2017 2018 2019 2020 PF Adj. EBITDA - Capex Synergies Pro Forma Adj. EBITDA 1 less Capex $ in millions Pro Forma Adj. Working Capital 2 $ in millions (1) Adjusted EBITDA excludes gain on sale of rental assets (2) Adjusted Net Working Capital is defined as total current assets, minus total current liabilities excluding, cash, current maturities, and related interest payable, on interest - bearing debt. The presentation excludes the effects of purchase accounting. $106 $107 $158 $162 $(17) $(24) $(14) $(8) 2017 2018 2019 2020 Net Working Capital Net Working Capital (ex AR)
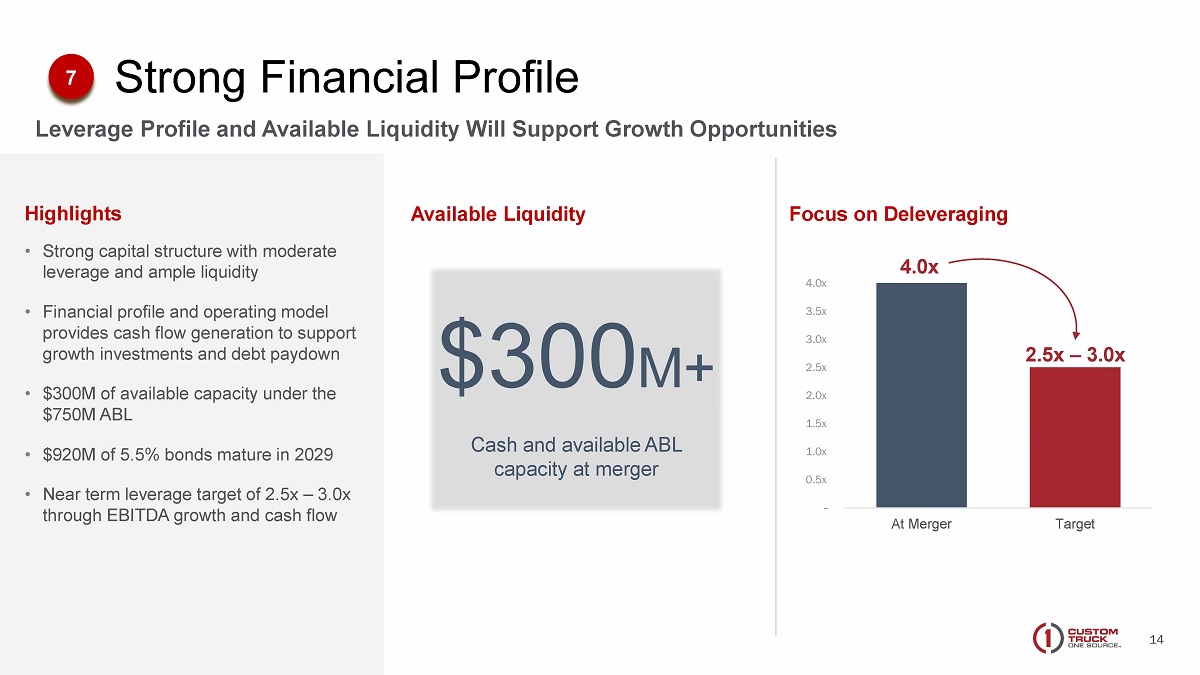
14 Leverage Profile and Available Liquidity Will Support Growth Opportunities Highlights • Strong capital structure with moderate leverage and ample liquidity • Financial profile and operating model provides cash flow generation to support growth investments and debt paydown • $300M of available capacity under the $750M ABL • $920M of 5.5% bonds mature in 2029 • Near term leverage target of 2.5x – 3.0x through EBITDA growth and cash flow Strong Financial Profile 7 Focus on Deleveraging Available Liquidity $300 M+ Cash and available ABL capacity at merger – 0.5x 1.0x 1.5x 2.0x 2.5x 3.0x 3.5x 4.0x At Merger Target 4.0x 2.5x – 3.0x
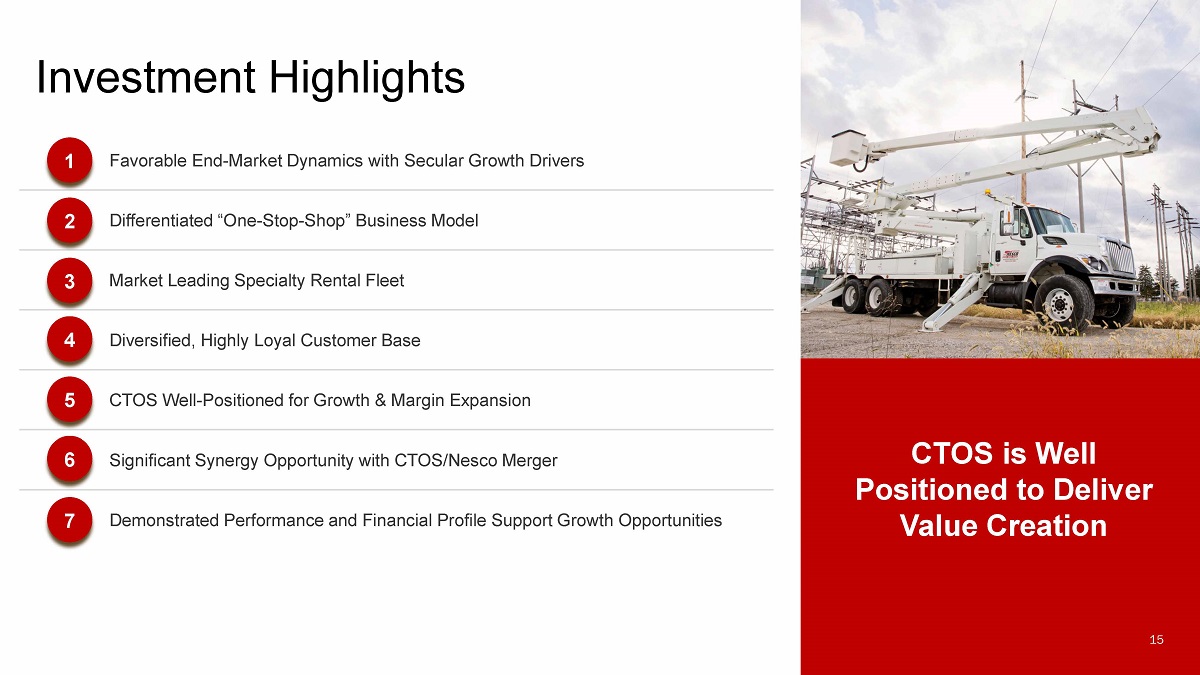
15 Investment Highlights 15 CTOS is Well Positioned to Deliver Value Creation 1 Favorable End - Market Dynamics with Secular Growth Drivers 2 Differentiated “One - Stop - Shop” Business Model 4 Market Leading Specialty Rental Fleet 5 Diversified, Highly Loyal Customer Base 6 CTOS Well - Positioned for Growth & Margin Expansion 7 Significant Synergy Opportunity with CTOS/ Nesco Merger 8 Demonstrated Performance and Financial Profile Support Growth Opportunities 1 2 3 4 5 6 7
16 Appendix
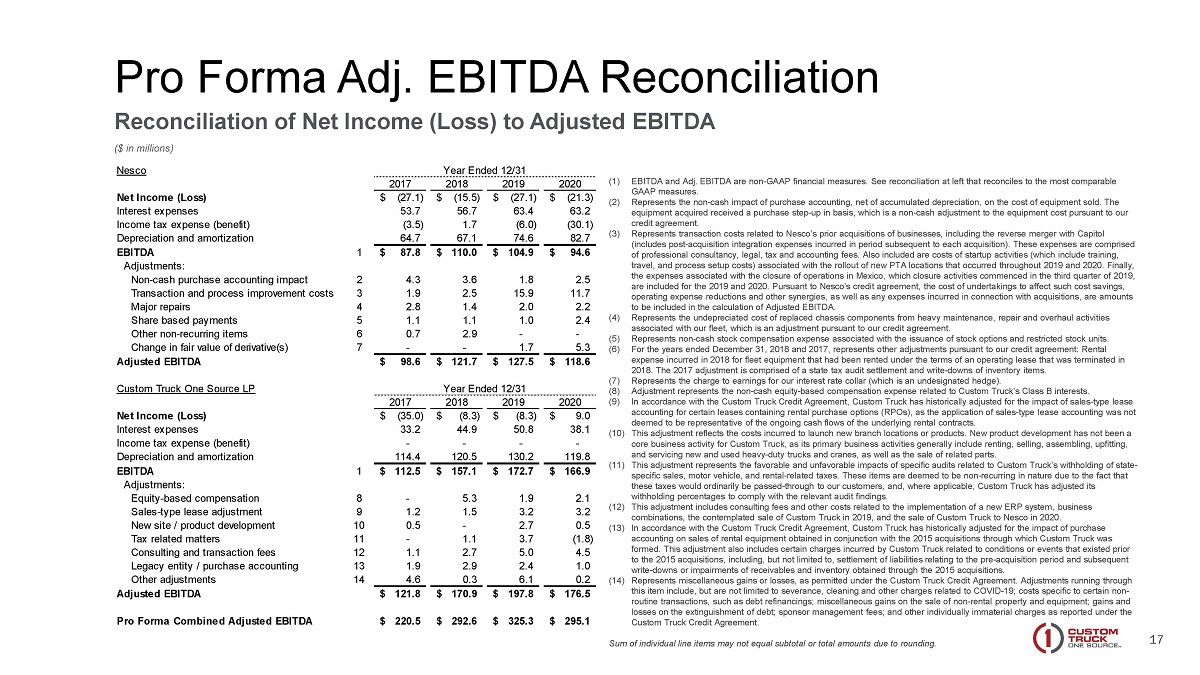
17 Pro Forma Adj. EBITDA Reconciliation Reconciliation of Net Income (Loss) to Adjusted EBITDA ($ in millions) (1) EBITDA and Adj. EBITDA are non - GAAP financial measures. See reconciliation at left that reconciles to the most comparable GAAP measures. (2) Represents the non - cash impact of purchase accounting, net of accumulated depreciation, on the cost of equipment sold. The equipment acquired received a purchase step - up in basis, which is a non - cash adjustment to the equipment cost pursuant to our credit agreement. (3) Represents transaction costs related to Nesco’s prior acquisitions of businesses, including the reverse merger with Capitol (includes post - acquisition integration expenses incurred in period subsequent to each acquisition). These expenses are comprised of professional consultancy, legal, tax and accounting fees. Also included are costs of startup activities (which include tra ini ng, travel, and process setup costs) associated with the rollout of new PTA locations that occurred throughout 2019 and 2020. Fin all y, the expenses associated with the closure of operations in Mexico, which closure activities commenced in the third quarter of 201 9, are included for the 2019 and 2020. Pursuant to Nesco’s credit agreement, the cost of undertakings to affect such cost savings, operating expense reductions and other synergies, as well as any expenses incurred in connection with acquisitions, are amoun ts to be included in the calculation of Adjusted EBITDA. (4) Represents the undepreciated cost of replaced chassis components from heavy maintenance, repair and overhaul activities associated with our fleet, which is an adjustment pursuant to our credit agreement. (5) Represents non - cash stock compensation expense associated with the issuance of stock options and restricted stock units. (6) For the years ended December 31, 2018 and 2017, represents other adjustments pursuant to our credit agreement: Rental expense incurred in 2018 for fleet equipment that had been rented under the terms of an operating lease that was terminated i n 2018. The 2017 adjustment is comprised of a state tax audit settlement and write - downs of inventory items. (7) Represents the charge to earnings for our interest rate collar (which is an undesignated hedge). (8) Adjustment represents the non - cash equity - based compensation expense related to Custom Truck’s Class B interests. (9) In accordance with the Custom Truck Credit Agreement, Custom Truck has historically adjusted for the impact of sales - type lease accounting for certain leases containing rental purchase options (RPOs), as the application of sales - type lease accounting was n ot deemed to be representative of the ongoing cash flows of the underlying rental contracts. (10) This adjustment reflects the costs incurred to launch new branch locations or products. New product development has not been a core business activity for Custom Truck, as its primary business activities generally include renting, selling, assembling, u pfi tting, and servicing new and used heavy - duty trucks and cranes, as well as the sale of related parts. (11) This adjustment represents the favorable and unfavorable impacts of specific audits related to Custom Truck’s withholding of sta te - specific sales, motor vehicle, and rental - related taxes. These items are deemed to be non - recurring in nature due to the fact th at these taxes would ordinarily be passed - through to our customers, and, where applicable, Custom Truck has adjusted its withholding percentages to comply with the relevant audit findings. (12) This adjustment includes consulting fees and other costs related to the implementation of a new ERP system, business combinations, the contemplated sale of Custom Truck in 2019, and the sale of Custom Truck to Nesco in 2020. (13) In accordance with the Custom Truck Credit Agreement, Custom Truck has historically adjusted for the impact of purchase accounting on sales of rental equipment obtained in conjunction with the 2015 acquisitions through which Custom Truck was formed. This adjustment also includes certain charges incurred by Custom Truck related to conditions or events that existed p rio r to the 2015 acquisitions, including, but not limited to, settlement of liabilities relating to the pre - acquisition period and su bsequent write - downs or impairments of receivables and inventory obtained through the 2015 acquisitions. (14) Represents miscellaneous gains or losses, as permitted under the Custom Truck Credit Agreement. Adjustments running through this item include, but are not limited to severance, cleaning and other charges related to COVID - 19; costs specific to certain n on - routine transactions, such as debt refinancings ; miscellaneous gains on the sale of non - rental property and equipment; gains and losses on the extinguishment of debt; sponsor management fees; and other individually immaterial charges as reported under th e Custom Truck Credit Agreement. Sum of individual line items may not equal subtotal or total amounts due to rounding. Nesco Year Ended 12/31 2017 2018 2019 2020 Net Income (Loss) (27.1)$ (15.5)$ (27.1)$ (21.3)$ Interest expenses 53.7 56.7 63.4 63.2 Income tax expense (benefit) (3.5) 1.7 (6.0) (30.1) Depreciation and amortization 64.7 67.1 74.6 82.7 EBITDA 1 87.8$ 110.0$ 104.9$ 94.6$ Adjustments: Non-cash purchase accounting impact 2 4.3 3.6 1.8 2.5 Transaction and process improvement costs 3 1.9 2.5 15.9 11.7 Major repairs 4 2.8 1.4 2.0 2.2 Share based payments 5 1.1 1.1 1.0 2.4 Other non-recurring items 6 0.7 2.9 - - Change in fair value of derivative(s) 7 - - 1.7 5.3 Adjusted EBITDA 98.6$ 121.7$ 127.5$ 118.6$ Custom Truck One Source LP Year Ended 12/31 2017 2018 2019 2020 Net Income (Loss) (35.0)$ (8.3)$ (8.3)$ 9.0$ Interest expenses 33.2 44.9 50.8 38.1 Income tax expense (benefit) - - - - Depreciation and amortization 114.4 120.5 130.2 119.8 EBITDA 1 112.5$ 157.1$ 172.7$ 166.9$ Adjustments: Equity-based compensation 8 - 5.3 1.9 2.1 Sales-type lease adjustment 9 1.2 1.5 3.2 3.2 New site / product development 10 0.5 - 2.7 0.5 Tax related matters 11 - 1.1 3.7 (1.8) Consulting and transaction fees 12 1.1 2.7 5.0 4.5 Legacy entity / purchase accounting 13 1.9 2.9 2.4 1.0 Other adjustments 14 4.6 0.3 6.1 0.2 Adjusted EBITDA 121.8$ 170.9$ 197.8$ 176.5$ Pro Forma Combined Adjusted EBITDA 220.5$ 292.6$ 325.3$ 295.1$
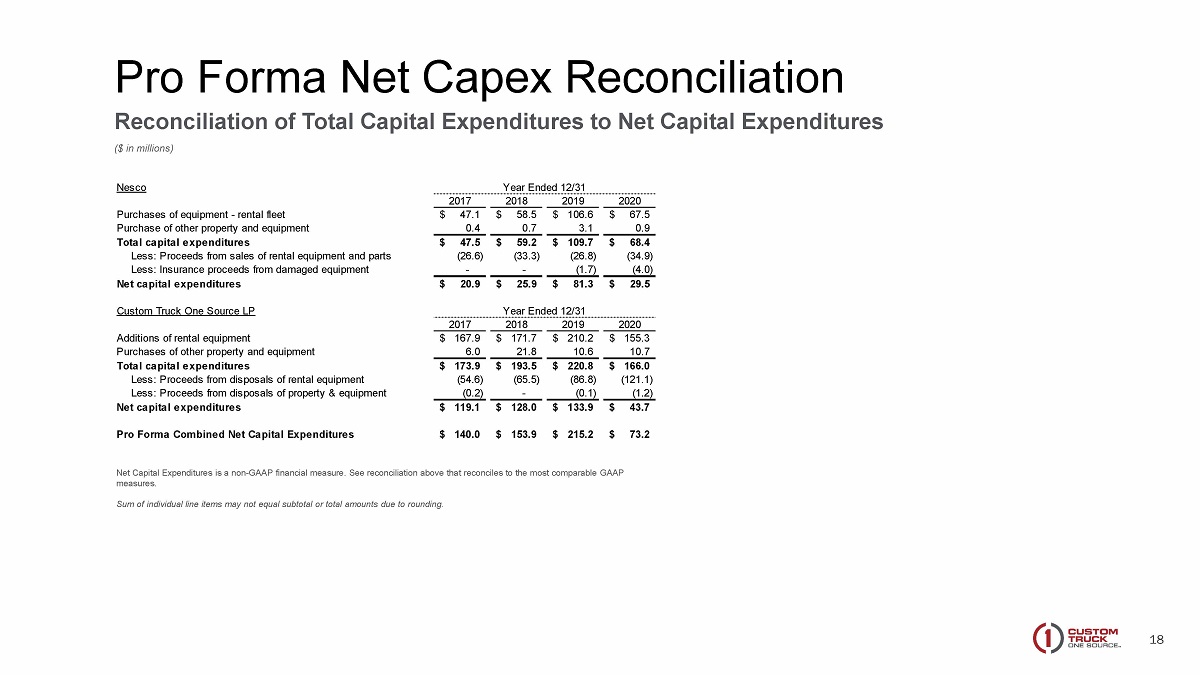
18 Pro Forma Net Capex Reconciliation Reconciliation of Total Capital Expenditures to Net Capital Expenditures ($ in millions) Net Capital Expenditures is a non - GAAP financial measure. See reconciliation above that reconciles to the most comparable GAAP measures. Sum of individual line items may not equal subtotal or total amounts due to rounding. Nesco Year Ended 12/31 2017 2018 2019 2020 Purchases of equipment - rental fleet 47.1$ 58.5$ 106.6$ 67.5$ Purchase of other property and equipment 0.4 0.7 3.1 0.9 Total capital expenditures 47.5$ 59.2$ 109.7$ 68.4$ Less: Proceeds from sales of rental equipment and parts (26.6) (33.3) (26.8) (34.9) Less: Insurance proceeds from damaged equipment - - (1.7) (4.0) Net capital expenditures 20.9$ 25.9$ 81.3$ 29.5$ Custom Truck One Source LP Year Ended 12/31 2017 2018 2019 2020 Additions of rental equipment 167.9$ 171.7$ 210.2$ 155.3$ Purchases of other property and equipment 6.0 21.8 10.6 10.7 Total capital expenditures 173.9$ 193.5$ 220.8$ 166.0$ Less: Proceeds from disposals of rental equipment (54.6) (65.5) (86.8) (121.1) Less: Proceeds from disposals of property & equipment (0.2) - (0.1) (1.2) Net capital expenditures 119.1$ 128.0$ 133.9$ 43.7$ Pro Forma Combined Net Capital Expenditures 140.0$ 153.9$ 215.2$ 73.2$
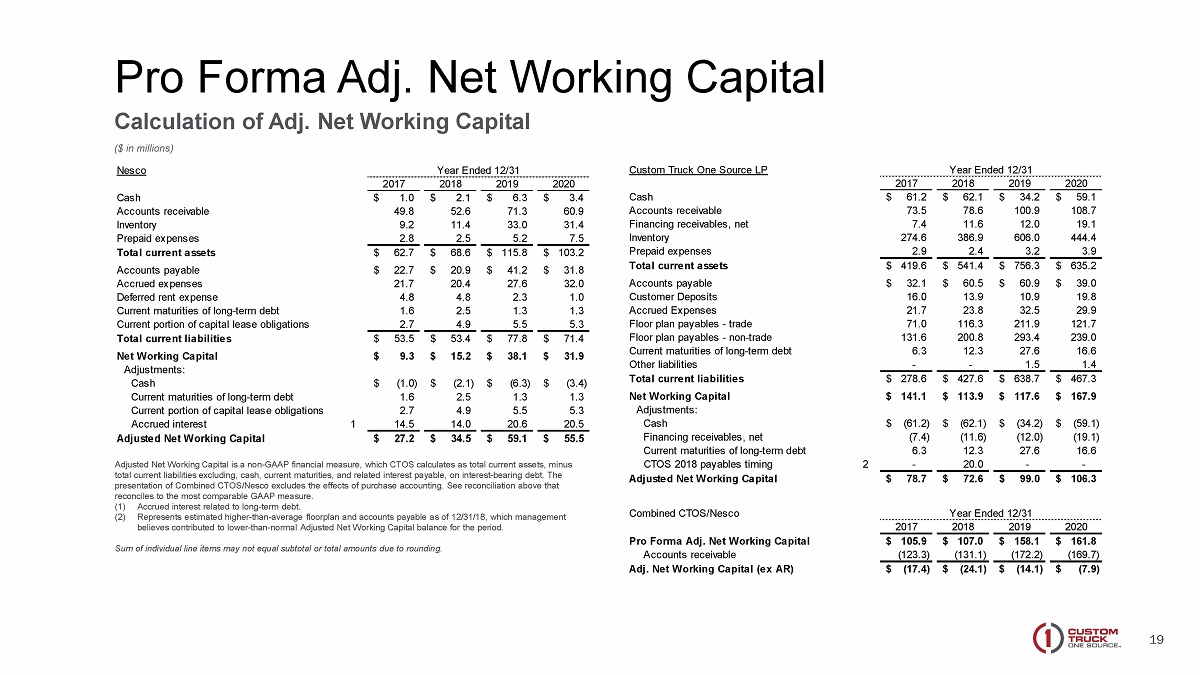
19 Pro Forma Adj. Net Working Capital Calculation of Adj. Net Working Capital ($ in millions) Nesco Year Ended 12/31 2017 2018 2019 2020 Cash 1.0$ 2.1$ 6.3$ 3.4$ Accounts receivable 49.8 52.6 71.3 60.9 Inventory 9.2 11.4 33.0 31.4 Prepaid expenses 2.8 2.5 5.2 7.5 Total current assets 62.7$ 68.6$ 115.8$ 103.2$ Accounts payable 22.7$ 20.9$ 41.2$ 31.8$ Accrued expenses 21.7 20.4 27.6 32.0 Deferred rent expense 4.8 4.8 2.3 1.0 Current maturities of long-term debt 1.6 2.5 1.3 1.3 Current portion of capital lease obligations 2.7 4.9 5.5 5.3 Total current liabilities 53.5$ 53.4$ 77.8$ 71.4$ Net Working Capital 9.3$ 15.2$ 38.1$ 31.9$ Adjustments: Cash (1.0)$ (2.1)$ (6.3)$ (3.4)$ Current maturities of long-term debt 1.6 2.5 1.3 1.3 Current portion of capital lease obligations 2.7 4.9 5.5 5.3 Accrued interest 1 14.5 14.0 20.6 20.5 Adjusted Net Working Capital 27.2$ 34.5$ 59.1$ 55.5$ Custom Truck One Source LP Year Ended 12/31 2017 2018 2019 2020 Cash 61.2$ 62.1$ 34.2$ 59.1$ Accounts receivable 73.5 78.6 100.9 108.7 Financing receivables, net 7.4 11.6 12.0 19.1 Inventory 274.6 386.9 606.0 444.4 Prepaid expenses 2.9 2.4 3.2 3.9 Total current assets 419.6$ 541.4$ 756.3$ 635.2$ Accounts payable 32.1$ 60.5$ 60.9$ 39.0$ Customer Deposits 16.0 13.9 10.9 19.8 Accrued Expenses 21.7 23.8 32.5 29.9 Floor plan payables - trade 71.0 116.3 211.9 121.7 Floor plan payables - non-trade 131.6 200.8 293.4 239.0 Current maturities of long-term debt 6.3 12.3 27.6 16.6 Other liabilities - - 1.5 1.4 Total current liabilities 278.6$ 427.6$ 638.7$ 467.3$ Net Working Capital 141.1$ 113.9$ 117.6$ 167.9$ Adjustments: Cash (61.2)$ (62.1)$ (34.2)$ (59.1)$ Financing receivables, net (7.4) (11.6) (12.0) (19.1) Current maturities of long-term debt 6.3 12.3 27.6 16.6 CTOS 2018 payables timing 2 - 20.0 - - Adjusted Net Working Capital 78.7$ 72.6$ 99.0$ 106.3$ Combined CTOS/Nesco Year Ended 12/31 2017 2018 2019 2020 Pro Forma Adj. Net Working Capital 105.9$ 107.0$ 158.1$ 161.8$ Accounts receivable (123.3) (131.1) (172.2) (169.7) Adj. Net Working Capital (ex AR) (17.4)$ (24.1)$ (14.1)$ (7.9)$ Adjusted Net Working Capital is a non - GAAP financial measure, which CTOS calculates as total current assets, minus total current liabilities excluding, cash, current maturities, and related interest payable, on interest - bearing debt. The presentation of Combined CTOS/ Nesco excludes the effects of purchase accounting. See reconciliation above that reconciles to the most comparable GAAP measure. (1) Accrued interest related to long - term debt. (2) Represents estimated higher - than - average floorplan and accounts payable as of 12/31/18, which management believes contributed to lower - than - normal Adjusted Net Working Capital balance for the period. Sum of individual line items may not equal subtotal or total amounts due to rounding.