Attached files
| file | filename |
|---|---|
| 8-K - 8-K - Arcosa, Inc. | aca-20210504.htm |
Investor Presentation May 2021 Exhibit 99.1

/ Moving Infrastructure Forward2 Forward-Looking Statements Some statements in this presentation, which are not historical facts, are “forward-looking statements” as defined by the Private Securities Litigation Reform Act of 1995. Forward-looking statements include statements about Arcosa’s estimates, expectations, beliefs, intentions or strategies for the future. Arcosa uses the words “anticipates,” “assumes,” “believes,” “estimates,” “expects,” “intends,” “forecasts,” “may,” “will,” “should,” “guidance,” “outlook,” “strategy,” and similar expressions to identify these forward-looking statements. Forward-looking statements speak only as of the date of this release, and Arcosa expressly disclaims any obligation or undertaking to disseminate any updates or revisions to any forward-looking statement contained herein, except as required by federal securities laws. Forward-looking statements are based on management’s current views and assumptions and involve risks and uncertainties that could cause actual results to differ materially from historical experience or our present expectations, including but not limited to assumptions, risks and uncertainties regarding the impact of the COVID-19 pandemic on Arcosa’s customer demand for Arcosa’s products and services, Arcosa’s supply chain, Arcosa’s employees ability to work because of COVID-19 related illness, the health and safety of our employees, the effect of governmental regulations imposed in response to the COVID-19 pandemic; assumptions, risks and uncertainties regarding achievement of the expected benefits of Arcosa’s spin-off from Trinity; tax treatment of the spin-off; failure to successfully integrate acquisitions, or failure to achieve the expected benefit of acquisitions; market conditions and customer demand for Arcosa’s business products and services; the cyclical nature of, and seasonal or weather impact on, the industries in which Arcosa competes; competition and other competitive factors; governmental and regulatory factors; changing technologies; availability of growth opportunities; market recovery; ability to improve margins; and Arcosa’s ability to execute its long-term strategy, and such forward-looking statements are not guarantees of future performance. For further discussion of such risks and uncertainties, see "Risk Factors" and the "Forward-Looking Statements" section of "Management's Discussion and Analysis of Financial Condition and Results of Operations" in Arcosa's Form 10-K for the year-ended December 31, 2020, and as may be revised and updated by Arcosa's Quarterly Reports on Form 10-Q and Current Reports on Form 8-K. Non-GAAP Financial Measures This presentation contains financial measures that have not been prepared in accordance with U.S. generally accepted accounting principles (“GAAP”). Reconciliations of non-GAAP financial measures to the closest GAAP measure are provided in the Appendix.

/ How to Find Us 3 INVESTOR CONTACT InvestorResources@arcosa.com NYSE TICKER ACA OUR WEBSITE www.arcosa.com HEADQUARTERS Arcosa, Inc. 500 North Akard Street, Suite 400 Dallas, Tx 75201 Moving Infrastructure Forward

/4 1 3 4 Company Overview Long-Term Vision and Capital Allocation ESG Update Moving Infrastructure Forward 2 Financial Highlights Table of Contents
/5 1 Company Overview Moving Infrastructure Forward

/6 Arcosa’s Value Proposition Strong balance sheet and ample liquidity to navigate cycles and pursue strategic growth Experienced management team with history of managing through economic cycles Leading businesses serving critical infrastructure markets Track record of executing on strategic priorities in first 2.5 years as an independent public company Disciplined capital allocation process to grow in attractive markets and improve returns on capital Moving Infrastructure Forward

/7 Arcosa at a Glance Revenues, Adjusted EBITDA and Net Income are for the twelve months ended 3/31/2021. See Adjusted EBITDA reconciliation in Appendix. Arcosa spun off from its former parent company in November 2018. $91M Net Income $265M Adjusted EBITDA $1.9B Revenues 3 Infrastructure-related Segments ~6,410 Employees 85+ Years of Operating History Moving Infrastructure Forward

/ Business Overview 8 Revenues ENGINEERED STRUCTURES TRANSPORTATION CONSTRUCTION Segments Adj.Segment EBITDA & Margin Arcosa’s three segments are made up of leading businesses that serve critical infrastructure markets NATURAL & RECYCLED AGGREGATES SPECIALTY MATERIALS CONSTRUCTION SITE SUPPORT WIND TOWERS UTILITY STRUCTURES STORAGE TANKS BARGES COMPONENTS Moving Infrastructure Forward $597M 23% $862M 13% $430M 16% $139M $109M $68M Revenues, Adjusted EBITDA and Net Income are for the twelve months ended 3/31/2021. See Adjusted EBITDA reconciliation in Appendix.

/9 Track Record of Executing on Stage 1 Priorities in First 2.5 Years Building our new Arcosa culture Executing on Stage 1 Priorities introduced at October 2018 Investor Day Grow Construction Products Improve Engineered Structures margins Expand Transportation Products Operate a flat corporate structure We have achieved double-digit growth in revenues and Adjusted EBITDA since spin and made progress on building our new Arcosa culture Entrepreneurial and growth- minded Focused on integrating ESG initiatives into our long-term strategy Performance accountability: “We say, we do” “We win together” See Adjusted Segment EBITDA reconciliation in Appendix. Moving Infrastructure Forward Completed 4 large acquisitions (ACG, Cherry, Strata & StonePoint) and 4 bolt-on acquisitions to expand regional footprint totaling ~$1.1B More than doubled trailing twelve months Adjusted Segment EBITDA since spin pro forma for a full year of acquisition contributions, while maintaining strong margins Grew Adjusted Segment EBITDA margins from 10% in 2018 to 13% in 2020 Invested $60M in 2020 to acquire 3 adjacent infrastructure-related products at attractive valuations Generated $159M of Free Cash Flow from 2018 to 2020 that funded growth in other segments Ramped up barge facilities to grow revenue ~75% in 2019 Rightsized capacity and implemented cost initiatives amid industry headwinds Streamlined corporate structure to reduce layers

/ StonePoint Materials Highlights Moving Infrastructure Forward 10 We completed the acquisition on April 9 and are now focused on integration and continuing to grow our expanded aggregates platform ~$125M Projected 2021 Revenues ~$30M Projected 2021 Adj. EBITDA 9M+ Tons Produced Annually 40+ Years of Reserves Strategic Rationale Premier, scaled aggregates platform that continues Arcosa’s evolution to a higher margin, higher growth, and less cyclical portfolio; 80% of EBITDA generated from aggregates Attractive geographic operations that expand current aggregates footprint in Texas and Louisiana while providing entry into new regions Provides new pipeline of organic growth projects and bolt-on acquisitions with attractive returns Expected to be accretive to earnings and margins in 2021, adjusting for non-recurring acquisition and integration costs $375M Purchase Price 20 Operating Locations OperationsStonePoint Key Figures 3 quarries in Tennessee/Kentucky region 1 underground mine in Pennsylvania Limestone Sand & Gravel 10 sand & gravel mines in Texas and Louisiana Asphalt & Other 4 asphalt plants in TN / KY 2 marine terminals in TN / KY located adjacent to quarries

/ Attractive and Complementary Geographic Presence Moving Infrastructure Forward 11 Acquisition expands Arcosa’s Construction Materials operations in the Gulf Coast as well as into attractive new markets Gulf Coast Louisiana: New Orleans, Baton Rouge, Lafayette, and Lake Charles Texas: Houston Mississippi: Hattiesburg Platform complementary to Arcosa’s footprint in Texas and Louisiana, and provides attractive growth prospects driven by demographics and strong fiscal state health Supplemented by LNG and petrochemical demand in region Tennessee / Kentucky Pennsylvania / West Virginia Tennessee: Clarksville (50 miles from Nashville) Kentucky: Paducah Nashville growth enhances middle Tennessee prospects Valuable foothold for expansion into Nashville, other major Tennessee / Kentucky MSAs Pennsylvania: Southwest West Virginia: Morgantown Recovery in DOT work in Pennsylvania and West Virginia, leveraging recent capacity additions Modest recovery expected in Marcellus drilling activity Public Infrastructure Current Arcosa Construction Materials Locations StonePoint Markets Residential Construction Commercial Construction Industrial Construction Energy Infrastructure StonePoint Serves Diversified End Markets Geography Value Proposition

/12 Construction Materials Platform Represents ~50% of Adjusted EBITDA StonePoint enhances the scale of our constructions materials platform and accelerates the shift to a higher margin, more stable portfolio Moving Infrastructure Forward 1LTM 3/31 Pro-Forma Adjusted EBITDA incorporates 12 months of StonePoint and Strata Materials as previously disclosed; 2 % of Total EBITDA excludes Corporate Costs. 2018 109 (31%) 64 (29%) 82 (38%) 73 (33%) LTM 3/31 Pro-Forma 68 (19%) 172 (50%) Transportation Engineered Structures Construction 219 348 Adjusted EBITDA, excluding Corporate Costs2 $ Millions We have continued to build out a world-class construction materials platform… Key Construction Materials Acquisitions December 2018 January 2020 October 2020 Solid Organic Growth April 2021 …and the StonePoint acquisition further accelerates the shift to a higher margin, more stable portfolio Half of Arcosa EBITDA from more stable Construction Products segment Geographic exposure has broadened within Texas and also extended into new states, providing solid fundamentals for organic growth Overall Arcosa margin has improved from 12.8% in 2018 to ~15% in LTM 3/31, pro-forma for StonePoint and Strata Key highlights of repositioning 1
/13 2 Financial Highlights Moving Infrastructure Forward

/14 1,704 1,462 1,460 1,737 1,936 2018 20192016 2017 2020 +33% Recent Financial Results Full Year 2020 Adjusted EBITDA increased 52% since spin outpacing revenue growth and driven by organic expansion, acquisitions, and operating improvements 267 197 187 241 284 2016 20192017 20202018 +52% See Adjusted EBITDA reconciliation in Appendix. Revenues ($M’s) Adjusted EBITDA ($M’s) Moving Infrastructure Forward Margin 16% 14% 13% 14% 15%

/ Cash Flow and Balance Sheet Strength Arcosa’s businesses have an attractive free cash flow profile, contributing to a strong balance sheet 15 Note: Free Cash Flow defined as GAAP Operating Cash Flow less GAAP capital expenditures. See reconciliation in Appendix Moving Infrastructure Forward Long-term target of 2.0-2.5x Outstanding Debt • $148M floating rate borrowing at LIBOR+1.50% • $100M fixed rate revolver borrowing at ~4.25% • $400M senior notes at 4.375%, due 2029 Net Debt / Adjusted EBITDA Ratio at end of quarter Free Cash Flow $M’s 74 273 178 138 2018 LTM 3/312019 2020 Avg. $166M (1.2) 0.5 (0.6) 0.5 0.4 0.2 0.5 0.6 1.9 1Q20Pro Forma at Spin 4Q204Q18 4Q19 3Q202Q20 1Q21 Q1-21, Pro Forma for StonePoint and Senior Notes Track record of de- leveraging post acquisition ... has supported significant organic & acquisition investment since spin, while maintaining a healthy balance sheet Focus on driving a disciplined ‘cash culture’….

/ COVID-19 Update We prioritize the health and safety of our people The health and safety of our employees, communities, and other stakeholders is our highest priority. We have put safeguard measures in place at our plants and office locations to meet or exceed the standards set forth by CDC guidelines. Protocols include: Social distancing processes in all facilities; measures to temperature screen employees daily; increased frequency of deep cleaning workspaces and common areas; reinforced hand washing and infection control training; processes to track and manage employees who report or have COVID-19 symptoms or exposure; actions to screen, limit or prohibit visitors to all facilities; and elimination of non- essential travel. Additionally, plant management and safety teams were able to quickly mobilize an operational response to COVID-19, implementing important tools created by collaborative leadership teams. From updates of CDC guidelines to best practice COVID-19 mitigation procedures, our teams have shown resilience and operational flexibility during times of uncertainty and change. We support critical infrastructure sectors Our businesses support critical infrastructure sectors, as defined by the Department of Homeland Security’s Cybersecurity and Infrastructure Security Agency (CISA.gov). These critical sectors are deemed essential to infrastructure, and our plants have continued operating to meet our customers’ needs. Moving Infrastructure Forward16 We build strong communities From supporting local restaurants, vendors, and small businesses, to donating funds for relevant non-profits, Arcosa has taken steps to enhance relationships and support our local communities. We have also shared our health and safety protocols with small businesses to improve practices in our communities.

/ Q1-2021 Financial Results Moving Infrastructure Forward17 488.2 440.4 Q1-20 Q1-21 -10% 75.6 56.5 Q1-21Q1-20 -25% See Adjusted Net Income and Adjusted EBITDA reconciliations in Appendix. Revenues and Adjusted EBITDA were ahead of our expectations; strength in Construction Products was offset by year-over-year weakness in Transportation Products 31.6 15.9 Q1-21 1.7 Q1-20 34.4 17.6 2.8 -49% Margin 15.5% 12.8% Revenues ($M) Adjusted EBITDA ($M) Net Income ($M) Adjusted Winter Storm Uri had a $4-5M negative impact on Adjusted EBITDA in Q1-2021

/18 Near-Term Outlook Construction Products and Engineered Structures end markets have remained healthy throughout the pandemic, while the barge market has been most impacted Moving Infrastructure Forward 50% 31% 19% Construction Products Positive Outlook Robust construction activity in our key markets, particularly Texas Favorable nationwide trends in infrastructure spending, with potential upside from increased federal funding above current FAST Act levels Deurbanization trends are driving increased demand for aggregates-intensive single family housing Engineered Structures Positive Outlook Recent healthy orders for wind towers and utility structures, driven by renewable power generation and grid hardening Wireless 5G telecom buildout expected to drive new demand Healthy DOT spending in Florida and other Southeast states, with opportunities to grow in Texas and other markets Steady demand and rising backlogs for storage tanks in both the U.S. and Mexico Transportation Products Weak Near-Term Outlook, primarily from COVID-related downturn Dry and liquid replacement orders remain depressed by high steel prices 2021 expected to be trough year in new railcar builds, and we have made early progress in diversifying customer and product base Near-Term Outlook by Segment % of TTM Adjusted EBITDA, Pro-Forma (excluding corporate costs)1 1LTM 3/31 Pro-Forma Adjusted EBITDA incorporates 12 months of StonePoint and Strata Materials as previously disclosed.

/ 2021 Outlook After closing the StonePoint Materials acquisition in April, we are updating our Revenue and Adjusted EBITDA guidance Moving Infrastructure Forward19 See Adjusted EBITDA reconciliation in Appendix. Revenues $M’s Adjusted EBITDA $M’s 1,460 1,737 1,936 Updated 2021 Guidance 2018 1,880 – 2,000 2019 2020 1,780 – 1,900 Original 2021 Guidance 187 241 284 Original 2021 Guidance 2018 Updated 2021 Guidance 2019 2020 250-270 270-290

/20 3 Long-Term Vision and Capital Allocation Moving Infrastructure Forward

/21 Our Long-Term Vision Grow in attractive markets where we can achieve sustainable competitive advantages Reduce the complexity and cyclicality of the overall business Improve long-term returns on invested capital Integrate Environmental, Social, and Governance initiatives (ESG) into our long-term strategy Moving Infrastructure Forward

/22 Repositioning Arcosa Around More Stable Infrastructure Products Construction Products 2018 LTM March 2021 Our performance highlights our progress in creating a more stable base of revenue and profit, anchored around core infrastructure products Moving Infrastructure Forward Natural aggregates operations, primarily in North Texas Lightweight aggregates Shoring products Natural aggregates operations in 10 states, including the acquisition of StonePoint Recycled aggregates Lightweight aggregates Specialty materials for building products, agriculture, and other markets Shoring products 73 Engineered Structures Heavy reliance on Wind Towers product line Underperforming businesses in Utility Structures and Storage Tanks Significantly improved operations in Utility Structures and Storage Tanks, with segment EBITDA margins from 10% in 2018 to 13% in 2020 Reduced reliance on Wind Towers product line Added 3 adjacent infrastructure-related product lines of Traffic, Telecom, and Concrete structures Opportunities for additional organic growth in Transmission and Distribution structures Adjusted Segment EBITDA1 ($M’s) 109 Our Transportation segment generated $159M of cash flow from 2018- 2020 that funded growth in Construction and Engineered Structures2 Adjusted Segment EBITDA ($M’s) 1 Construction Products Adjusted Segment EBITDA pro-forma for StonePoint and Strata Materials as previously disclosed. 2 Cash flow defined as EBITDA less CapEx. See 2020 10-K for CapEx by Segment 82 172

/ Attractive markets with long-term pricing and volume growth; less cyclical than other Arcosa businesses Sustainable competitive advantages, through reserve positions, product portfolio, proprietary processing capabilities, and deep market knowledge Fragmented industry structure with ability to buy small to medium size assets at attractive multiples Ability to use acquisitions as growth platforms for organic and bolt-on growth 23 We have deployed more than $1.1B on Construction Products acquisitions since the time of the spin, due to favorable long-term fundamentals and acquisition opportunities Attractive fundamentals of Aggregates and Specialty Materials Moving Infrastructure Forward Construction Products We continue to evaluate organic investments as well, including strategic reserve additions in existing and new geographies, new specialty product development, and processing capacity expansions October 2020 January 2020 December 2018 • Top 25 U.S. aggregates platform adding attractive new geographies, more than 40 years of reserve life, and an experienced management team • Two acquisitions building leadership position in recycled aggregates, a new product category for Arcosa and growing in importance due to resource scarcity and ESG benefits • Cherry expands aggregates business into attractive Houston market, a key gap in our current Texas network • Strata expands ability to serve DFW customers with a complementary product offering that includes both natural and recycled aggregates • Adds complementary, scaled specialty materials and aggregates platforms • Diversifies customer base across attractive end markets April 2021

/24 Traffic structures March 2020 acquisition of HSI, a leading traffic structures manufacturer October 2020 acquisition of Premier Fabricators 2 plants in Florida; serve Southeast and opportunity to expand into other states DESCRIPTION Telecom structures Transmission and Distribution structures CAPITAL DEPLOYED IN 2020 $33M July 2020 acquisition of Eastpointe Industries, a telecommunications tower manufacturer 1 plant in Oklahoma; ships nationwide $28M June 2020 acquisition of concrete pole manufacturing plant 1 plant in Alabama; serves Southeast Incremental capacity in transmission and distribution structures $5M Engineered Structures In 2020, we invested in 3 acquisitions plus organic growth to build on our strong position in transmission and distribution structures $10M These acquisitions have combined annualized Revenues of ~$50M and Adjusted EBITDA of ~$9M, prior to growth and cost synergies with current businesses1 Moving Infrastructure Forward 1 Prior to acquisitions, combined businesses earned Adjusted EBITDA of $9M: Net income ($6.0M) + D&A ($1.7M) + Interest expense ($1M) + Adjustments ($0.3M). D&A will be different after purchase price accounting

/25 Moving Infrastructure Forward Engineered Structures With our acquisitions, we have expanded our product offering in the $3B transmission and distribution markets, as well as entered new large markets tied to infrastructure growth Transmission & Distribution Structures Wind Towers Traffic Structures Telecom Structures Key Synergies Manufacturing expertise North American manufacturing footprint Steel sourcing ELECTRICITY TRANSMISSION & DISTRIBUTION ROAD INFRASTRUCTURE RENEWABLE POWER GENERATION COMMUNICATIONS INFRASTRUCTURE (INCLUDING 4G AND 5G BUILDOUT) END MARKETS AND PRODUCT LINES $500M+ $1.2B+ $3B+ $1.2B Source: Company and Third Party Estimates

/26 4 ESG Update Moving Infrastructure Forward

/ Arcosa Sustainability Moving Infrastructure Forward27 We continue to integrate ESG into our business through our strategic planning process, ESG-focused initiatives, and innovative continuous improvement projects Our 2020 Sustainability Report published on April 19, 2021 highlights a number of the ways Arcosa prioritizes ESG across the company: Safety: Arcosa team members achieved a 56% reduction in our Total Recordable Incident Rate (TRIR) in 2020. Our ARC 100 safety initiative continues to strengthen our safety culture, and we are committed to an evolving system in which all employees contribute to continuous safety improvements. TCFD: We have aligned our climate-related disclosures with the recommendations of the Financial Stability Board’s Task Force on Climate-related Financial Disclosures (TCFD). SASB: We include new disclosures for several key Sustainability Accounting Standards Board (SASB) metrics, including safety, greenhouse gas (GHG) emissions, and water consumption. GHG Emissions: In 2020, we reduced our GHG Emissions Intensity by 12%, including Scope 1 and Scope 2 emissions (Metric Tonnes C02 Equivalent/$ Million Revenues). Water: In 2020, we reduced our municipal water intensity by 16% (kilogallons/$ Million Revenues). Community Impact: We include stories highlighting a sample of the exceptional ways our businesses supported their local communities during 2020. Compensation: We introduced an ESG component to our short-term incentive awards for 2020, where progress on ESG is incorporated into our Named Executive Officer and other key employees’ compensation.
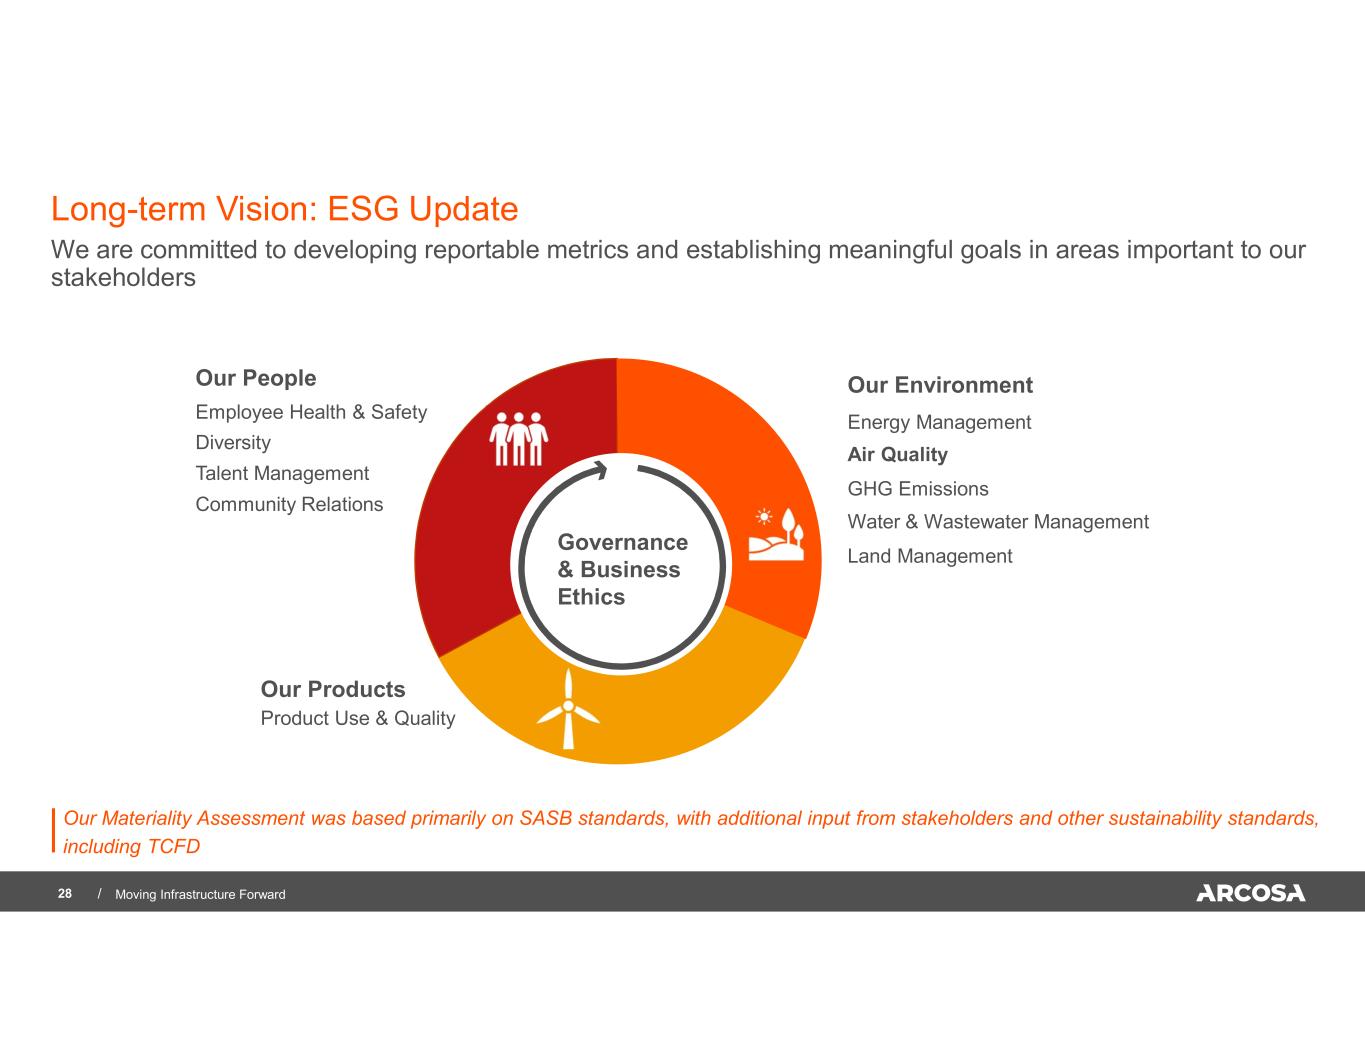
/28 We are committed to developing reportable metrics and establishing meaningful goals in areas important to our stakeholders Our Materiality Assessment was based primarily on SASB standards, with additional input from stakeholders and other sustainability standards, including TCFD Employee Health & Safety Diversity Talent Management Energy Management Air Quality GHG Emissions Product Use & Quality Water & Wastewater Management Land Management Community Relations Our Environment Our Products Our People Governance & Business Ethics Long-term Vision: ESG Update Moving Infrastructure Forward

/ Long-term Vision: ESG Update Moving Infrastructure Forward29 As we integrate ESG initiatives into our long-term strategy, our operations teams have taken an active role in pursuing initiatives that promote environmental responsibility We provide more detail regarding our goals and initiatives in our August 2020 Midyear ESG Update located on our website, www.arcosa.com/sustainability, and expect further updates in our Full Year Sustainability Report in 2021 Arcosa’s Meyer Utility Structures’ Texas plant transitioned to high- efficiency weld machines throughout the facility to reduce energy consumption (scope 2 emissions). Arcosa Marine is sponsoring a community-partnered tree planting project in an effort to mitigate flooding along the coast of Louisiana's Pontchartrain Basin Arcosa’s Construction Products group is transitioning to higher efficiency engines that will reduce fuel consumption (scope 1 emissions), improve production volumes, and decrease priority pollutants.
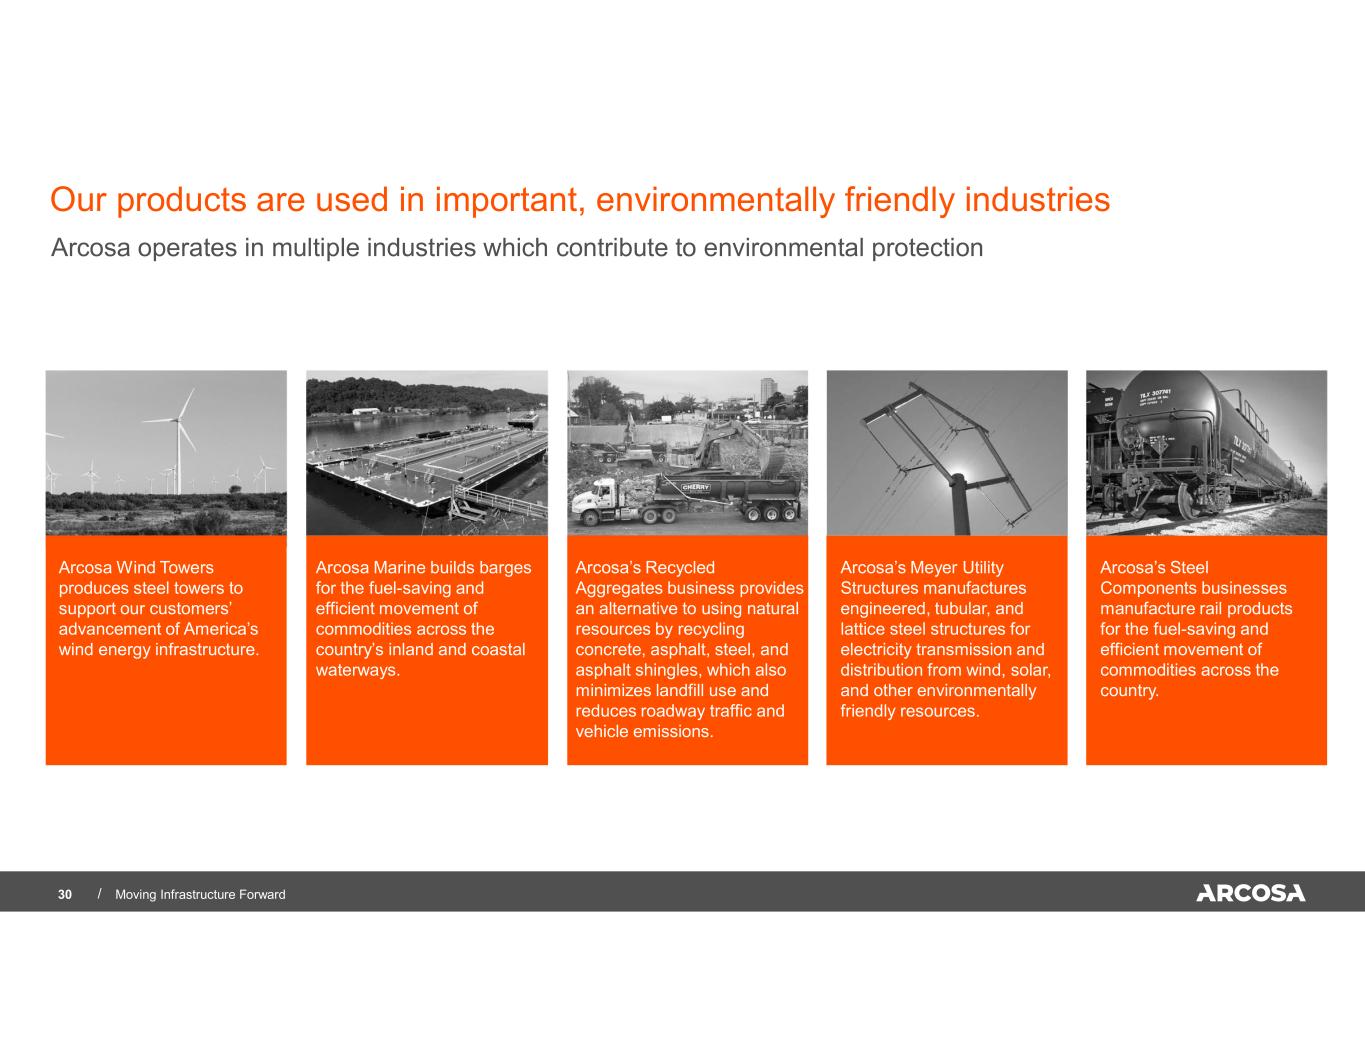
/30 Our products are used in important, environmentally friendly industries Arcosa operates in multiple industries which contribute to environmental protection Arcosa Wind Towers produces steel towers to support our customers’ advancement of America’s wind energy infrastructure. Arcosa Marine builds barges for the fuel-saving and efficient movement of commodities across the country’s inland and coastal waterways. Arcosa’s Recycled Aggregates business provides an alternative to using natural resources by recycling concrete, asphalt, steel, and asphalt shingles, which also minimizes landfill use and reduces roadway traffic and vehicle emissions. Arcosa’s Meyer Utility Structures manufactures engineered, tubular, and lattice steel structures for electricity transmission and distribution from wind, solar, and other environmentally friendly resources. Arcosa’s Steel Components businesses manufacture rail products for the fuel-saving and efficient movement of commodities across the country. Moving Infrastructure Forward

Appendix

/32 Additional Financial Guidance for 2021 Corporate costs Commentary Moving Infrastructure Forward Capital expenditures Working capital ~$13-14M per quarter, excluding non-recurring items related to acquisitions and integration We expect ~$6M of acquisition and integration-related costs in Q2 due to the April StonePoint closing, followed by $2M per quarter in Q3 and Q4 Given StonePoint acquisition, we are increasing CapEx guidance by $10M to $110-120M in 2021 (~$90M of maintenance capex + $20-$30M of growth projects) Tax rate Roughly flat working capital for the year We expect a full year 2021 tax rate of 23-24% Transportation Products guidance We are maintaining our expectation for $35-40M of segment Adjusted EBITDA for 2021, but performance will likely be near the low end of the range if steel prices do not moderate in the near term
/ Non-GAAP Measures 33 Moving Infrastructure Forward “EBITDA” is defined as net income plus interest, taxes, depreciation, depletion, and amortization. We adjust EBITDA for certain items that are not reflective of the normal earnings of our business (“Adjusted EBITDA”). GAAP does not define EBITDA or Adjusted EBITDA and they should not be considered as alternatives to earnings measures defined by GAAP, including net income. We use Adjusted EBITDA to assess the operating performance of our consolidated business, as a metric for incentive-based compensation, as a measure within our lending arrangements, and as a basis for strategic planning and forecasting as we believe that it closely correlates to long-term shareholder value. As a widely used metric by analysts, investors, and competitors in our industry, we believe Adjusted EBITDA also assists investors in comparing a company's performance on a consistent basis without regard to depreciation, depletion, amortization, and other items which can vary significantly depending on many factors. “Adjusted EBITDA Margin” is defined as Adjusted EBITDA divided by Revenues. GAAP does not define “Adjusted Net Income” and it should not be considered as an alternative to earnings measures defined by GAAP, including net income. We use this metric to assess the operating performance of our consolidated business. We adjust net income for certain items that are not reflective of the normal operations of our business to provide investors with what we believe is a more consistent comparison of earnings performance from period to period. “Segment EBITDA” is defined as segment operating profit plus depreciation, depletion, and amortization. We adjust Segment EBITDA for certain items that are not reflective of the normal earnings of our business (“Adjusted Segment EBITDA”). GAAP does not define Segment EBITDA or Adjusted Segment EBITDA and they should not be considered as alternatives to earnings measures defined by GAAP, including segment operating profit. We use Adjusted Segment EBITDA to assess the operating performance of our businesses, as a metric for incentive-based compensation, and as a basis for strategic planning and forecasting as we believe that it closely correlates to long-term shareholder value. As a widely used metric by analysts, investors, and competitors in our industry we believe Adjusted Segment EBITDA also assists investors in comparing a company's performance on a consistent basis without regard to depreciation, depletion, amortization, and other items, which can vary significantly depending on many factors. "Adjusted Segment EBITDA Margin" is defined as Adjusted Segment EBITDA divided by Revenues. GAAP does not define “Free Cash Flow” and it should not be considered as an alternative to cash flow measures defined by GAAP, including cash flow from operating activities. We use this metric to assess the liquidity of our consolidated business. We present this metric for the convenience of investors who use such metrics in their analysis and for shareholders who need to understand the metrics we use to assess performance and monitor our cash and liquidity positions. We define Free Cash Flow as cash provided by operating activities less capital expenditures. GAAP does not define “Net Debt” and it should not be considered as an alternative to cash flow or liquidity measures defined by GAAP. The Company uses Net Debt, which it defines as total debt minus cash and cash equivalents to determine the extent to which the Company’s outstanding debt obligations would be satisfied by its cash and cash equivalents on hand. The Company also uses "Net Debt to Adjusted EBITDA", which it defines as Net Debt divided by Adjusted EBITDA for the trailing twelve months as a metric of its current leverage position. We present this metric for the convenience of investors who use such metrics in their analysis and for shareholders who need to understand the metrics we use to assess performance and monitor our cash and liquidity positions. Refer to slides that follow for accompanying reconciliations

/ Reconciliation of Adjusted EBITDA and Adjusted Net Income 34 Moving Infrastructure Forward (1) Includes the impact of the fair value markup of acquired long-lived assets, subject to final purchase price adjustments. (2) For the three months ended March 31, 2021 and 2020, expenses associated with acquisitions, including the cost impact of the fair value markup of acquired inventory, advisory and professional fees, integration, and other transaction costs. (3) For the full year 2021 guidance range, the costs impact of the fair value markup of StonePoint inventory is not yet included and is subject to completion of the purchase price adjustments. (4) Included in Other, net (income) expense was the impact of foreign currency exchange transactions of $0.6 million and $0.0 million for the three months ended March 31, 2021 and 2020, respectively and $4.2 million, $3.6 million, $1.5 million, $(0.2) million, $2.2 million, and $4.8 million for the twelve months ended March 31, 2021 and December 31, 2020, 2019, 2018, 2017, and 2016, respectively. ($’s in millions) (unaudited) Twelve Months Ended March 31, 2021 2020 2021 2020 2019 2018 2017 2016 Low High Net income $ 15.9 $ 31.6 $ 90.9 $ 106.6 $ 113.3 $ 75.7 $ 89.7 $ 123.0 $ 80.0 $ 96.0 Add: Interest expense, net 2.1 3.1 9.2 10.2 5.4 0.5 (0.1) (0.1) 20.0 20.0 Provision for income taxes 4.4 10.4 25.6 31.6 33.5 19.3 40.4 74.2 24.0 28.0 Depreciation, depletion, and amortization expense(1) 31.4 26.8 119.1 114.5 85.8 67.6 65.7 65.6 132.0 132.0 EBITDA 53.8 71.9 244.8 262.9 238.0 163.1 195.7 262.7 256.0 276.0 Add: Impact of acquisition-related expenses(2) (3) 2.2 2.4 10.1 10.3 2.0 0.8 - - 14.0 14.0 Impairment charge - 1.3 5.8 7.1 - 23.2 - - - - Other, net (income) expense(4) 0.5 - 3.9 3.4 0.7 (0.6) 1.7 3.7 - - Adjusted EBITDA $ 56.5 $ 75.6 $ 264.6 $ 283.7 $ 240.7 $ 186.5 $ 197.4 $ 266.4 $ 270.0 $ 290.0 Adjusted EBITDA Margin 12.8% 15.5% 14.0% 14.7% 13.9% 12.8% 13.5% 15.6% 14.4% 14.5% Years Ended December 31, Three Months Ended March 31, Full Year 2021 Guidance Twelve Months Ended March 31, 2021 2020 2021 Net Income $ 15.9 $ 31.6 $ 90.9 Impact of acquisition-related expenses, net of tax(2) 1.7 1.8 7.7 Impairment charge, net of tax - 1.0 4.4 Adjusted Net Income $ 17.6 $ 34.4 $ 103.0 Three Months Ended March 31,

/ Twelve Months Ended March 31, 2021 2020 2021 Construction Products Operating Profit $ 15.8 $ 16.8 $ 73.7 Add: Depreciation, depletion, and amortization expense 17.1 13.8 63.4 Segment EBITDA 32.9 30.6 137.1 Add: Impact of acquisition-related expenses(1) - 1.5 1.4 Add: Impairment charge - - 0.8 Adjusted Segment EBITDA $ 32.9 $ 32.1 $ 139.3 Adjusted Segment EBITDA Margin 21.5% 21.5% 23.3% Engineered Structures Operating Profit $ 17.5 $ 24.9 $ 72.8 Add: Depreciation and amortization expense 8.4 7.4 32.5 Segment EBITDA 25.9 32.3 105.3 Add: Impact of acquisition-related expenses(1) 0.5 - 3.3 Add: Impairment charge - 1.3 - Adjusted Segment EBITDA $ 26.4 $ 33.6 $ 108.6 Adjusted Segment EBITDA Margin 12.8% 15.1% 12.6% Transportation Products Operating Profit $ 4.1 $ 14.3 $ 44.4 Add: Depreciation and amortization expense 4.6 4.4 18.2 Segment EBITDA 8.7 18.7 62.6 Add: Impairment charge - - 5.0 Adjusted Segment EBITDA $ 8.7 $ 18.7 $ 67.6 Adjusted Segment EBITDA Margin 10.8% 16.0% 15.7% Operating Loss - Corporate (14.5) (10.9) (61.3) Impact of acquisition-related expenses - Corporate(1) 1.7 0.9 5.4 Add: Corporate depreciation expense 1.3 1.2 5.0 Adjusted EBITDA $ 56.5 $ 75.6 $ 264.6 Three Months Ended March 31, Reconciliation of Adjusted Segment EBITDA 35 Moving Infrastructure Forward ($’s in millions) (unaudited) (1) Expenses associated with acquisitions, including the cost impact of the fair value markup of acquired inventory, advisory and professional fees, integration, and other transaction costs. The guidance range for Transportation Products Segment Adjusted EBITDA is calculated based on an operating profit of between $17-22 million plus depreciation and amortization expense of approximately $18 million.

/ Reconciliation of Free Cash Flow and Net Debt to Adjusted EBITDA 36 Moving Infrastructure Forward ($’s in millions) (unaudited) (1) Net Debt adjusted to include $200.0 million of cash received from Trinity in connection with the spin-off on November 1, 2018 (2) Adjusted EBITDA includes 9 month pro forma adjustment of $27.8 million for Cherry during Q2-Q4 of 2019, using previously disclosed annualized EBITDA of $37M. (3) Adjusted EBITDA includes 6 month pro forma adjustment of $18.5 million for Cherry during Q3-Q4 of 2019, using previously disclosed annualized EBITDA of $37M. (4) Adjusted EBITDA includes 3 month pro forma adjustment of $9.3 million for Cherry during Q4 of 2019, using previously disclosed annualized EBITDA of $37M. (5) Adjusted EBITDA includes 9 month pro forma adjustment of $7.7 million for Strata during Q1-Q3 of 2020, using previously disclosed annualized EBITDA of $10.2M. (6) Adjusted EBITDA includes 6 month pro forma adjustment of $5.1 million for Strata during Q2-Q3 of 2020, using previously disclosed annualized EBITDA of $10.2M. (7) Net proceeds received from the $400 million, after deducting expenses, are estimated to be $394 million. Purchase price paid for StonePoint was $375 million, resulting in a net pro forma cash and cash equivalents adjustment of $19 million. Adjusted EBITDA for StonePoint is estimated as of trailing twelve months ended March 31, 2021 as previously disclosed. Twelve Months Ended March 31, 2020 2019 2018 2021 Cash Provided by Operating Activities $ 259.9 $ 358.8 $ 118.5 $ 218.8 Capital Expenditures (82.1) (85.4) (44.8) (80.9) Free Cash Flow $ 177.8 $ 273.4 $ 73.7 $ 137.9 Year Ended December 31, September 30, 2018 Pro-Forma(1) December 31, 2018 December 31, 2019 March 31, 2020 (2) June 30, 2020 (3) September 30, 2020 (4) December 31, 2020 (5) March 31, 2021 (6) Pro Forma for StonePoint and Senior Notes (7) March 31, 2021 Pro Forma Total debt 0.4$ 185.5$ 107.3$ 356.9$ 256.6$ 254.6$ 254.5$ 255.9$ 400.0$ 655.9$ Cash and cash equivalents 210.4 99.4 240.4 200.7 148.4 189.0 95.8 81.9 19.0 100.9 Net Debt (210.0)$ 86.1$ (133.1)$ 156.2$ 108.2$ 65.6$ 158.7$ 174.0$ 381.0$ 555.0$ Adjusted EBITDA (trailing twelve months) 178.1$ 186.5$ 240.7$ 285.6$ 290.8$ 289.7$ 291.4$ 269.7$ 27.6$ 297.3$ Net Debt to Adjusted EBITDA (1.2) 0.5 (0.6) 0.5 0.4 0.2 0.5 0.6 1.9 As of
