Attached files
| file | filename |
|---|---|
| 8-K - 8-K - National Bank Holdings Corp | nbhc-20210503x8k.htm |
Exhibit 99.1
| Q1 – 2021 INVESTOR PRESENTATION |
| FORWARD-LOOKING STATEMENTS 2 This presentation contains “forward-looking statements” within the meaning of the Private Securities Litigation Reform Act of 1995. Forward-looking statements contain words such as “anticipate,” “believe,” “can,” “would,” “should,” “could,” “may,” “predict,” “seek,” “potential,” “will,” “estimate,” “target,” “plan,” “project,” “continuing,” “ongoing,” “expect,” “intend” or similar expressions that relate to the Company’s strategy, plans or intentions. Forward-looking statements involve certain important risks, uncertainties and other factors, any of which could cause actual results to differ materially from those in such statements. Such factors include, without limitation, the “Risk Factors” referenced in our most recent Form 10-K filed with the Securities and Exchange Commission (SEC), other risks and uncertainties listed from time to time in our reports and documents filed with the SEC, and the following factors: ability to execute our business strategy; business and economic conditions; effects of any potential government shutdowns; economic, market, operational, liquidity, credit and interest rate risks associated with the Company’s business; effects of any changes in trade, monetary and fiscal policies and laws; changes imposed by regulatory agencies to increase capital standards; effects of inflation, as well as, interest rate, securities market and monetary supply fluctuations; changes in the economy or supply-demand imbalances affecting local real estate values; changes in consumer spending, borrowings and savings habits; with respect to our mortgage business, the inability to negotiate fees with investors for the purchase or our loans or our obligation to indemnify purchasers or repurchase related loans; the Company’s ability to identify potential candidates for, consummate, integrate and realize operating efficiencies from, acquisitions, consolidations and other expansion opportunities; the Company's ability to realize anticipated benefits from enhancements or updates to its core operating systems from time to time without significant change in client service or risk to the Company's control environment; the Company's dependence on information technology and telecommunications systems of third party service providers and the risk of systems failures, interruptions or breaches of security; the Company’s ability to achieve organic loan and deposit growth and the composition of such growth; changes in sources and uses of funds; increased competition in the financial services industry; the effect of changes in accounting policies and practices; the share price of the Company’s stock; the Company's ability to realize deferred tax assets or the need for a valuation allowance; continued consolidation in the financial services industry; ability to maintain or increase market share and control expenses; costs and effects of changes in laws and regulations and of other legal and regulatory developments; technological changes; the timely development and acceptance of new products and services; the Company’s continued ability to attract, hire and maintain qualified personnel; ability to implement and/or improve operational management and other internal risk controls and processes and reporting system and procedures; regulatory limitations on dividends from the Company's bank subsidiary; changes in estimates of future credit reserve requirements based upon the periodic review thereof under relevant regulatory and accounting requirements; widespread natural and other disasters, pandemics, dislocations, political instability, acts of war or terrorist activities, cyberattacks or international hostilities; adverse effects due to the novel Coronavirus Disease 2019 (COVID-19) on the Company and its clients, counterparties, employees, and third- party service providers, and the adverse impacts on our business, financial position, results of operations, and prospects; impact of reputational risk; and success at managing the risks involved in the foregoing items. The Company can give no assurance that any goal or plan or expectation set forth in forward-looking statements can be achieved and readers are cautioned not to place undue reliance on such statements. The forward-looking statements are made as of the date of this press release, and the Company does not intend, and assumes no obligation, to update any forward-looking statement to reflect events or circumstances after the date on which the statement is made or to reflect the occurrence of unanticipated events or circumstances, except as required by applicable law. Further Information: This presentation should be read together with “Management’s Discussion and Analysis of Financial Condition and Results of Operations” and the consolidated financial statements and the related notes thereto included in our Form 10-K and quarterly reports. |
| ABOUT NON-GAAP FINANCIAL MEASURES Certain of the financial measures and ratios we present, including “average tangible assets,” “return on average tangible assets,” “average tangible common equity,” “return on average tangible common equity,” “tangible common equity to tangible assets,” “adjusted net income,” “adjusted earnings per share – diluted,” “adjusted return on average tangible assets,” “adjusted return on average tangible common equity,” and “fully taxable equivalent” metrics, are supplemental measures that are not required by, nor presented in accordance with, U.S. generally accepted accounting principles (GAAP). We refer to these financial measures and ratios as “non-GAAP financial measures.” We consider the use of select non-GAAP financial measures and ratios to be useful for financial and operational decision making and useful in evaluating period-to-period comparisons. We believe that these non-GAAP financial measures provide meaningful supplemental information regarding our performance by excluding certain expenditures or assets that we believe are not indicative of our primary business operating results or by presenting certain metrics on a fully taxable equivalent basis. We believe that management and investors benefit from referring to these non-GAAP financial measures in assessing our performance and when planning, forecasting, analyzing and comparing past, present and future periods. These non-GAAP financial measures should not be considered a substitute for financial information presented in accordance with GAAP and you should not rely on non-GAAP financial measures alone as measures of our performance. The non-GAAP financial measures we present may differ from non- GAAP financial measures used by our peers or other companies. We compensate for these limitations by providing the equivalent GAAP measures whenever we present the non-GAAP financial measures and by including a reconciliation of the impact of the components adjusted for in the non-GAAP financial measure so that both measures and the individual components may be considered when analyzing our performance. A reconciliation of non-GAAP financial measures to the comparable GAAP financial measures is included in the appendix. 3 |
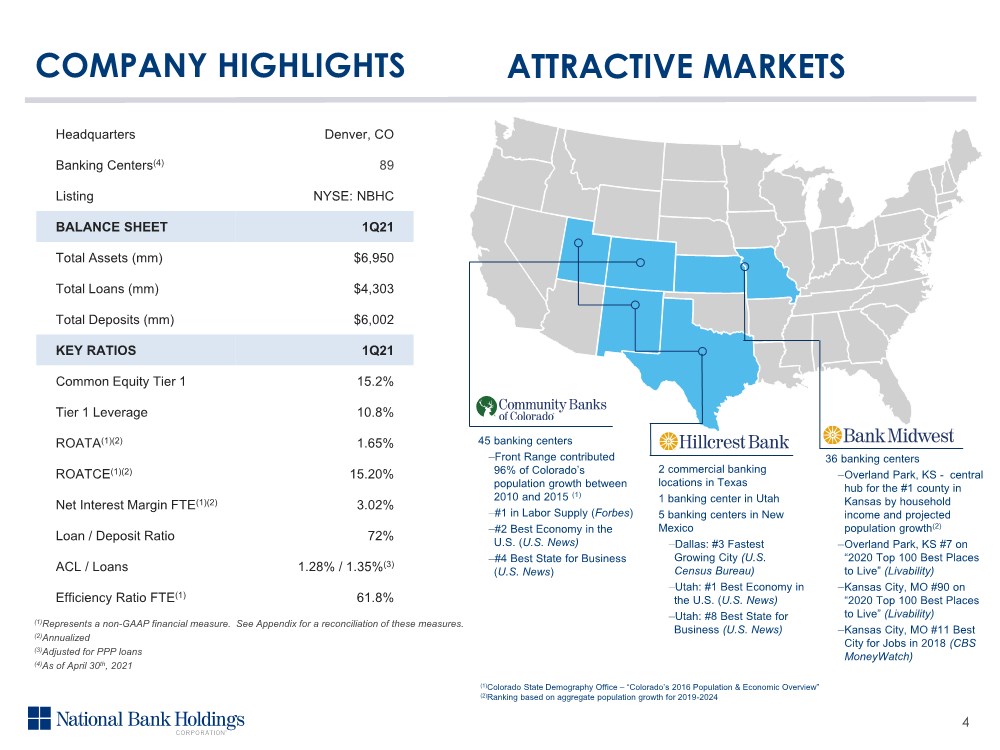
| 36 banking centers ‒Overland Park, KS - central hub for the #1 county in Kansas by household income and projected population growth(2) ‒Overland Park, KS #7 on “2020 Top 100 Best Places to Live” (Livability) ‒Kansas City, MO #90 on “2020 Top 100 Best Places to Live” (Livability) ‒Kansas City, MO #11 Best City for Jobs in 2018 (CBS MoneyWatch) COMPANY HIGHLIGHTS ATTRACTIVE MARKETS Headquarters Denver, CO Banking Centers(4) 89 Listing NYSE: NBHC BALANCE SHEET 1Q21 Total Assets (mm) $6,950 Total Loans (mm) $4,303 Total Deposits (mm) $6,002 KEY RATIOS 1Q21 Common Equity Tier 1 15.2% Tier 1 Leverage 10.8% ROATA(1)(2) 1.65% ROATCE(1)(2) 15.20% Net Interest Margin FTE(1)(2) 3.02% Loan / Deposit Ratio 72% ACL / Loans 1.28% / 1.35%(3) Efficiency Ratio FTE(1) 61.8% (1)Represents a non-GAAP financial measure. See Appendix for a reconciliation of these measures. (2)Annualized (3)Adjusted for PPP loans (4)As of April 30th, 2021 45 banking centers ‒Front Range contributed 96% of Colorado’s population growth between 2010 and 2015 (1) ‒#1 in Labor Supply (Forbes) ‒#2 Best Economy in the U.S. (U.S. News) ‒#4 Best State for Business (U.S. News) (1)Colorado State Demography Office –“Colorado’s 2016 Population & Economic Overview” (2)Ranking based on aggregate population growth for 2019-2024 2 commercial banking locations in Texas 1 banking center in Utah 5 banking centers in New Mexico ‒Dallas: #3 Fastest Growing City (U.S. Census Bureau) ‒Utah: #1 Best Economy in the U.S. (U.S. News) ‒Utah: #8 Best State for Business (U.S. News) 4 |
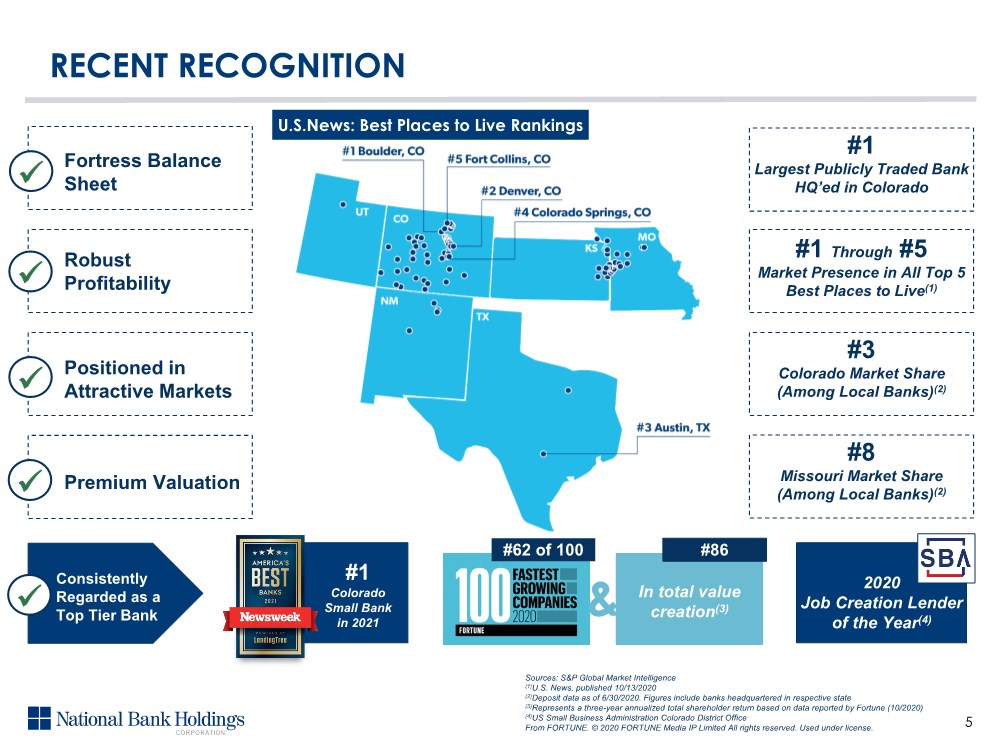
| RECENT RECOGNITION Fortress Balance Sheet Robust Profitability Positioned in Attractive Markets Premium Valuation #1 Largest Publicly Traded Bank HQ’ed in Colorado #1 Through #5 Market Presence in All Top 5 Best Places to Live(1) #3 Colorado Market Share (Among Local Banks)(2) #8 Missouri Market Share (Among Local Banks)(2) Consistently Regarded as a Top Tier Bank #1 Colorado Small Bank in 2021 Sources: S&P Global Market Intelligence (1)U.S. News, published 10/13/2020 (2)Deposit data as of 6/30/2020. Figures include banks headquartered in respective state (3)Represents a three-year annualized total shareholder return based on data reported by Fortune (10/2020) (4)US Small Business Administration Colorado District Office From FORTUNE. © 2020 FORTUNE Media IP Limited All rights reserved. Used under license. U.S.News: Best Places to Live Rankings 5 #62 of 100 In total value creation(3) 2020 Job Creation Lender of the Year(4) #86 & |
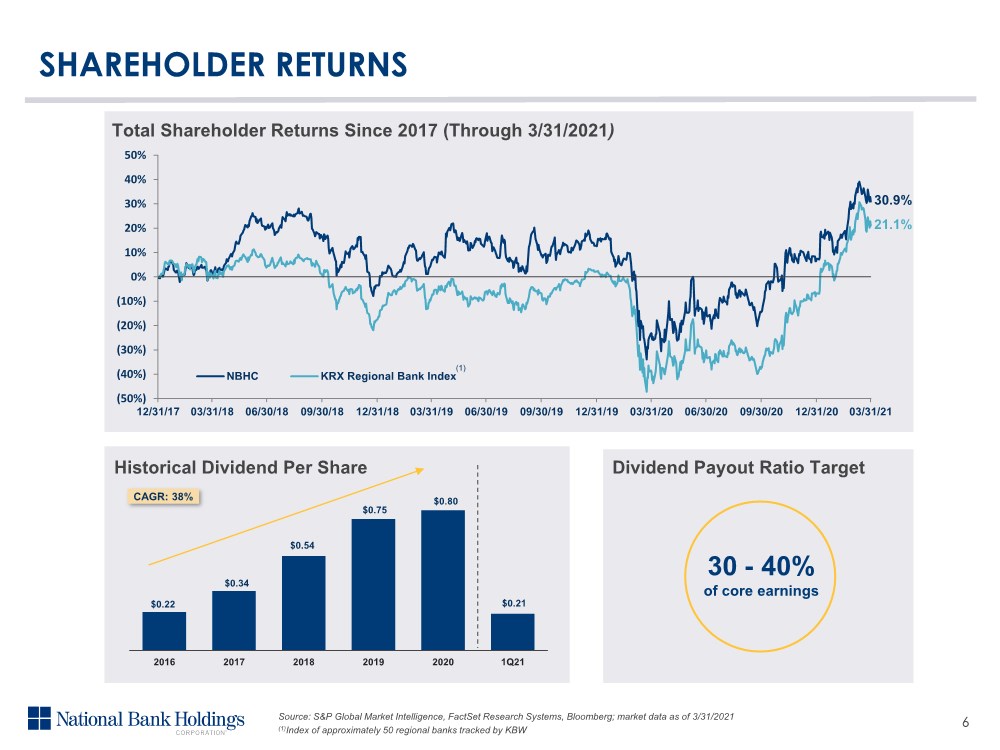
| $0.22 $0.34 $0.54 $0.75 $0.80 $0.21 2016 2017 2018 2019 2020 1Q21 (50%) (40%) (30%) (20%) (10%) 0% 10% 20% 30% 40% 50% 12/31/17 03/31/18 06/30/18 09/30/18 12/31/18 03/31/19 06/30/19 09/30/19 12/31/19 03/31/20 06/30/20 09/30/20 12/31/20 03/31/21 NBHC KRX Regional Bank Index SHAREHOLDER RETURNS Source: S&P Global Market Intelligence, FactSet Research Systems, Bloomberg; market data as of 3/31/2021 (1)Index of approximately 50 regional banks tracked by KBW 30.9% 21.1% Total Shareholder Returns Since 2017 (Through 3/31/2021) Historical Dividend Per Share (1) CAGR: 38% 30 - 40% of core earnings Dividend Payout Ratio Target 6 |
| FINANCIAL PERFORMANCE |

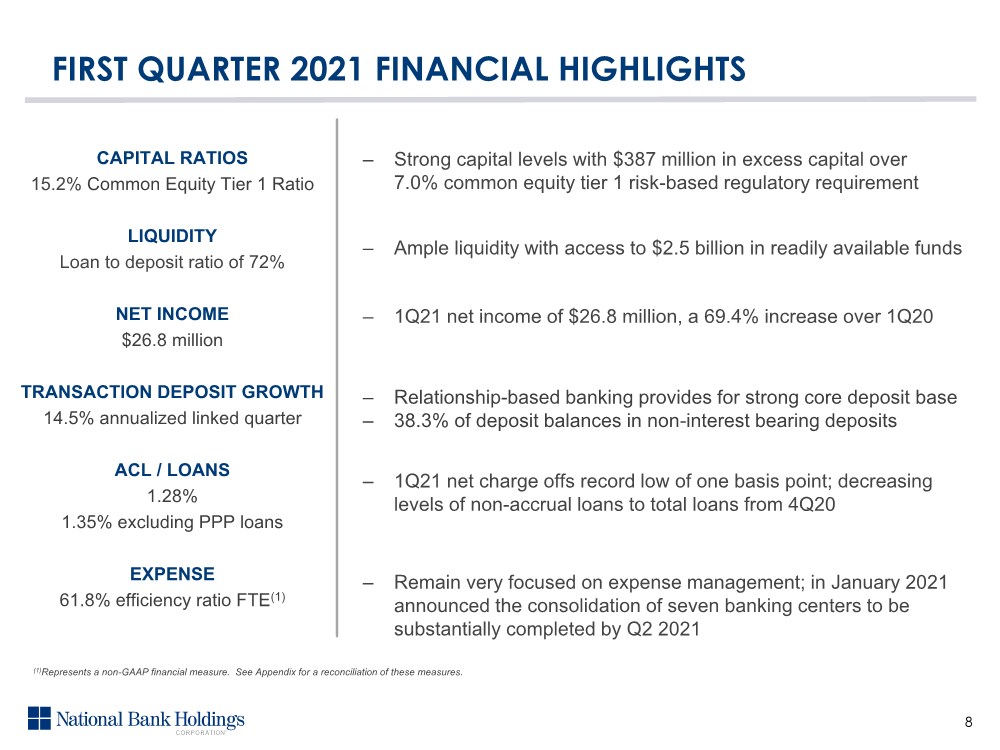
| FIRST QUARTER 2021 FINANCIAL HIGHLIGHTS CAPITAL RATIOS 15.2% Common Equity Tier 1 Ratio LIQUIDITY Loan to deposit ratio of 72% NET INCOME $26.8 million TRANSACTION DEPOSIT GROWTH 14.5% annualized linked quarter ACL / LOANS 1.28% 1.35% excluding PPP loans EXPENSE 61.8% efficiency ratio FTE(1) ‒ Strong capital levels with $387 million in excess capital over 7.0% common equity tier 1 risk-based regulatory requirement ‒ Ample liquidity with access to $2.5 billion in readily available funds ‒ Relationship-based banking provides for strong core deposit base ‒ 38.3% of deposit balances in non-interest bearing deposits ‒ 1Q21 net charge offs record low of one basis point; decreasing levels of non-accrual loans to total loans from 4Q20 ‒ 1Q21 net income of $26.8 million, a 69.4% increase over 1Q20 ‒ Remain very focused on expense management; in January 2021 announced the consolidation of seven banking centers to be substantially completed by Q2 2021 8 (1)Represents a non-GAAP financial measure. See Appendix for a reconciliation of these measures. |
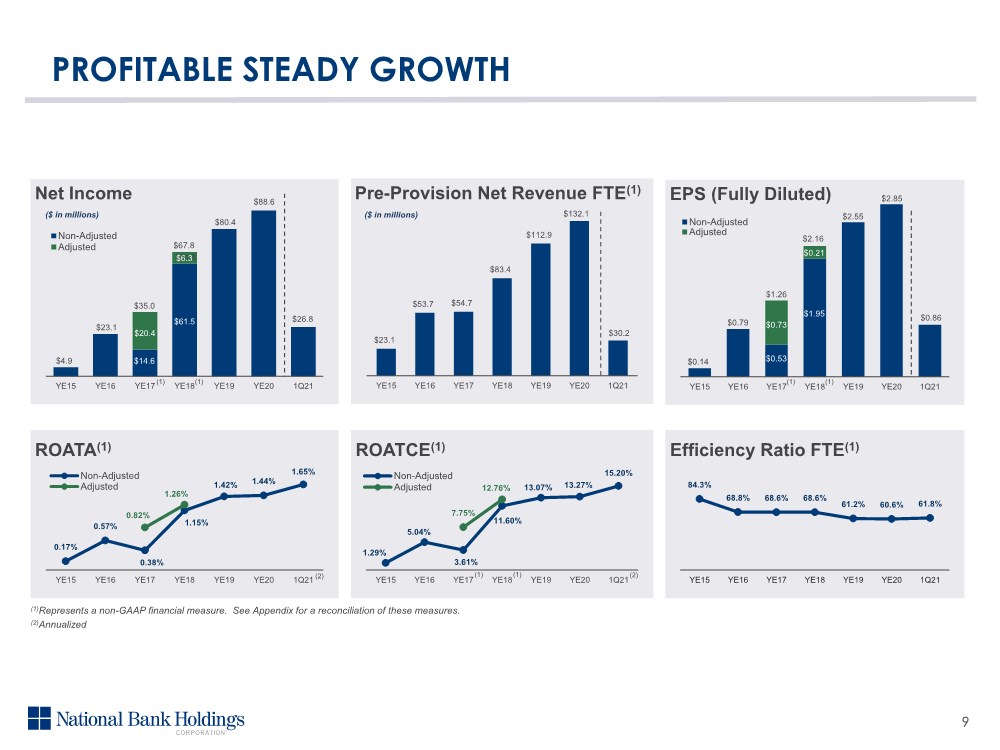
| PROFITABLE STEADY GROWTH $4.9 $23.1 $61.5 $80.4 $6.3 YE15 YE16 YE17 YE18 YE19 YE20 1Q21 Net Income Non-Adjusted Adjusted $0.14 $0.79 $2.55 $0.86 YE15 YE16 YE17 YE18 YE19 YE20 1Q21 EPS (Fully Diluted) Non-Adjusted Adjusted ($ in millions) 0.17% 0.57% 0.38% 1.15% 1.42% 1.44% 1.65% 0.82% 1.26% YE15 YE16 YE17 YE18 YE19 YE20 1Q21 ROATA(1) Non-Adjusted Adjusted 84.3% 68.8% 68.6% 68.6% 61.2% 60.6% 61.8% YE15 YE16 YE17 YE18 YE19 YE20 1Q21 Efficiency Ratio FTE(1) (1)Represents a non-GAAP financial measure. See Appendix for a reconciliation of these measures. (2)Annualized 9 $23.1 $53.7 $54.7 $83.4 $112.9 $132.1 $30.2 YE15 YE16 YE17 YE18 YE19 YE20 1Q21 Pre-Provision Net Revenue FTE(1) ($ in millions) $88.6 $2.85 1.29% 5.04% 3.61% 11.60% 13.07% 13.27% 15.20% 7.75% 12.76% YE15 YE16 YE17 YE18 YE19 YE20 1Q21 ROATCE(1) Non-Adjusted Adjusted (2) (2) $26.8 $20.4 $14.6 $35.0 $61.5 $67.8 (1) (1) $1.26 $0.73 $2.16 $0.53 $1.95 $0.21 (1) (1) (1) (1) |
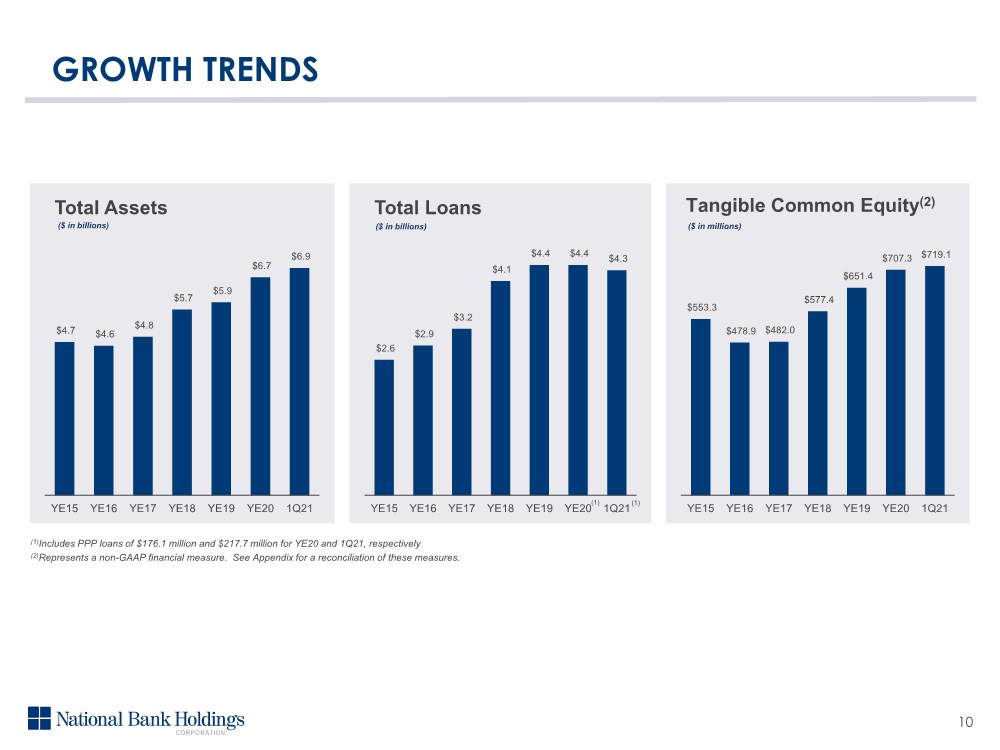
| GROWTH TRENDS $4.7 $4.6 $4.8 $5.7 $5.9 $6.7 $6.9 YE15 YE16 YE17 YE18 YE19 YE20 1Q21 Total Assets $2.6 $2.9 $3.2 $4.1 $4.4 $4.4 $4.3 YE15 YE16 YE17 YE18 YE19 YE20 1Q21 Total Loans $553.3 $478.9 $482.0 $577.4 $651.4 $707.3 $719.1 YE15 YE16 YE17 YE18 YE19 YE20 1Q21 ($ in billions) ($ in billions) ($ in millions) Tangible Common Equity(2) 10 (1) (1)Includes PPP loans of $176.1 million and $217.7 million for YE20 and 1Q21, respectively (2)Represents a non-GAAP financial measure. See Appendix for a reconciliation of these measures. (1) |
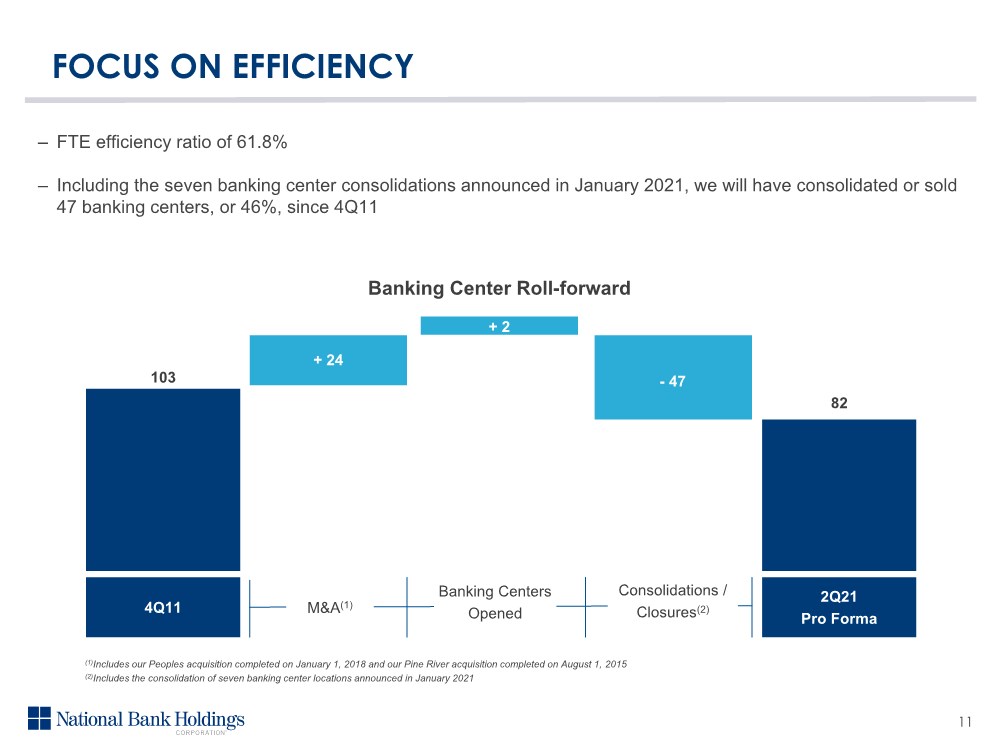
| FOCUS ON EFFICIENCY – FTE efficiency ratio of 61.8% – Including the seven banking center consolidations announced in January 2021, we will have consolidated or sold 47 banking centers, or 46%, since 4Q11 11 4Q11 2Q21 Pro Forma 103 + 24 M&A(1) Banking Centers Opened Consolidations / Closures(2) Banking Center Roll-forward 82 + 2 - 47 (1)Includes our Peoples acquisition completed on January 1, 2018 and our Pine River acquisition completed on August 1, 2015 (2)Includes the consolidation of seven banking center locations announced in January 2021 |
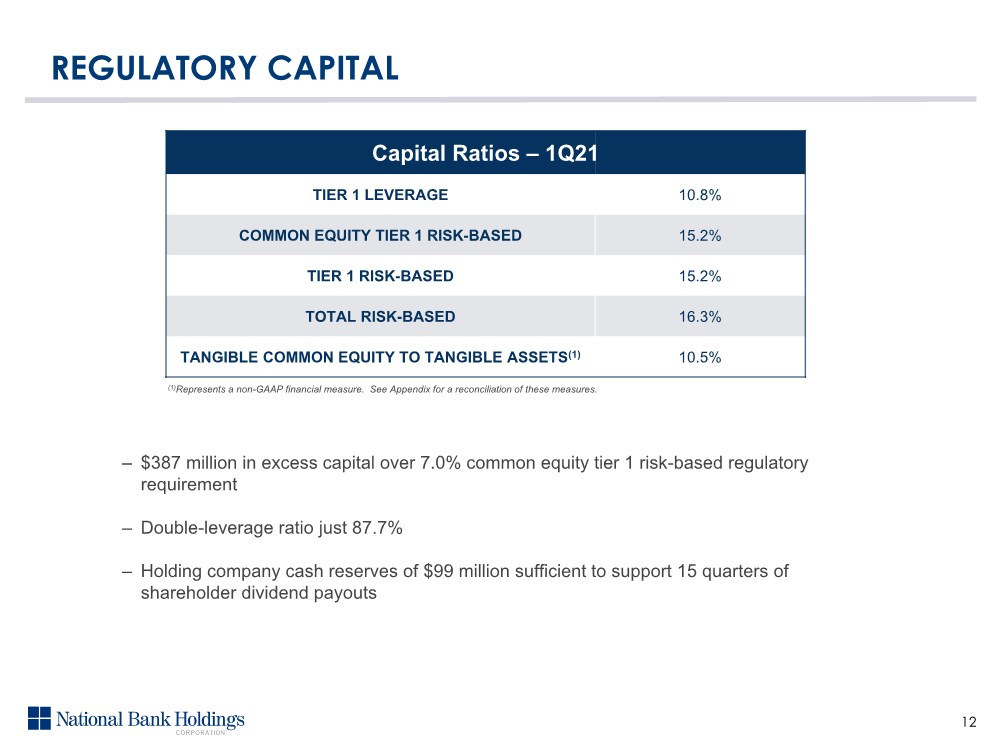
| REGULATORY CAPITAL 12 – $387 million in excess capital over 7.0% common equity tier 1 risk-based regulatory requirement – Double-leverage ratio just 87.7% – Holding company cash reserves of $99 million sufficient to support 15 quarters of shareholder dividend payouts TIER 1 LEVERAGE 10.8% COMMON EQUITY TIER 1 RISK-BASED 15.2% TIER 1 RISK-BASED 15.2% TOTAL RISK-BASED 16.3% TANGIBLE COMMON EQUITY TO TANGIBLE ASSETS(1) 10.5% Capital Ratios – 1Q21 (1)Represents a non-GAAP financial measure. See Appendix for a reconciliation of these measures. |
| 13 CREDIT |

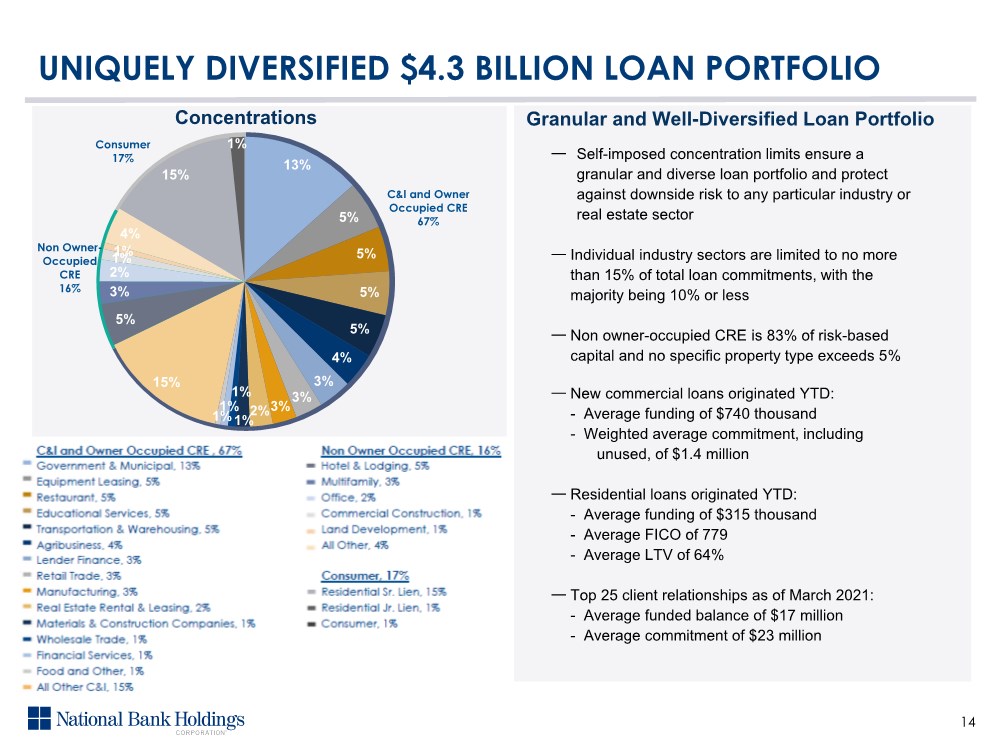
| UNIQUELY DIVERSIFIED $4.3 BILLION LOAN PORTFOLIO 14 Concentrations ― Self-imposed concentration limits ensure a granular and diverse loan portfolio and protect against downside risk to any particular industry or real estate sector ― Individual industry sectors are limited to no more than 15% of total loan commitments, with the majority being 10% or less ― Non owner-occupied CRE is 83% of risk-based capital and no specific property type exceeds 5% ― New commercial loans originated YTD: - Average funding of $740 thousand - Weighted average commitment, including unused, of $1.4 million ― Residential loans originated YTD: - Average funding of $315 thousand - Average FICO of 779 - Average LTV of 64% ― Top 25 client relationships as of March 2021: - Average funded balance of $17 million - Average commitment of $23 million Granular and Well-Diversified Loan Portfolio Consumer, 18% C&I and Owner Occupied CRE , 68% Non Owner Occupied CRE, 14% C&I and Owner Occupied CRE 67% Non Owner- Occupied CRE 16% Consumer 17% 13% 5% 5% 5% 5% 4% 3% 3% 3% 2% 1% 1% 1% 1% 15% 5% 3% 2% 1% 1% 4% 15% 1% |
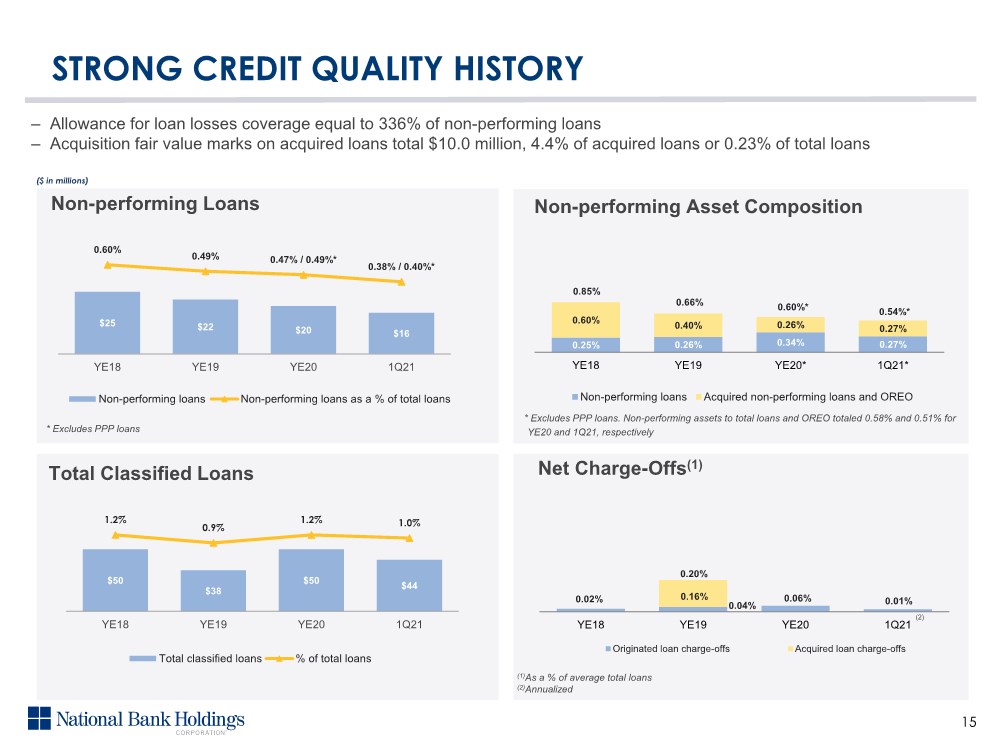
| 0.16% YE18 YE19 YE20 1Q21 Originated loan charge-offs Acquired loan charge-offs 0.25% 0.26% 0.34% 0.27% 0.60% 0.40% 0.26% 0.27% YE18 YE19 YE20* 1Q21* Non-performing loans Acquired non-performing loans and OREO Non-performing Asset Composition 15 ($ in millions) Non-performing Loans Net Charge-Offs(1) Total Classified Loans $50 $38 $50 $44 1.2% 0.9% 1.2% 1.0% YE18 YE19 YE20 1Q21 Total classified loans % of total loans 0.85% 0.66% – Allowance for loan losses coverage equal to 336% of non-performing loans – Acquisition fair value marks on acquired loans total $10.0 million, 4.4% of acquired loans or 0.23% of total loans (1)As a % of average total loans (2)Annualized 0.04% 0.20% 0.02% $25 $22 $20 $16 0.60% 0.49% 0.47% / 0.49%* 0.38% / 0.40%* YE18 YE19 YE20 1Q21 Non-performing loans Non-performing loans as a % of total loans 0.06% STRONG CREDIT QUALITY HISTORY * Excludes PPP loans 0.60%* * Excludes PPP loans. Non-performing assets to total loans and OREO totaled 0.58% and 0.51% for YE20 and 1Q21, respectively (2) 0.54%* 0.01% |
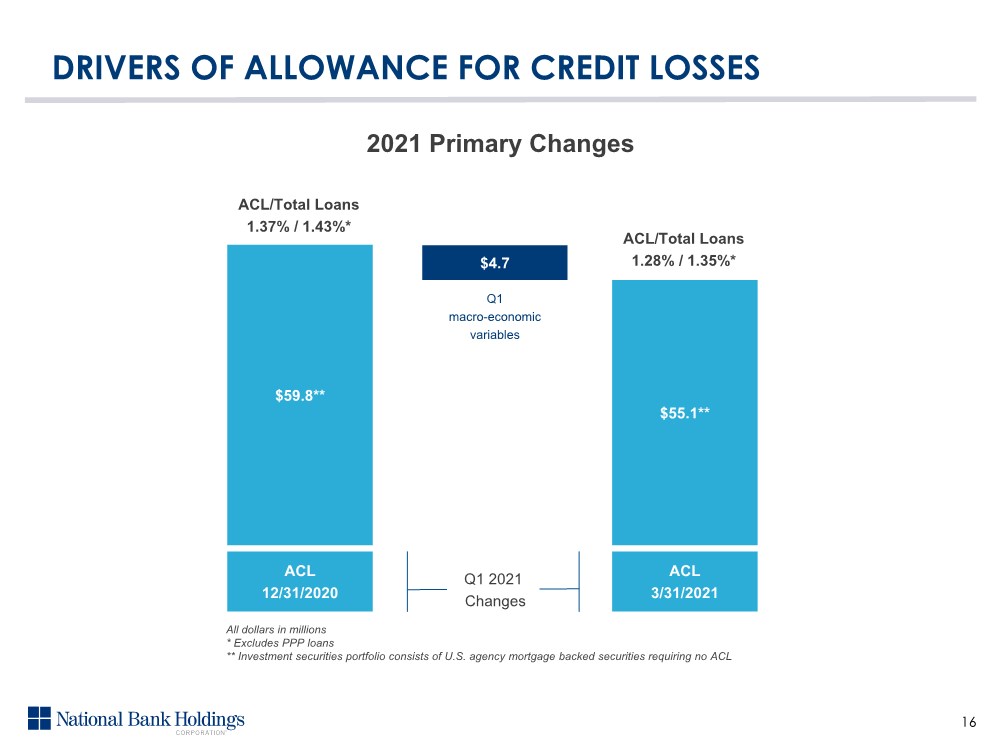
| DRIVERS OF ALLOWANCE FOR CREDIT LOSSES 2021 Primary Changes ACL 12/31/2020 $59.8** ACL/Total Loans 1.37% / 1.43%* All dollars in millions * Excludes PPP loans ** Investment securities portfolio consists of U.S. agency mortgage backed securities requiring no ACL 16 $4.7 ACL 3/31/2021 $55.1** ACL/Total Loans 1.28% / 1.35%* Q1 2021 Changes Q1 macro-economic variables |
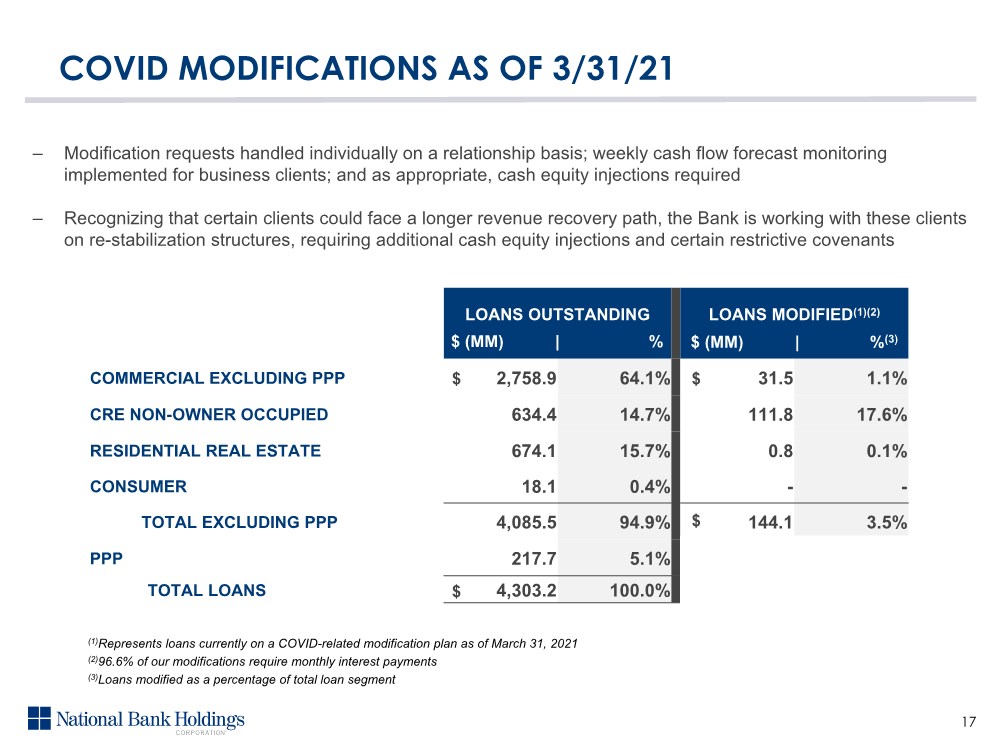
| LOANS OUTSTANDING LOANS MODIFIED(1)(2) COMMERCIAL EXCLUDING PPP 2,758.9 64.1% 31.5 1.1% CRE NON-OWNER OCCUPIED 634.4 14.7% 111.8 17.6% RESIDENTIAL REAL ESTATE 674.1 15.7% 0.8 0.1% CONSUMER 18.1 0.4% -- TOTAL EXCLUDING PPP 4,085.5 94.9% 144.1 3.5% PPP 217.7 5.1% -- TOTAL LOANS 4,303.2 100.0% $ $ ‒ Modification requests handled individually on a relationship basis; weekly cash flow forecast monitoring implemented for business clients; and as appropriate, cash equity injections required ‒ Recognizing that certain clients could face a longer revenue recovery path, the Bank is working with these clients on re-stabilization structures, requiring additional cash equity injections and certain restrictive covenants COVID MODIFICATIONS AS OF 3/31/21 $ $ $ (MM) | % $ (MM) | %(3) 17 (1)Represents loans currently on a COVID-related modification plan as of March 31, 2021 (2)96.6% of our modifications require monthly interest payments (3)Loans modified as a percentage of total loan segment $ |
| 18 BALANCE SHEET |
| Loan Composition ($4.3 Billion) FY15 FY16 FY17 FY18 FY19 FY20 1Q21 SOLID LOAN GROWTH 19 – Portfolio built on a relationship-banking strategy, with emphasis on depository and treasury management relationships – Self-imposed concentration limits; majority of industry sectors limited to 5% or less of total loan commitments – Industries requiring in-depth knowledge are managed by specialty banking teams, with dedicated specialist underwriters – New loan originations over the trailing 12 months totaled $1.2 billion, led by commercial loan originations of $813.3 million, which included PPP loan originations of $480.1 million. During the quarter, we continued our careful approach to extending new credit as well as continuing an intense focus on managing credit risk and yield. ($ in billions) (1) Excludes loans held-for-sale $0.9 Total Loan Originations(1) Total Loans(1) ($ in billions) Owner Occupied CRE 16% CRE 14% Resi Mortgage 16% Other Consumer 1% PPP 5% C & I 48% $1.0 $1.0 $1.2 $1.2 $1.2 4Q15 4Q16 4Q17 4Q18 4Q19 4Q20 1Q21 $2.6 $2.9 $3.2 $4.1 $4.4 $4.4 $1.2 $4.3 TTM: Trailing Twelve Months TTM |
| $1.2 Billion Investment Portfolio(1) HIGH QUALITY, HIGHLY LIQUID INVESTMENT PORTFOLIO 20 U.S. Agency/Sponsored Agency MBS U.S. Agency/Sponsored Agency CMO Other – 99.7% of portfolio is U.S. agency/sponsored agency backed – 1Q21 yield of 1.46% – 44% of portfolio in Held-to-Maturity – Zero allowance for credit losses needed on investment securities portfolio, as portfolio is primarily backed by U.S. agencies (1) Excludes FHLB/FRB stock. 0.3% 48.1% 51.6% |
| $3.5 $3.6 $4.2 $4.8 $1.1 $1.1 $1.0 $1.0 YE18 YE19 YE20 1Q21 Average Transaction Deposits Average Time Deposits Deposit Composition LOW COST TRANSACTION DEPOSITS 21 ($ in billions) Growing Low Cost Transaction Accounts $ 1 2 . 0 Strong Transaction Deposit Growth Low Cost Deposits 39% 41% 47% 47% 37% 37% 36% 37% 21% 19% 14% 13% 3% 3% 3% 3% $4.5 $4.7 $5.7 $6.0 0% 50% 100% YE18 YE19 YE20 1Q21 Demand & NOW Savings & MM CDs < $250k CDs >= $250k Total 2.50% 1.75% 0.25% 0.25% 0.25% 0.37% 0.27% 0.14% 0.45% 0.64% 0.45% 0.28% FY18 FY19 FY20 1Q21 Fed Funds rate Cost of transaction deposits Cost of deposits – Average transaction deposits increased 14.5% annualized, 1Q21 over 4Q20 – The mix of transaction deposits to total deposits improved 160 basis points to 84.2%, 1Q21 over 4Q20 – Cost of transaction deposits decreased one basis point, 1Q21 over 4Q20, to 0.14% 76% Non- Time 78% Non- Time 83% Non- Time 84% Non- Time |
| 22 MANAGEMENT TEAM |
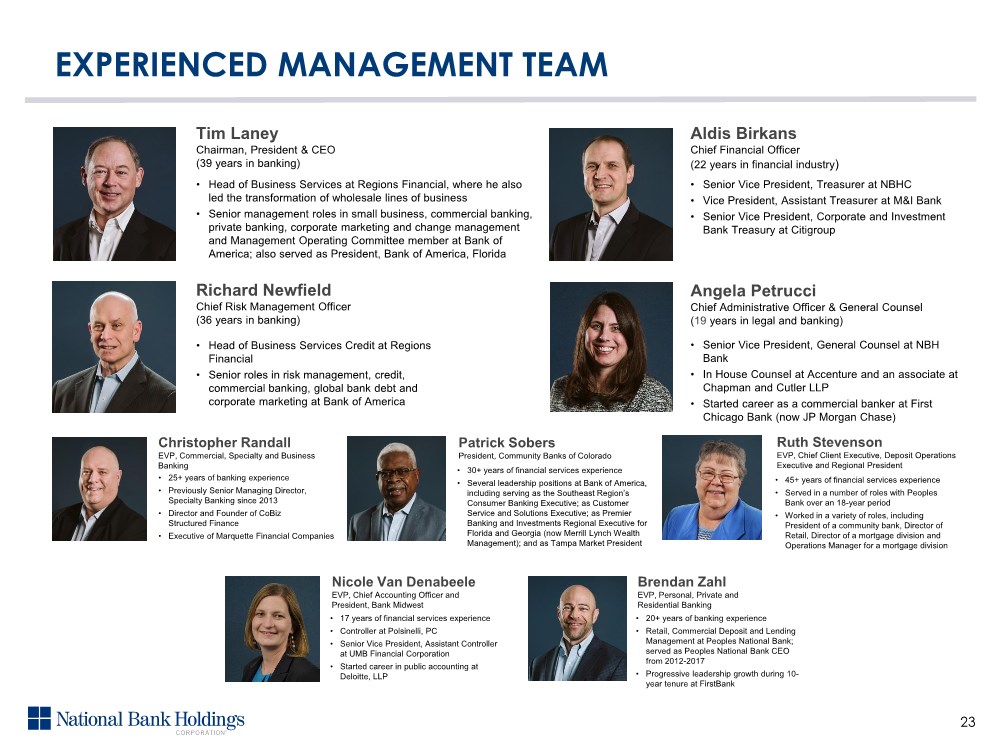
| EXPERIENCED MANAGEMENT TEAM Nicole Van Denabeele EVP, Chief Accounting Officer and President, Bank Midwest • 17 years of financial services experience • Controller at Polsinelli, PC • Senior Vice President, Assistant Controller at UMB Financial Corporation • Started career in public accounting at Deloitte, LLP Christopher Randall EVP, Commercial, Specialty and Business Banking • 25+ years of banking experience • Previously Senior Managing Director, Specialty Banking since 2013 • Director and Founder of CoBiz Structured Finance • Executive of Marquette Financial Companies Patrick Sobers President, Community Banks of Colorado • 30+ years of financial services experience • Several leadership positions at Bank of America, including serving as the Southeast Region’s Consumer Banking Executive; as Customer Service and Solutions Executive; as Premier Banking and Investments Regional Executive for Florida and Georgia (now Merrill Lynch Wealth Management); and as Tampa Market President Ruth Stevenson EVP, Chief Client Executive, Deposit Operations Executive and Regional President • 45+ years of financial services experience • Served in a number of roles with Peoples Bank over an 18-year period • Worked in a variety of roles, including President of a community bank, Director of Retail, Director of a mortgage division and Operations Manager for a mortgage division Brendan Zahl EVP, Personal, Private and Residential Banking • 20+ years of banking experience • Retail, Commercial Deposit and Lending Management at Peoples National Bank; served as Peoples National Bank CEO from 2012-2017 • Progressive leadership growth during 10- year tenure at FirstBank 23 Tim Laney Chairman, President & CEO (39 years in banking) • Head of Business Services at Regions Financial, where he also led the transformation of wholesale lines of business • Senior management roles in small business, commercial banking, private banking, corporate marketing and change management and Management Operating Committee member at Bank of America; also served as President, Bank of America, Florida Richard Newfield Chief Risk Management Officer (36 years in banking) • Head of Business Services Credit at Regions Financial • Senior roles in risk management, credit, commercial banking, global bank debt and corporate marketing at Bank of America Aldis Birkans Chief Financial Officer (22 years in financial industry) • Senior Vice President, Treasurer at NBHC • Vice President, Assistant Treasurer at M&I Bank • Senior Vice President, Corporate and Investment Bank Treasury at Citigroup Angela Petrucci Chief Administrative Officer & General Counsel (19 years in legal and banking) • Senior Vice President, General Counsel at NBH Bank • In House Counsel at Accenture and an associate at Chapman and Cutler LLP • Started career as a commercial banker at First Chicago Bank (now JP Morgan Chase) |
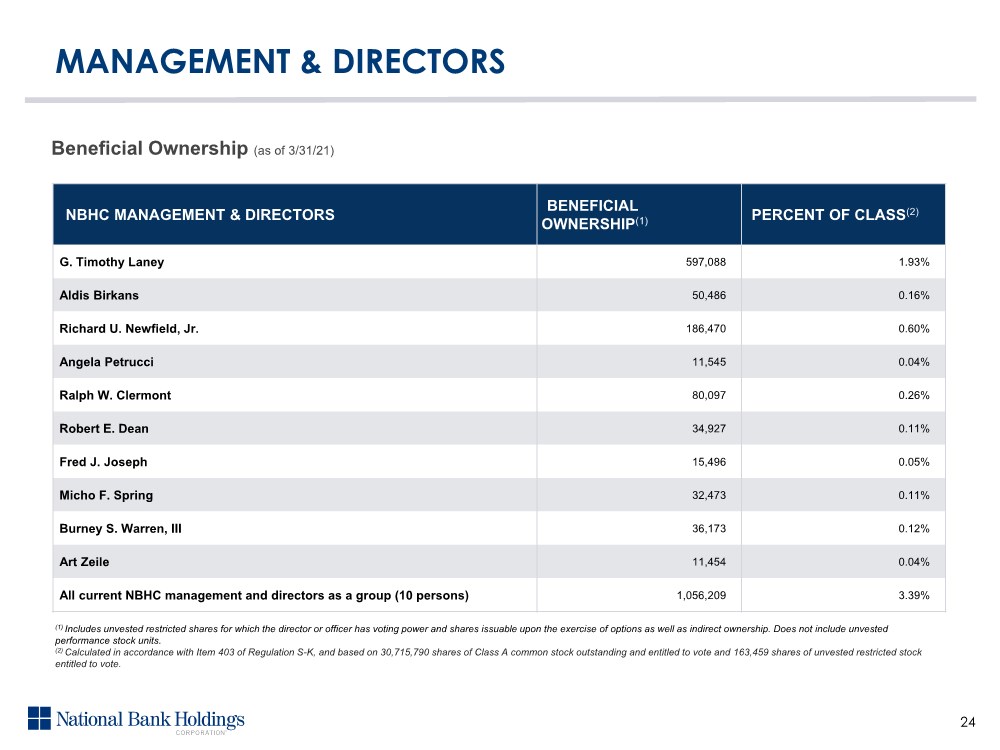
| MANAGEMENT & DIRECTORS 24 NBHC MANAGEMENT & DIRECTORS BENEFICIAL OWNERSHIP(1) PERCENT OF CLASS(2) G. Timothy Laney 597,088 1.93% Aldis Birkans 50,486 0.16% Richard U. Newfield, Jr. 186,470 0.60% Angela Petrucci 11,545 0.04% Ralph W. Clermont 80,097 0.26% Robert E. Dean 34,927 0.11% Fred J. Joseph 15,496 0.05% Micho F. Spring 32,473 0.11% Burney S. Warren, III 36,173 0.12% Art Zeile 11,454 0.04% All current NBHC management and directors as a group (10 persons) 1,056,209 3.39% Beneficial Ownership (as of 3/31/21) (1) Includes unvested restricted shares for which the director or officer has voting power and shares issuable upon the exercise of options as well as indirect ownership. Does not include unvested performance stock units. (2) Calculated in accordance with Item 403 of Regulation S-K, and based on 30,715,790 shares of Class A common stock outstanding and entitled to vote and 163,459 shares of unvested restricted stock entitled to vote. |
| 25 CORPORATE GOVERNANCE OVERVIEW |
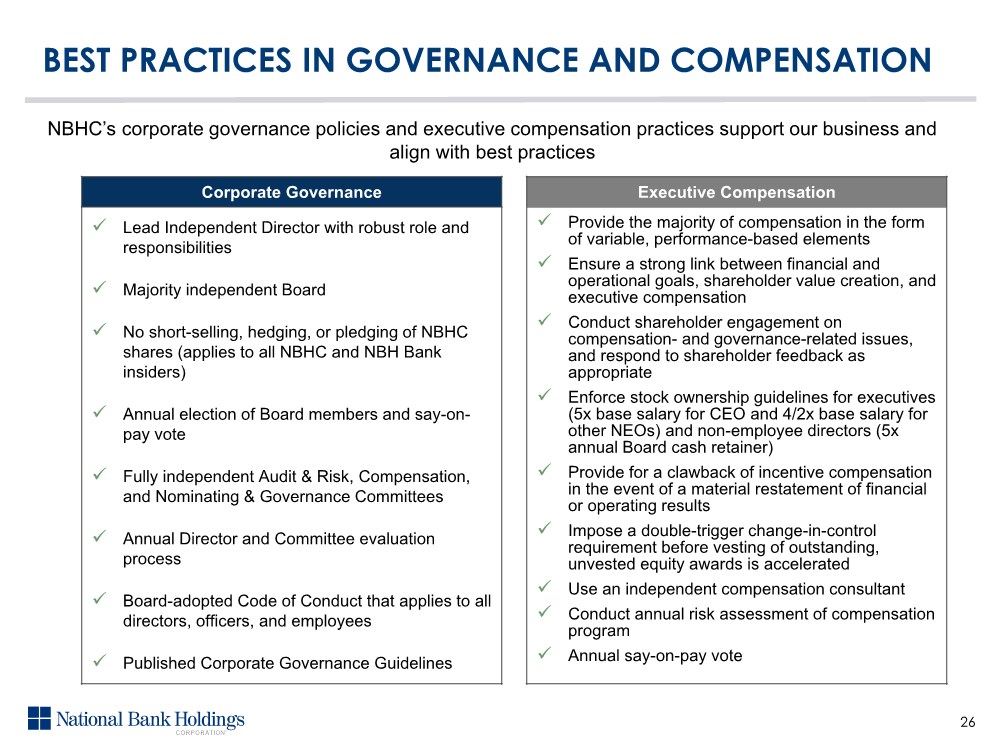
| BEST PRACTICES IN GOVERNANCE AND COMPENSATION Corporate Governance Lead Independent Director with robust role and responsibilities Majority independent Board No short-selling, hedging, or pledging of NBHC shares (applies to all NBHC and NBH Bank insiders) Annual election of Board members and say-on- pay vote Fully independent Audit & Risk, Compensation, and Nominating & Governance Committees Annual Director and Committee evaluation process Board-adopted Code of Conduct that applies to all directors, officers, and employees Published Corporate Governance Guidelines Executive Compensation Provide the majority of compensation in the form of variable, performance-based elements Ensure a strong link between financial and operational goals, shareholder value creation, and executive compensation Conduct shareholder engagement on compensation- and governance-related issues, and respond to shareholder feedback as appropriate Enforce stock ownership guidelines for executives (5x base salary for CEO and 4/2x base salary for other NEOs) and non-employee directors (5x annual Board cash retainer) Provide for a clawback of incentive compensation in the event of a material restatement of financial or operating results Impose a double-trigger change-in-control requirement before vesting of outstanding, unvested equity awards is accelerated Use an independent compensation consultant Conduct annual risk assessment of compensation program Annual say-on-pay vote NBHC’s corporate governance policies and executive compensation practices support our business and align with best practices 26 |
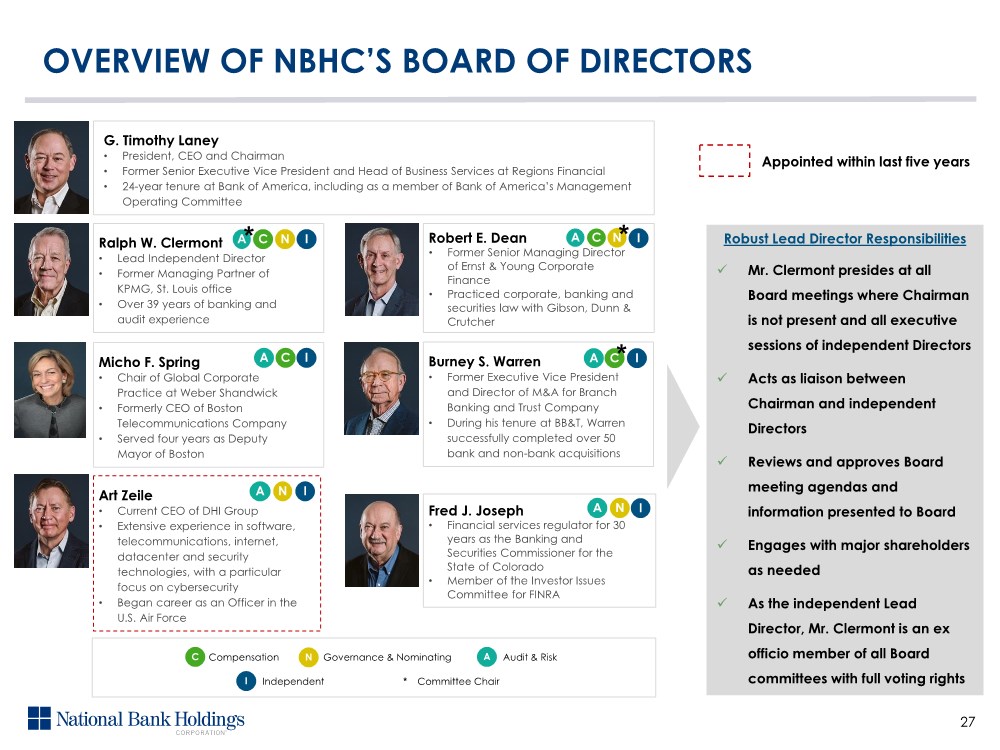
| OVERVIEW OF NBHC’S BOARD OF DIRECTORS 27 N Governance & Nominating C Compensation Committee Chair * Ralph W. Clermont • Lead Independent Director • Former Managing Partner of KPMG, St. Louis office • Over 39 years of banking and audit experience A Audit & Risk I Independent Robust Lead Director Responsibilities Mr. Clermont presides at all Board meetings where Chairman is not present and all executive sessions of independent Directors Acts as liaison between Chairman and independent Directors Reviews and approves Board meeting agendas and information presented to Board Engages with major shareholders as needed As the independent Lead Director, Mr. Clermont is an ex officio member of all Board committees with full voting rights Art Zeile • Current CEO of DHI Group • Extensive experience in software, telecommunications, internet, datacenter and security technologies, with a particular focus on cybersecurity • Began career as an Officer in the U.S. Air Force Micho F. Spring • Chair of Global Corporate Practice at Weber Shandwick • Formerly CEO of Boston Telecommunications Company • Served four years as Deputy Mayor of Boston Burney S. Warren • Former Executive Vice President and Director of M&A for Branch Banking and Trust Company • During his tenure at BB&T, Warren successfully completed over 50 bank and non-bank acquisitions Fred J. Joseph • Financial services regulator for 30 years as the Banking and Securities Commissioner for the State of Colorado • Member of the Investor Issues Committee for FINRA Robert E. Dean • Former Senior Managing Director of Ernst & Young Corporate Finance • Practiced corporate, banking and securities law with Gibson, Dunn & Crutcher G. Timothy Laney • President, CEO and Chairman • Former Senior Executive Vice President and Head of Business Services at Regions Financial • 24-year tenure at Bank of America, including as a member of Bank of America’s Management Operating Committee I I II IN C*A N NA NI C AC A ** Appointed within last five years AC A |
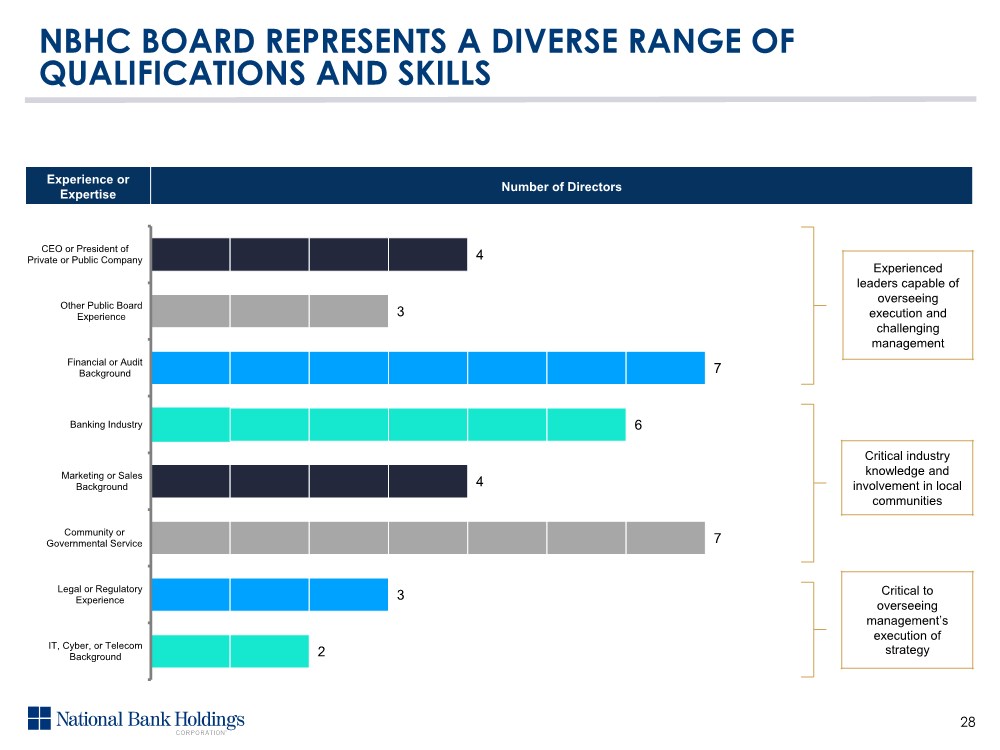
| 4 3 7 6 4 7 3 2 CEO or President of Private or Public Company Other Public Board Experience Financial or Audit Background Banking Industry Marketing or Sales Background Community or Governmental Service Legal or Regulatory Experience IT, Cyber, or Telecom Background NBHC BOARD REPRESENTS A DIVERSE RANGE OF QUALIFICATIONS AND SKILLS 28 Experience or Expertise Number of Directors Experienced leaders capable of overseeing execution and challenging management Critical industry knowledge and involvement in local communities Critical to overseeing management’s execution of strategy |
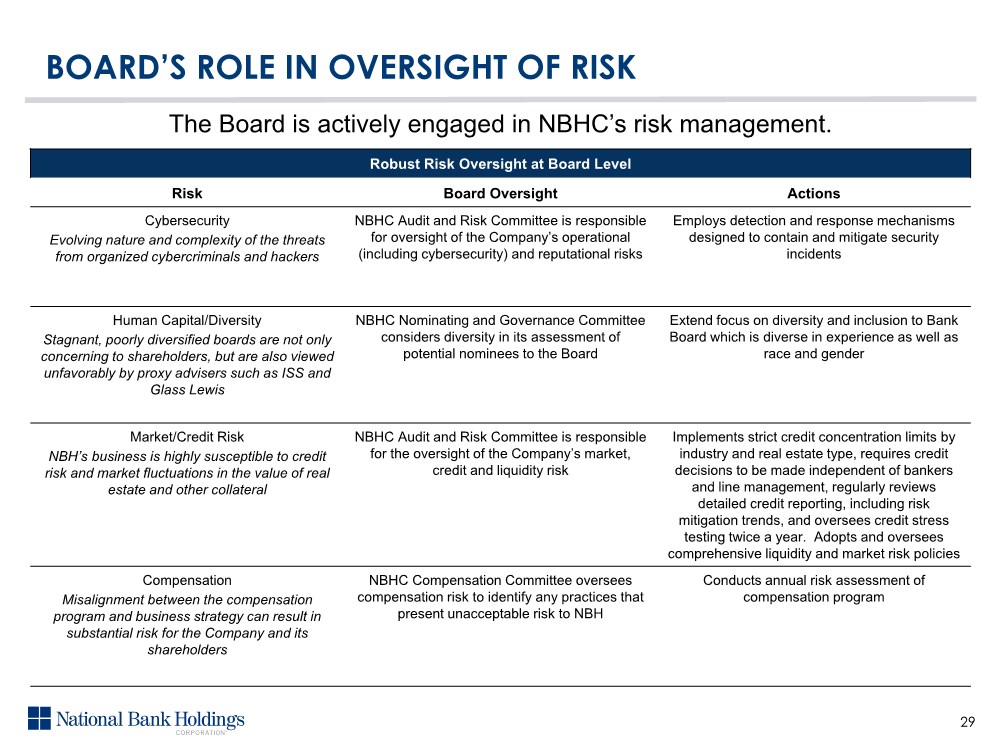
| The Board is actively engaged in NBHC’s risk management. 29 BOARD’S ROLE IN OVERSIGHT OF RISK Robust Risk Oversight at Board Level Risk Board Oversight Actions Cybersecurity Evolving nature and complexity of the threats from organized cybercriminals and hackers NBHC Audit and Risk Committee is responsible for oversight of the Company’s operational (including cybersecurity) and reputational risks Employs detection and response mechanisms designed to contain and mitigate security incidents Human Capital/Diversity Stagnant, poorly diversified boards are not only concerning to shareholders, but are also viewed unfavorably by proxy advisers such as ISS and Glass Lewis NBHC Nominating and Governance Committee considers diversity in its assessment of potential nominees to the Board Extend focus on diversity and inclusion to Bank Board which is diverse in experience as well as race and gender Market/Credit Risk NBH’s business is highly susceptible to credit risk and market fluctuations in the value of real estate and other collateral NBHC Audit and Risk Committee is responsible for the oversight of the Company’s market, credit and liquidity risk Implements strict credit concentration limits by industry and real estate type, requires credit decisions to be made independent of bankers and line management, regularly reviews detailed credit reporting, including risk mitigation trends, and oversees credit stress testing twice a year. Adopts and oversees comprehensive liquidity and market risk policies Compensation Misalignment between the compensation program and business strategy can result in substantial risk for the Company and its shareholders NBHC Compensation Committee oversees compensation risk to identify any practices that present unacceptable risk to NBH Conducts annual risk assessment of compensation program |
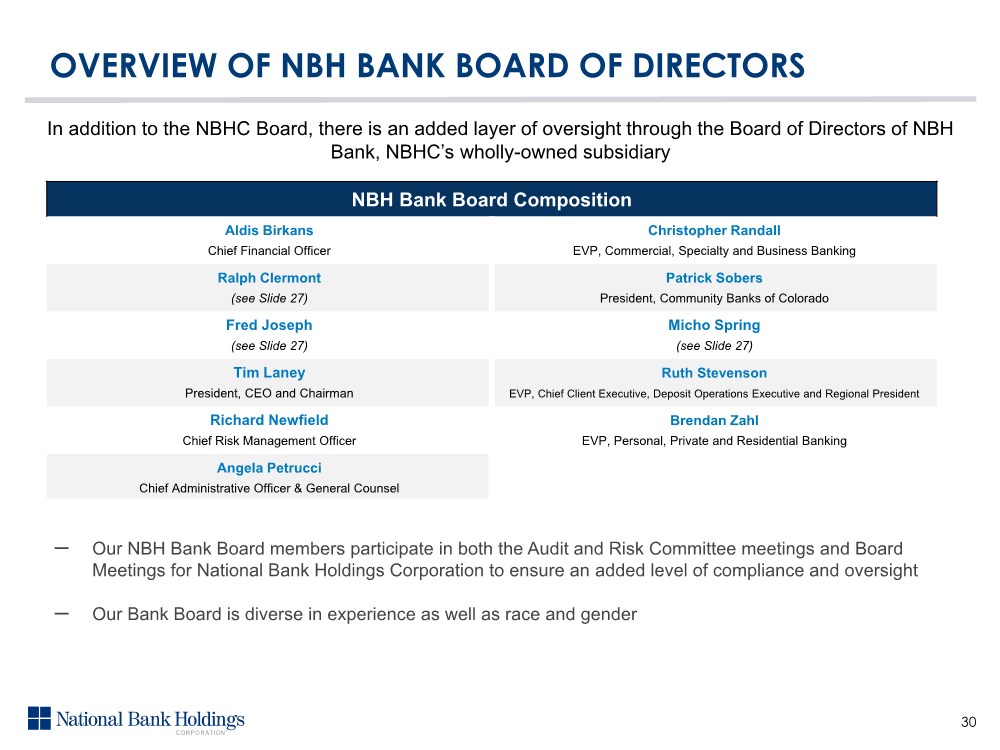
| OVERVIEW OF NBH BANK BOARD OF DIRECTORS 30 NBH Bank Board Composition Aldis Birkans Chief Financial Officer Christopher Randall EVP, Commercial, Specialty and Business Banking Ralph Clermont (see Slide 27) Patrick Sobers President, Community Banks of Colorado Fred Joseph (see Slide 27) Micho Spring (see Slide 27) Tim Laney President, CEO and Chairman Ruth Stevenson EVP, Chief Client Executive, Deposit Operations Executive and Regional President Richard Newfield Chief Risk Management Officer Brendan Zahl EVP, Personal, Private and Residential Banking Angela Petrucci Chief Administrative Officer & General Counsel – Our NBH Bank Board members participate in both the Audit and Risk Committee meetings and Board Meetings for National Bank Holdings Corporation to ensure an added level of compliance and oversight – Our Bank Board is diverse in experience as well as race and gender In addition to the NBHC Board, there is an added layer of oversight through the Board of Directors of NBH Bank, NBHC’s wholly-owned subsidiary |
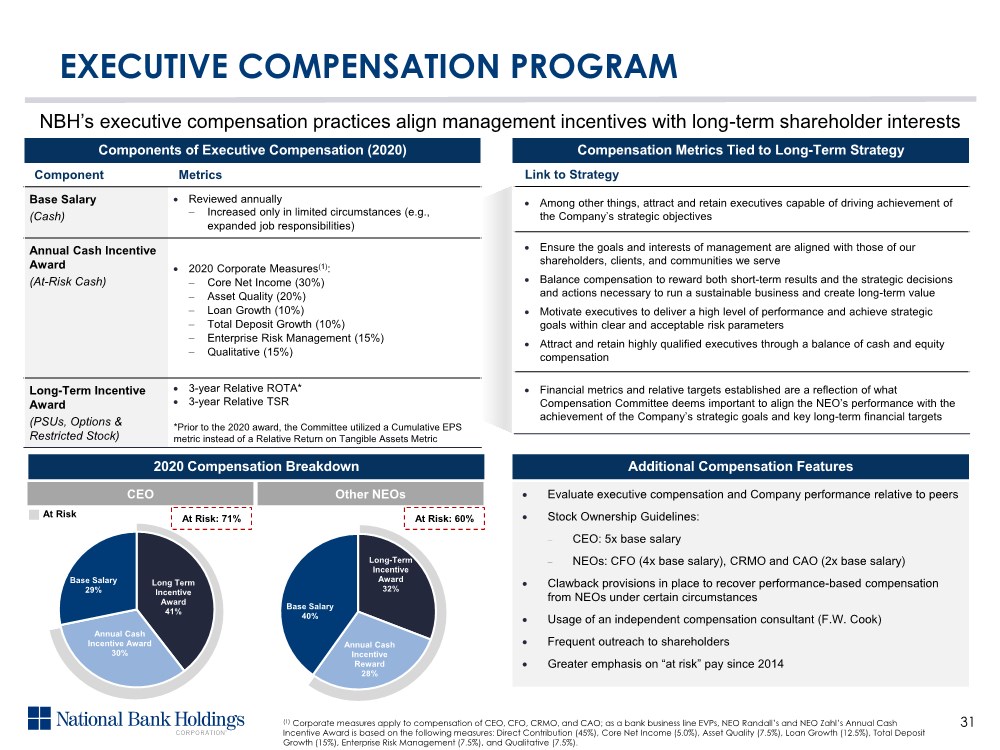
| NBH’s executive compensation practices align management incentives with long-term shareholder interests 31 EXECUTIVE COMPENSATION PROGRAM Components of Executive Compensation (2020) 2020 Compensation Breakdown Additional Compensation Features Component Metrics Base Salary (Cash) Reviewed annually Increased only in limited circumstances (e.g., expanded job responsibilities) Annual Cash Incentive Award (At-Risk Cash) 2020 Corporate Measures(1): Core Net Income (30%) Asset Quality (20%) Loan Growth (10%) Total Deposit Growth (10%) Enterprise Risk Management (15%) Qualitative (15%) Long-Term Incentive Award (PSUs, Options & Restricted Stock) 3-year Relative ROTA* 3-year Relative TSR *Prior to the 2020 award, the Committee utilized a Cumulative EPS metric instead of a Relative Return on Tangible Assets Metric Link to Strategy Among other things, attract and retain executives capable of driving achievement of the Company’s strategic objectives Ensure the goals and interests of management are aligned with those of our shareholders, clients, and communities we serve Balance compensation to reward both short-term results and the strategic decisions and actions necessary to run a sustainable business and create long-term value Motivate executives to deliver a high level of performance and achieve strategic goals within clear and acceptable risk parameters Attract and retain highly qualified executives through a balance of cash and equity compensation Financial metrics and relative targets established are a reflection of what Compensation Committee deems important to align the NEO’s performance with the achievement of the Company’s strategic goals and key long-term financial targets Evaluate executive compensation and Company performance relative to peers Stock Ownership Guidelines: CEO: 5x base salary NEOs: CFO (4x base salary), CRMO and CAO (2x base salary) Clawback provisions in place to recover performance-based compensation from NEOs under certain circumstances Usage of an independent compensation consultant (F.W. Cook) Frequent outreach to shareholders Greater emphasis on “at risk” pay since 2014 Compensation Metrics Tied to Long-Term Strategy CEO Other NEOs At Risk At Risk: 71% At Risk: 60% (1) Corporate measures apply to compensation of CEO, CFO, CRMO, and CAO; as a bank business line EVPs, NEO Randall’s and NEO Zahl’s Annual Cash Incentive Award is based on the following measures: Direct Contribution (45%), Core Net Income (5.0%), Asset Quality (7.5%), Loan Growth (12.5%), Total Deposit Growth (15%), Enterprise Risk Management (7.5%), and Qualitative (7.5%). Long Term Incentive Award 41% Annual Cash Incentive Award 30% Base Salary 29% Long-Term Incentive Award 32% Annual Cash Incentive Reward 28% Base Salary 40% |
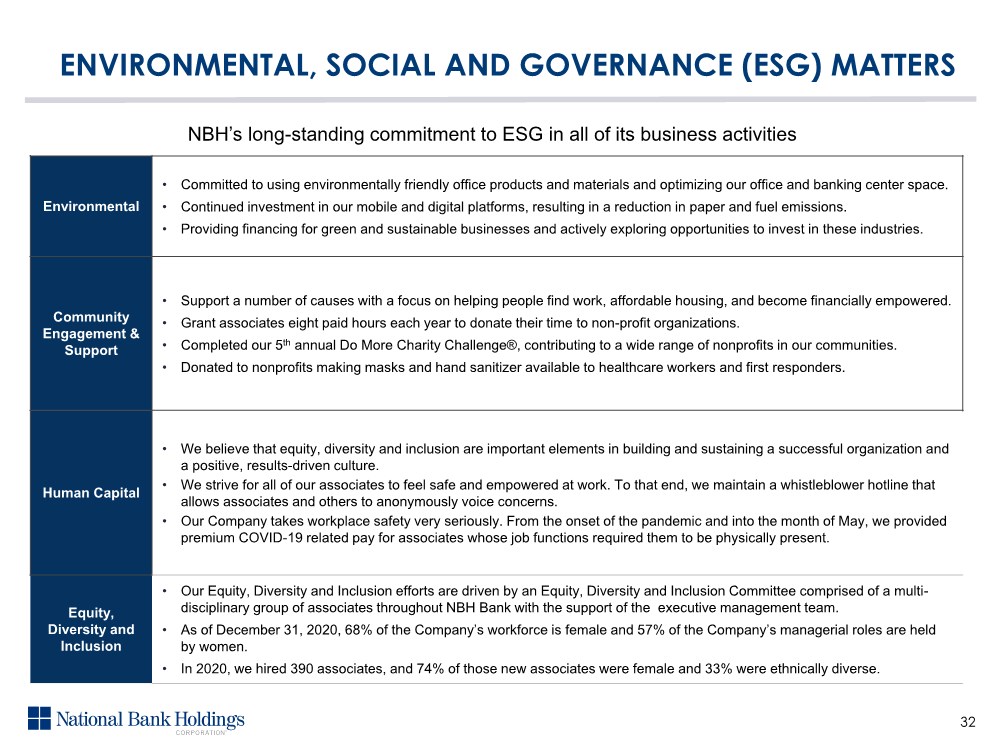
| Environmental • Committed to using environmentally friendly office products and materials and optimizing our office and banking center space. • Continued investment in our mobile and digital platforms, resulting in a reduction in paper and fuel emissions. • Providing financing for green and sustainable businesses and actively exploring opportunities to invest in these industries. Community Engagement & Support • Support a number of causes with a focus on helping people find work, affordable housing, and become financially empowered. • Grant associates eight paid hours each year to donate their time to non-profit organizations. • Completed our 5th annual Do More Charity Challenge®, contributing to a wide range of nonprofits in our communities. • Donated to nonprofits making masks and hand sanitizer available to healthcare workers and first responders. Human Capital • We believe that equity, diversity and inclusion are important elements in building and sustaining a successful organization and a positive, results-driven culture. • We strive for all of our associates to feel safe and empowered at work. To that end, we maintain a whistleblower hotline that allows associates and others to anonymously voice concerns. • Our Company takes workplace safety very seriously. From the onset of the pandemic and into the month of May, we provided premium COVID-19 related pay for associates whose job functions required them to be physically present. Equity, Diversity and Inclusion • Our Equity, Diversity and Inclusion efforts are driven by an Equity, Diversity and Inclusion Committee comprised of a multi- disciplinary group of associates throughout NBH Bank with the support of the executive management team. • As of December 31, 2020, 68% of the Company’s workforce is female and 57% of the Company’s managerial roles are held by women. • In 2020, we hired 390 associates, and 74% of those new associates were female and 33% were ethnically diverse. NBH’s long-standing commitment to ESG in all of its business activities 32 ENVIRONMENTAL, SOCIAL AND GOVERNANCE (ESG) MATTERS |
| 33 APPENDIX |
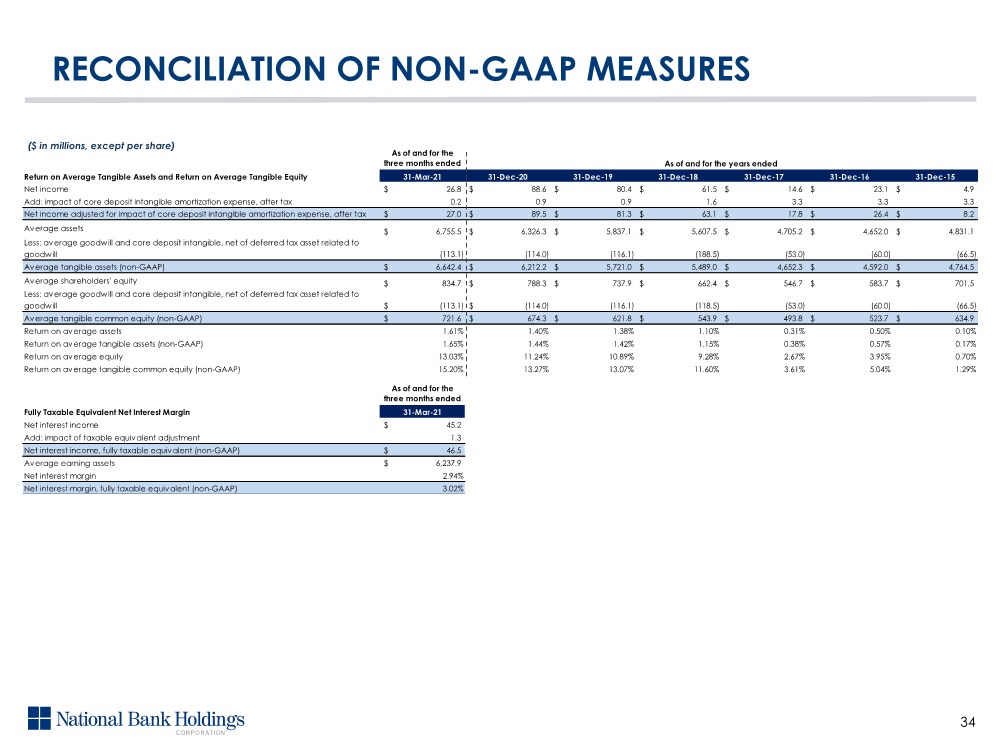
| As of and for the three months ended Return on Average Tangible Assets and Return on Average Tangible Equity 31-Mar-21 31-Dec-20 31-Dec-19 31-Dec-18 31-Dec-17 31-Dec-16 31-Dec-15 Net income 26.8 $ 88.6 $ 80.4 $ 61.5 $ 14.6 $ 23.1 $ 4.9 $ Add: impact of core deposit intangible amortization expense, after tax 0.2 0.9 0.9 1.6 3.3 3.3 3.3 Net income adjusted for impact of core deposit intangible amortization expense, after tax 27.0 $ 89.5 $ 81.3 $ 63.1 $ 17.8 $ 26.4 $ 8.2 $ Average assets 6,755.5 $ 6,326.3 $ 5,837.1 $ 5,607.5 $ 4,705.2 $ 4,652.0 $ 4,831.1 $ Less: average goodwill and core deposit intangible, net of deferred tax asset related to goodwill (113.1) (114.0) (116.1) (188.5) (53.0) (60.0) (66.5) Average tangible assets (non-GAAP) 6,642.4 $ 6,212.2 $ 5,721.0 $ 5,489.0 $ 4,652.3 $ 4,592.0 $ 4,764.5 $ Average shareholders' equity 834.7 $ 788.3 $ 737.9 $ 662.4 $ 546.7 $ 583.7 $ 701.5 $ Less: average goodwill and core deposit intangible, net of deferred tax asset related to goodwill (113.1) $ (114.0) $ (116.1) (118.5) (53.0) (60.0) (66.5) Average tangible common equity (non-GAAP) 721.6 $ 674.3 $ 621.8 $ 543.9 $ 493.8 $ 523.7 $ 634.9 $ Return on average assets 1.61% 1.40% 1.38% 1.10% 0.31% 0.50% 0.10% Return on average tangible assets (non-GAAP) 1.65% 1.44% 1.42% 1.15% 0.38% 0.57% 0.17% Return on average equity 13.03% 11.24% 10.89% 9.28% 2.67% 3.95% 0.70% Return on average tangible common equity (non-GAAP) 15.20% 13.27% 13.07% 11.60% 3.61% 5.04% 1.29% As of and for the three months ended Fully Taxable Equivalent Net Interest Margin 31-Mar-21 Net interest income 45.2 $ Add: impact of taxable equivalent adjustment 1.3 Net interest income, fully taxable equivalent (non-GAAP) 46.5 $ Average earning assets 6,237.9 $ Net interest margin 2.94% Net interest margin, fully taxable equivalent (non-GAAP) 3.02% As of and for the years ended RECONCILIATION OF NON-GAAP MEASURES 34 ($ in millions, except per share) |
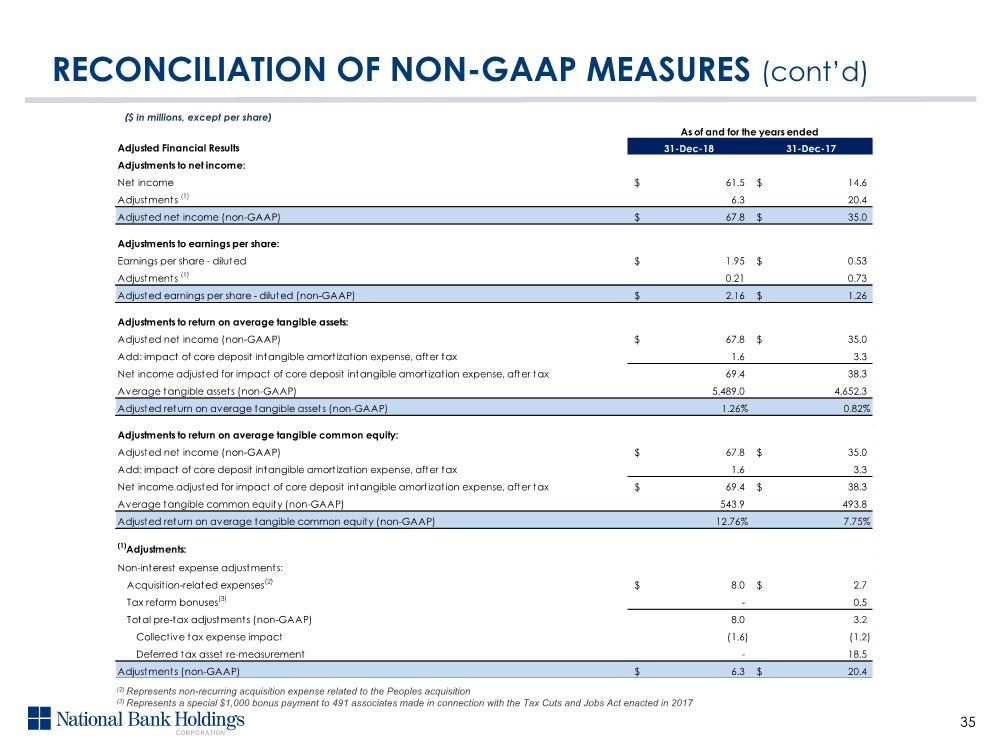
| 35 ($ in millions, except per share) RECONCILIATION OF NON-GAAP MEASURES (cont’d) (2) Represents non-recurring acquisition expense related to the Peoples acquisition (3) Represents a special $1,000 bonus payment to 491 associates made in connection with the Tax Cuts and Jobs Act enacted in 2017 Adjusted Financial Results 31-Dec-18 31-Dec-17 Adjustments to net income: Net income 61.5 $ 14.6 $ Adjustments (1) 6.3 20.4 Adjusted net income (non-GAAP) 67.8 $ 35.0 $ Adjustments to earnings per share: Earnings per share - diluted 1.95 $ 0.53 $ Adjustments (1) 0.21 0.73 Adjusted earnings per share - diluted (non-GAAP) 2.16 $ 1.26 $ Adjustments to return on average tangible assets: Adjusted net income (non-GAAP) 67.8 $ 35.0 $ Add: impact of core deposit intangible amortization expense, after tax 1.6 3.3 Net income adjusted for impact of core deposit intangible amortization expense, after tax 69.4 38.3 Average tangible assets (non-GAAP) 5,489.0 4,652.3 Adjusted return on average tangible assets (non-GAAP) 1.26% 0.82% Adjustments to return on average tangible common equity: Adjusted net income (non-GAAP) 67.8 $ 35.0 $ Add: impact of core deposit intangible amortization expense, after tax 1.6 3.3 Net income adjusted for impact of core deposit intangible amortization expense, after tax 69.4 $ 38.3 $ Average tangible common equity (non-GAAP) 543.9 493.8 Adjusted return on average tangible common equity (non-GAAP) 12.76% 7.75% (1)Adjustments: Non-interest expense adjustments: Acquisition-related expenses(2) 8.0 $ 2.7 $ Tax reform bonuses(3) - 0.5 Total pre-tax adjustments (non-GAAP) 8.0 3.2 Collective tax expense impact (1.6) (1.2) Deferred tax asset re-measurement - 18.5 Adjustments (non-GAAP) 6.3 $ 20.4 $ As of and for the years ended |
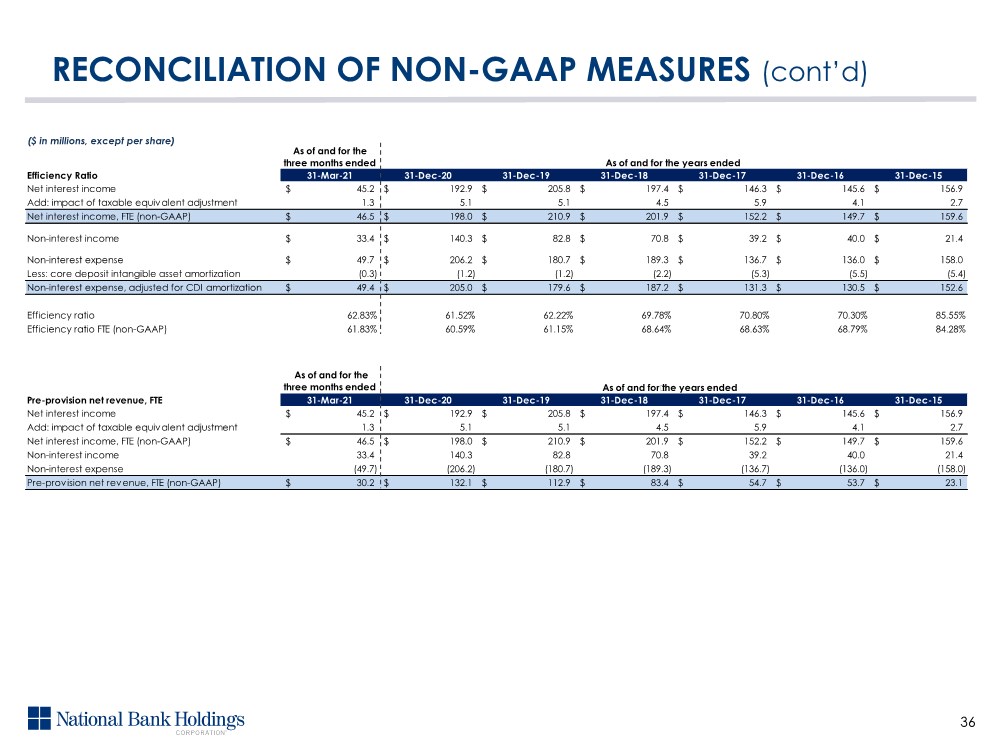
| Efficiency Ratio 31-Mar-21 31-Dec-20 31-Dec-19 31-Dec-18 31-Dec-17 31-Dec-16 31-Dec-15 Net interest income 45.2 $ 192.9 $ 205.8 $ 197.4 $ 146.3 $ 145.6 $ 156.9 $ Add: impact of taxable equivalent adjustment 1.3 5.1 5.1 4.5 5.9 4.1 2.7 Net interest income, FTE (non-GAAP) 46.5 $ 198.0 $ 210.9 $ 201.9 $ 152.2 $ 149.7 $ 159.6 $ Non-interest income 33.4 $ 140.3 $ 82.8 $ 70.8 $ 39.2 $ 40.0 $ 21.4 $ Non-interest expense 49.7 $ 206.2 $ 180.7 $ 189.3 $ 136.7 $ 136.0 $ 158.0 $ Less: core deposit intangible asset amortization (0.3) (1.2) (1.2) (2.2) (5.3) (5.5) (5.4) Non-interest expense, adjusted for CDI amortization 49.4 $ 205.0 $ 179.6 $ 187.2 $ 131.3 $ 130.5 $ 152.6 $ Efficiency ratio 62.83% 61.52% 62.22% 69.78% 70.80% 70.30% 85.55% Efficiency ratio FTE (non-GAAP) 61.83% 60.59% 61.15% 68.64% 68.63% 68.79% 84.28% As of and for the three months ended Pre-provision net revenue, FTE 31-Mar-21 31-Dec-20 31-Dec-19 31-Dec-18 31-Dec-17 31-Dec-16 31-Dec-15 Net interest income 45.2 $ 192.9 $ 205.8 $ 197.4 $ 146.3 $ 145.6 $ 156.9 $ Add: impact of taxable equivalent adjustment 1.3 5.1 5.1 4.5 5.9 4.1 2.7 Net interest income, FTE (non-GAAP) 46.5 $ 198.0 $ 210.9 $ 201.9 $ 152.2 $ 149.7 $ 159.6 $ Non-interest income 33.4 140.3 82.8 70.8 39.2 40.0 21.4 Non-interest expense (49.7) (206.2) (180.7) (189.3) (136.7) (136.0) (158.0) Pre-provision net revenue, FTE (non-GAAP) 30.2 $ 132.1 $ 112.9 $ 83.4 $ 54.7 $ 53.7 $ 23.1 $ As of and for the years ended As of and for the three months ended As of and for the years ended 36 ($ in millions, except per share) RECONCILIATION OF NON-GAAP MEASURES (cont’d) |
| As of and for the three months ended Tangible Common Book Value Ratios 31-Mar-21 31-Dec-20 31-Dec-19 31-Dec-18 31-Dec-17 31-Dec-16 31-Dec-15 Total shareholders' equity 832.0 $ 820.7 $ 766.9 $ 695.0 $ 532.4 $ 536.2 $ 617.5 $ Less: goodwill and core deposit intangibles, net (122.3) (122.6) (123.8) (124.9) (61.2) (66.6) (72.1) Add: deferred tax liability related to goodwill 9.4 9.2 8.2 7.3 10.9 9.3 7.8 Tangible common equity (non-GAAP) 719.1 $ 707.3 $ 651.4 $ 577.4 $ 482.0 $ 478.9 $ 553.3 $ Total assets 6,949.5 $ 6,660.0 $ 5,895.5 $ 5,676.7 $ 4,843.5 $ 4,573.0 $ 4,683.9 $ Less: goodwill and core deposit intangibles, net (122.3) (122.6) (123.8) (124.9) (61.2) (66.6) (72.1) Add: deferred tax liability related to goodwill 9.4 9.2 8.2 7.3 10.9 9.3 7.8 Tangible assets (non-GAAP) 6,836.6 $ 6,546.5 $ 5,780.0 $ 5,559.1 $ 4,793.1 $ 4,515.8 $ 4,619.6 $ Total shareholders' equity to total assets 11.97% 12.32% 13.01% 12.24% 10.99% 11.72% 13.18% Tangible common equity to tangible assets (non-GAAP) 10.52% 10.80% 11.27% 10.39% 10.06% 10.61% 11.98% As of and for the years ended 37 ($ in millions, except per share) RECONCILIATION OF NON-GAAP MEASURES (cont’d) |