Attached files
| file | filename |
|---|---|
| EX-99.1 - EX-99.1 - BLUE OWL CAPITAL INC. | d365230dex991.htm |
| 8-K - 8-K - BLUE OWL CAPITAL INC. | d365230d8k.htm |

Exhibit 99.2 Blue Owl Update May 3, 2021Exhibit 99.2 Blue Owl Update May 3, 2021

CONFIDENTIAL Disclaimers This presentation (this “Investor Presentation”) is provided for informational purposes only and has been prepared to assist interested parties in making their own evaluation with respect to a potential business combination between the Dyal Capital Partners (“Dyal”) division of Neuberger Berman Group LLC (“Neuberger Berman”), Owl Rock Capital Group LLC (“Owl Rock”) and Altimar Acquisition Corporation (“Altimar”) to form Blue Owl Capital Inc. (“Blue Owl” or the “Company”) and related transactions (the “Transaction”) and for no other purpose. No representations or warranties, express or implied are given in, or in respect of, this Investor Presentation. To the fullest extent permitted by law, in no circumstances will Blue Owl, Owl Rock, Dyal, Neuberger Berman, Altimar, or any of their respective subsidiaries, stockholders, affiliates, representatives, partners, directors, officers, employees, advisers or agents be responsible or liable for any direct, indirect or consequential loss or loss of profit arising from use of this Investor Presentation, its contents, its omissions, reliance on the information contained within it, or on opinions communicated in relation thereto or otherwise arising in connection therewith. This Investor Presentation does not purport to be all-inclusive or to contain all of the information that may be required to make a full analysis of Blue Owl or the Transaction. Viewers of this Investor Presentation should each make their own evaluation of Blue Owl and of the relevance and adequacy of the information contained herein and should make sure other investigations as they deem necessary. This communication does not constitute an offer to sell or the solicitation of an offer to buy any securities or a solicitation of any vote or approval, nor shall there be any sale of any securities in any state or jurisdiction in which such offer, solicitation, or sale would be unlawful prior to registration or qualification under the securities laws of such state or other jurisdiction. Use of Projections This Investor Presentation contains financial forecasts or projections with respect to Dyal, Owl Rock or the Company. Projected performance with respect to Dyal, Owl Rock, the Company, the investment vehicles they manage or expect to manage, and the investments such vehicles make or expect to make is provided on a pro forma basis and is based on certain good faith assumptions that Dyal and Owl Rock believe are reasonable (including, without limitation, estimates and targets of future operating results or cash flows). The actual performance will depend on, among other factors, future operating results, including of the investment vehicles and their portfolio companies, the value of certain assets and market conditions at the time of establishment, acquisition or disposition, any related transaction costs, and time and manner of establishment, acquisition and disposition, all of which may differ from the underlying assumptions on which the projected performance data contained herein are based. In addition, there are many risk factors that could cause Dyal and Owl Rock’s assumptions to prove to be incorrect. These risks therefore could cause the actual performance of the Company to be materially different from the current projected, targeted or estimated performance. These projections are provided solely for illustrative purposes, and there can be no assurances that any projections or targets will ultimately be realized, in the manner illustrated herein or at all. No independent registered public accounting firm of Dyal, Owl Rock or the Company has audited, reviewed, compiled, or performed any procedures with respect to the financial forecasts or projections for the purpose of their inclusion in this Investor Presentation, and accordingly, none of them expresses an opinion or provides any other form of assurance with respect thereto for the purpose of this Investor Presentation. These financial forecasts and projections should not be relied upon as being necessarily indicative of future results. Forward Looking Statements This Investor Presentation includes “forward looking statements” within the meaning of the “safe harbor” provisions of the United States Private Securities Litigation Reform Act of 1995. Forward-looking statements may be identified by the use of words such as “estimates,” “projects,” “expects,” “anticipates,” “forecasts,” “plans,” “intends,” “believes,” “seeks,” “may,” “will,” “would,” “should,” “future,” “propose,” “target,” “goal,” “objective,” and “outlook,” and other similar expressions that predict or indicate future events or trends or that are not statements of historical matters. Such forward looking statements include estimated financial information. Such forward looking statements with respect to revenues, earnings, performance, strategies, prospects and other aspects of the businesses of the Company are based on current expectations that are subject to risks and uncertainties, including those described below. A number of factors could cause actual results or outcomes to differ materially from those indicated by such forward looking statements. Investing in unseasoned companies and in sponsors of alternative investment platforms carries significant risk. Operating results in a specified period will be difficult to predict. The performance of Dyal and Owl Rock, and thus the Company, will depend upon their success in structuring, distributing and operating alternative investment vehicles, including current and potential future vehicles, which will impact the operating results of each of Dyal, Owl Rock, the Company, the investment vehicles they manage or expect to manage, and the investments such vehicles make or expect to make are and will be subject to various risks relating to such entities’ operations, including, but not limited to: weaker than anticipated market acceptance of products and services; disruptions in technology development; an inability to successfully manage expanding operations; an inability to attract and retain key management and technical personnel; competition posed by established enterprises; changes in accounting rules or government regulation; weakness in the applicable industries as well as the U.S. and global economy; currency fluctuations; and the effects of other geopolitical events. Each of Dyal, Owl Rock, the Company, the investment vehicles they manage or expect to manage, and the investments such vehicles make or expect to make is subject to the ongoing effects of the COVID-19 pandemic, the impact of which is particularly difficult to forecast. Because all forward- looking statements involve risks and uncertainties, actual results of Dyal, Owl Rock and the Company may differ materially from any expectations, projections or predictions made or implicated in such forward-looking statements. Prospective investors are therefore cautioned not to place undue reliance on such forward-looking statements, which speak only as of the date made. None of Owl Rock, Dyal or the Company commits to update or revise the forward-looking statements, whether as a result of new information, future events or otherwise, except as may be required by law. Non-GAAP Financial Measures; Other Financial and Operational Data This presentation includes certain non-GAAP financial measures that are not prepared in accordance with accounting principles generally accepted in the United States (“GAAP”) and that may be different from non-GAAP financial measures used by other companies. Each of Dyal, Owl Rock and the Company believes that the use of these non-GAAP financial measures provides an additional tool for investors and potential investors to use in evaluating its ongoing operating results and trends. These non-GAAP measures should not be considered in isolation from, or as an alternative to, financial measures determined in accordance with GAAP. See the footnotes on the slides where these measures are discussed. To the extent that forward- looking non-GAAP financial measures are provided, they are presented on a non-GAAP basis without reconciliations of such forward-looking non-GAAP measures due to the inherent difficulty in forecasting and quantifying certain amounts that are necessary for such reconciliation. As used herein and unless otherwise indicated, all IRRs and multiples are presented on a gross basis (i.e., they do not reflect management or other fees, taxes, transaction costs, expenses and general partner carried interest, which will reduce returns and, in the aggregate, are expected to be substantial) unless otherwise indicated. Exact net IRRs and multiples cannot be calculated for individual investments held by Dyal and Owl Rock’s investment vehicles, or a subset of such investments, due to the lack of a mechanism to precisely allocate fees, taxes, transaction costs, expenses and general partner carried interest. Valuations are as of the dates provided herein and do not take into account subsequent events, including the continued impact of COVID-19, which can be expected to have an adverse effect on certain entities identified or contemplated herein. Additional Information and Where to Find It In connection with the Transaction, a registration statement on Form S-4 (the “Registration Statement”) has been declared effective by the Securities and Exchange Commission (the “SEC”), which includes a definitive proxy statement of Altimar (the “Proxy Statement”). Altimar’s shareholders and other interested persons are advised to read the Registration Statement and combined proxy statement/prospectus contained therein and any documents filed in connection therewith, as these materials will contain important information about Blue Owl, Altimar, and the Transaction. The Proxy Statement was mailed to Altimar’s shareholders who were holders of record as of April 23, 2021. The documents filed by Altimar with the SEC may be obtained free of charge at the SEC’s website at www.sec.gov. In addition, the documents filed by Altimar may be obtained free of charge from Altimar at www.altimaracquisition.com. Alternatively, these documents can be obtained free of charge from Altimar upon written request to Altimar Acquisition Corporation, 40 West 57th Street, New York, New York 10019, Attn: Secretary, or by calling 212-287-6767. Participants in Solicitation Altimar and certain of its respective directors and executive officers may be deemed to be participants in the solicitation of proxies from the stockholders of Altimar, in favor of the approval of the Transaction. For information regarding Altimar’s directors and executive officers, please see Altimar’s annual report on Form 10-K filed with the SEC on February 24, 2021 and as amended on April 22, 2021. Additional information regarding the interests of those participants and other persons who may be deemed participants in the transaction may be obtained by reading the Proxy Statement. Free copies of these documents may be obtained as described in the preceding section. Industry and Market Data This Investor Presentation has been prepared by Altimar, Owl Rock and Dyal and includes market data and other statistical information from sources believed by Altimar, Owl Rock and Dyal to be reliable, including independent industry publications, governmental publications or other published independent sources. Some data is also based on the good faith estimates of Altimar, Owl Rock or Dyal, which in each case are derived from its review of internal sources as well as the independent sources. Although Altimar, Blue Owl, Owl Rock and Dyal believe these sources are reliable, Altimar, Owl Rock and Dyal have not independently verified the information and cannot guarantee its accuracy and completeness. Trademarks This Investor Presentation contains trademarks, service marks, trade names and copyrights of Altimar, Blue Owl, Owl Rock and Dyal and other companies, which are the property of their respective owners. 2CONFIDENTIAL Disclaimers This presentation (this “Investor Presentation”) is provided for informational purposes only and has been prepared to assist interested parties in making their own evaluation with respect to a potential business combination between the Dyal Capital Partners (“Dyal”) division of Neuberger Berman Group LLC (“Neuberger Berman”), Owl Rock Capital Group LLC (“Owl Rock”) and Altimar Acquisition Corporation (“Altimar”) to form Blue Owl Capital Inc. (“Blue Owl” or the “Company”) and related transactions (the “Transaction”) and for no other purpose. No representations or warranties, express or implied are given in, or in respect of, this Investor Presentation. To the fullest extent permitted by law, in no circumstances will Blue Owl, Owl Rock, Dyal, Neuberger Berman, Altimar, or any of their respective subsidiaries, stockholders, affiliates, representatives, partners, directors, officers, employees, advisers or agents be responsible or liable for any direct, indirect or consequential loss or loss of profit arising from use of this Investor Presentation, its contents, its omissions, reliance on the information contained within it, or on opinions communicated in relation thereto or otherwise arising in connection therewith. This Investor Presentation does not purport to be all-inclusive or to contain all of the information that may be required to make a full analysis of Blue Owl or the Transaction. Viewers of this Investor Presentation should each make their own evaluation of Blue Owl and of the relevance and adequacy of the information contained herein and should make sure other investigations as they deem necessary. This communication does not constitute an offer to sell or the solicitation of an offer to buy any securities or a solicitation of any vote or approval, nor shall there be any sale of any securities in any state or jurisdiction in which such offer, solicitation, or sale would be unlawful prior to registration or qualification under the securities laws of such state or other jurisdiction. Use of Projections This Investor Presentation contains financial forecasts or projections with respect to Dyal, Owl Rock or the Company. Projected performance with respect to Dyal, Owl Rock, the Company, the investment vehicles they manage or expect to manage, and the investments such vehicles make or expect to make is provided on a pro forma basis and is based on certain good faith assumptions that Dyal and Owl Rock believe are reasonable (including, without limitation, estimates and targets of future operating results or cash flows). The actual performance will depend on, among other factors, future operating results, including of the investment vehicles and their portfolio companies, the value of certain assets and market conditions at the time of establishment, acquisition or disposition, any related transaction costs, and time and manner of establishment, acquisition and disposition, all of which may differ from the underlying assumptions on which the projected performance data contained herein are based. In addition, there are many risk factors that could cause Dyal and Owl Rock’s assumptions to prove to be incorrect. These risks therefore could cause the actual performance of the Company to be materially different from the current projected, targeted or estimated performance. These projections are provided solely for illustrative purposes, and there can be no assurances that any projections or targets will ultimately be realized, in the manner illustrated herein or at all. No independent registered public accounting firm of Dyal, Owl Rock or the Company has audited, reviewed, compiled, or performed any procedures with respect to the financial forecasts or projections for the purpose of their inclusion in this Investor Presentation, and accordingly, none of them expresses an opinion or provides any other form of assurance with respect thereto for the purpose of this Investor Presentation. These financial forecasts and projections should not be relied upon as being necessarily indicative of future results. Forward Looking Statements This Investor Presentation includes “forward looking statements” within the meaning of the “safe harbor” provisions of the United States Private Securities Litigation Reform Act of 1995. Forward-looking statements may be identified by the use of words such as “estimates,” “projects,” “expects,” “anticipates,” “forecasts,” “plans,” “intends,” “believes,” “seeks,” “may,” “will,” “would,” “should,” “future,” “propose,” “target,” “goal,” “objective,” and “outlook,” and other similar expressions that predict or indicate future events or trends or that are not statements of historical matters. Such forward looking statements include estimated financial information. Such forward looking statements with respect to revenues, earnings, performance, strategies, prospects and other aspects of the businesses of the Company are based on current expectations that are subject to risks and uncertainties, including those described below. A number of factors could cause actual results or outcomes to differ materially from those indicated by such forward looking statements. Investing in unseasoned companies and in sponsors of alternative investment platforms carries significant risk. Operating results in a specified period will be difficult to predict. The performance of Dyal and Owl Rock, and thus the Company, will depend upon their success in structuring, distributing and operating alternative investment vehicles, including current and potential future vehicles, which will impact the operating results of each of Dyal, Owl Rock, the Company, the investment vehicles they manage or expect to manage, and the investments such vehicles make or expect to make are and will be subject to various risks relating to such entities’ operations, including, but not limited to: weaker than anticipated market acceptance of products and services; disruptions in technology development; an inability to successfully manage expanding operations; an inability to attract and retain key management and technical personnel; competition posed by established enterprises; changes in accounting rules or government regulation; weakness in the applicable industries as well as the U.S. and global economy; currency fluctuations; and the effects of other geopolitical events. Each of Dyal, Owl Rock, the Company, the investment vehicles they manage or expect to manage, and the investments such vehicles make or expect to make is subject to the ongoing effects of the COVID-19 pandemic, the impact of which is particularly difficult to forecast. Because all forward- looking statements involve risks and uncertainties, actual results of Dyal, Owl Rock and the Company may differ materially from any expectations, projections or predictions made or implicated in such forward-looking statements. Prospective investors are therefore cautioned not to place undue reliance on such forward-looking statements, which speak only as of the date made. None of Owl Rock, Dyal or the Company commits to update or revise the forward-looking statements, whether as a result of new information, future events or otherwise, except as may be required by law. Non-GAAP Financial Measures; Other Financial and Operational Data This presentation includes certain non-GAAP financial measures that are not prepared in accordance with accounting principles generally accepted in the United States (“GAAP”) and that may be different from non-GAAP financial measures used by other companies. Each of Dyal, Owl Rock and the Company believes that the use of these non-GAAP financial measures provides an additional tool for investors and potential investors to use in evaluating its ongoing operating results and trends. These non-GAAP measures should not be considered in isolation from, or as an alternative to, financial measures determined in accordance with GAAP. See the footnotes on the slides where these measures are discussed. To the extent that forward- looking non-GAAP financial measures are provided, they are presented on a non-GAAP basis without reconciliations of such forward-looking non-GAAP measures due to the inherent difficulty in forecasting and quantifying certain amounts that are necessary for such reconciliation. As used herein and unless otherwise indicated, all IRRs and multiples are presented on a gross basis (i.e., they do not reflect management or other fees, taxes, transaction costs, expenses and general partner carried interest, which will reduce returns and, in the aggregate, are expected to be substantial) unless otherwise indicated. Exact net IRRs and multiples cannot be calculated for individual investments held by Dyal and Owl Rock’s investment vehicles, or a subset of such investments, due to the lack of a mechanism to precisely allocate fees, taxes, transaction costs, expenses and general partner carried interest. Valuations are as of the dates provided herein and do not take into account subsequent events, including the continued impact of COVID-19, which can be expected to have an adverse effect on certain entities identified or contemplated herein. Additional Information and Where to Find It In connection with the Transaction, a registration statement on Form S-4 (the “Registration Statement”) has been declared effective by the Securities and Exchange Commission (the “SEC”), which includes a definitive proxy statement of Altimar (the “Proxy Statement”). Altimar’s shareholders and other interested persons are advised to read the Registration Statement and combined proxy statement/prospectus contained therein and any documents filed in connection therewith, as these materials will contain important information about Blue Owl, Altimar, and the Transaction. The Proxy Statement was mailed to Altimar’s shareholders who were holders of record as of April 23, 2021. The documents filed by Altimar with the SEC may be obtained free of charge at the SEC’s website at www.sec.gov. In addition, the documents filed by Altimar may be obtained free of charge from Altimar at www.altimaracquisition.com. Alternatively, these documents can be obtained free of charge from Altimar upon written request to Altimar Acquisition Corporation, 40 West 57th Street, New York, New York 10019, Attn: Secretary, or by calling 212-287-6767. Participants in Solicitation Altimar and certain of its respective directors and executive officers may be deemed to be participants in the solicitation of proxies from the stockholders of Altimar, in favor of the approval of the Transaction. For information regarding Altimar’s directors and executive officers, please see Altimar’s annual report on Form 10-K filed with the SEC on February 24, 2021 and as amended on April 22, 2021. Additional information regarding the interests of those participants and other persons who may be deemed participants in the transaction may be obtained by reading the Proxy Statement. Free copies of these documents may be obtained as described in the preceding section. Industry and Market Data This Investor Presentation has been prepared by Altimar, Owl Rock and Dyal and includes market data and other statistical information from sources believed by Altimar, Owl Rock and Dyal to be reliable, including independent industry publications, governmental publications or other published independent sources. Some data is also based on the good faith estimates of Altimar, Owl Rock or Dyal, which in each case are derived from its review of internal sources as well as the independent sources. Although Altimar, Blue Owl, Owl Rock and Dyal believe these sources are reliable, Altimar, Owl Rock and Dyal have not independently verified the information and cannot guarantee its accuracy and completeness. Trademarks This Investor Presentation contains trademarks, service marks, trade names and copyrights of Altimar, Blue Owl, Owl Rock and Dyal and other companies, which are the property of their respective owners. 2
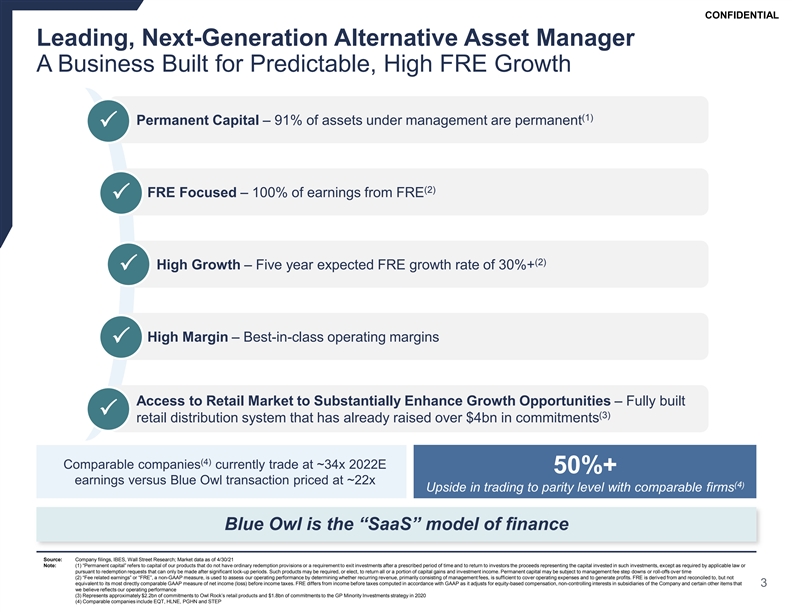
CONFIDENTIAL Leading, Next-Generation Alternative Asset Manager A Business Built for Predictable, High FRE Growth (1) Permanent Capital – 91% of assets under management are permanent P (2) FRE Focused – 100% of earnings from FRE P (2) High Growth – Five year expected FRE growth rate of 30%+ P High Margin – Best-in-class operating margins P Access to Retail Market to Substantially Enhance Growth Opportunities – Fully built P (3) retail distribution system that has already raised over $4bn in commitments (4) Comparable companies currently trade at ~34x 2022E 50%+ earnings versus Blue Owl transaction priced at ~22x (4) Upside in trading to parity level with comparable firms Blue Owl is the “SaaS” model of finance Source: Company filings, IBES, Wall Street Research; Market data as of 4/30/21 Note: (1) “Permanent capital” refers to capital of our products that do not have ordinary redemption provisions or a requirement to exit investments after a prescribed period of time and to return to investors the proceeds representing the capital invested in such investments, except as required by applicable law or pursuant to redemption requests that can only be made after significant lock-up periods. Such products may be required, or elect, to return all or a portion of capital gains and investment income. Permanent capital may be subject to management fee step downs or roll-offs over time (2) “Fee related earnings” or “FRE”, a non-GAAP measure, is used to assess our operating performance by determining whether recurring revenue, primarily consisting of management fees, is sufficient to cover operating expenses and to generate profits. FRE is derived from and reconciled to, but not equivalent to its most directly comparable GAAP measure of net income (loss) before income taxes. FRE differs from income before taxes computed in accordance with GAAP as it adjusts for equity-based compensation, non-controlling interests in subsidiaries of the Company and certain other items that 3 we believe reflects our operating performance (3) Represents approximately $2.2bn of commitments to Owl Rock’s retail products and $1.8bn of commitments to the GP Minority Investments strategy in 2020 (4) Comparable companies include EQT, HLNE, PGHN and STEPCONFIDENTIAL Leading, Next-Generation Alternative Asset Manager A Business Built for Predictable, High FRE Growth (1) Permanent Capital – 91% of assets under management are permanent P (2) FRE Focused – 100% of earnings from FRE P (2) High Growth – Five year expected FRE growth rate of 30%+ P High Margin – Best-in-class operating margins P Access to Retail Market to Substantially Enhance Growth Opportunities – Fully built P (3) retail distribution system that has already raised over $4bn in commitments (4) Comparable companies currently trade at ~34x 2022E 50%+ earnings versus Blue Owl transaction priced at ~22x (4) Upside in trading to parity level with comparable firms Blue Owl is the “SaaS” model of finance Source: Company filings, IBES, Wall Street Research; Market data as of 4/30/21 Note: (1) “Permanent capital” refers to capital of our products that do not have ordinary redemption provisions or a requirement to exit investments after a prescribed period of time and to return to investors the proceeds representing the capital invested in such investments, except as required by applicable law or pursuant to redemption requests that can only be made after significant lock-up periods. Such products may be required, or elect, to return all or a portion of capital gains and investment income. Permanent capital may be subject to management fee step downs or roll-offs over time (2) “Fee related earnings” or “FRE”, a non-GAAP measure, is used to assess our operating performance by determining whether recurring revenue, primarily consisting of management fees, is sufficient to cover operating expenses and to generate profits. FRE is derived from and reconciled to, but not equivalent to its most directly comparable GAAP measure of net income (loss) before income taxes. FRE differs from income before taxes computed in accordance with GAAP as it adjusts for equity-based compensation, non-controlling interests in subsidiaries of the Company and certain other items that 3 we believe reflects our operating performance (3) Represents approximately $2.2bn of commitments to Owl Rock’s retail products and $1.8bn of commitments to the GP Minority Investments strategy in 2020 (4) Comparable companies include EQT, HLNE, PGHN and STEP

CONFIDENTIAL Blue Owl is a Preeminent Provider of Private Market GP Solutions ü Deep relationships facilitate a differentiated ecosystem to deliver GP solutions BROAD RANGE OF CAPITAL SOLUTION STRATEGIES & EXTENSIVE NETWORK OF RELATIONSHIPS Portfolio Companies Fund Solutions GP Solutions Diversified First Lien Technology Opportunistic Secondary Co-Investments GP Lending GP Stakes Lending Lending Lending Lending Solutions AUM: AUM: AUM: AUM: AUM: AUM: To launch To launch $17.2bn $3.0bn $5.4bn $1.5bn $1.0bn $22.8bn Note: Metrics based on Owl Rock and Dyal AUM as of 12/31/20 4CONFIDENTIAL Blue Owl is a Preeminent Provider of Private Market GP Solutions ü Deep relationships facilitate a differentiated ecosystem to deliver GP solutions BROAD RANGE OF CAPITAL SOLUTION STRATEGIES & EXTENSIVE NETWORK OF RELATIONSHIPS Portfolio Companies Fund Solutions GP Solutions Diversified First Lien Technology Opportunistic Secondary Co-Investments GP Lending GP Stakes Lending Lending Lending Lending Solutions AUM: AUM: AUM: AUM: AUM: AUM: To launch To launch $17.2bn $3.0bn $5.4bn $1.5bn $1.0bn $22.8bn Note: Metrics based on Owl Rock and Dyal AUM as of 12/31/20 4

CONFIDENTIAL Blue Owl has a Highly Differentiated Financial Profile ü Blue Owl compares favorably to public alternative asset managers High-Growth, FRE Diversified Alt. Blue Owl (1) (1) Centric Firms Managers ‘22 FRE ‘22 FRE ‘22 FRE FRE-Centricity 100% as % of DE: 73% as % of DE: 60% as % of DE ’20-’22 DE CAGR: 16% ’20-’22 DE CAGR: 23% ’20-’22 DE / (2) DE Growth 65% / 33% (3) (3) (3) L-T DE CAGR: 11% L-T DE CAGR: 17% L-T DE CAGRS Very High % of ’20-’22 DE Blue Owl Visibility of Growth from Relatively High Relatively High 82% (4) Existing Funds + Earnings Growth in Context Fee Waiver Expiry Permanent Capital Permanent Capital Permanence of Permanent Capital as % of AUM: as % of AUM: 91% as % of AUM Capital (5) (6) Nothing of substance 25% ‘22 P-T Op. ‘22 P-T Op. Margin: 48% ’22 P-T Op. Margin: 53% Relative Margins 67% (7) Margin Source: Company filings, Wall Street Research, FactSet and IBES as of 4/30/21 Note: (1) High-Growth, FRE Centric Firms includes EQT, HLNE, PGHN and STEP. Public Diversified Alternative Firms includes APO, ARES, BX, CG and KKR (2) “DE” refers to Distributable Earnings, a non-GAAP measure, which is used to assess performance and amounts available for dividends to members. DE is derived from and reconciled to, but not equivalent to its most directly comparable GAAP measure of net income (loss) before income taxes. Distributable Earnings is FRE less current income taxes and includes (other than with respect to Owl Rock) net realized gains, realized performance income and performance related compensation. DE differs from income before taxes computed in accordance with GAAP as it adjusts for certain items that we believe are indicative of our ability to make our dividend payments. Our presentation of DE represents our operating performance, as further adjusted for performance income and performance related compensation, as applicable. Management believes that these adjustments enable investors to better understand the Company’s earnings that are available for distribution (3) Represents 2020 – 2025E after-tax DE CAGR for Blue Owl and IBES estimates for peers; Represents FY2021E – 2023E EPS CAGR for STEP and 3 or 5-year EPS CAGR for other peers 5 (4) Assumes Dyal Fund V raises $9 billion in total commitments (5) Statistic not reported by firms in the cohort; Permanent capital funds are generally not a significant portion of AUM for these businesses (6) Peer metrics are pro forma for announced and / or closed acquisitions not reflected in year-end financials (including ARES / Landmark, BX / ALIC and KKR / Global Atlantic) (7) Based on pre-tax distributable earnings before minority interest for Blue OwlCONFIDENTIAL Blue Owl has a Highly Differentiated Financial Profile ü Blue Owl compares favorably to public alternative asset managers High-Growth, FRE Diversified Alt. Blue Owl (1) (1) Centric Firms Managers ‘22 FRE ‘22 FRE ‘22 FRE FRE-Centricity 100% as % of DE: 73% as % of DE: 60% as % of DE ’20-’22 DE CAGR: 16% ’20-’22 DE CAGR: 23% ’20-’22 DE / (2) DE Growth 65% / 33% (3) (3) (3) L-T DE CAGR: 11% L-T DE CAGR: 17% L-T DE CAGRS Very High % of ’20-’22 DE Blue Owl Visibility of Growth from Relatively High Relatively High 82% (4) Existing Funds + Earnings Growth in Context Fee Waiver Expiry Permanent Capital Permanent Capital Permanence of Permanent Capital as % of AUM: as % of AUM: 91% as % of AUM Capital (5) (6) Nothing of substance 25% ‘22 P-T Op. ‘22 P-T Op. Margin: 48% ’22 P-T Op. Margin: 53% Relative Margins 67% (7) Margin Source: Company filings, Wall Street Research, FactSet and IBES as of 4/30/21 Note: (1) High-Growth, FRE Centric Firms includes EQT, HLNE, PGHN and STEP. Public Diversified Alternative Firms includes APO, ARES, BX, CG and KKR (2) “DE” refers to Distributable Earnings, a non-GAAP measure, which is used to assess performance and amounts available for dividends to members. DE is derived from and reconciled to, but not equivalent to its most directly comparable GAAP measure of net income (loss) before income taxes. Distributable Earnings is FRE less current income taxes and includes (other than with respect to Owl Rock) net realized gains, realized performance income and performance related compensation. DE differs from income before taxes computed in accordance with GAAP as it adjusts for certain items that we believe are indicative of our ability to make our dividend payments. Our presentation of DE represents our operating performance, as further adjusted for performance income and performance related compensation, as applicable. Management believes that these adjustments enable investors to better understand the Company’s earnings that are available for distribution (3) Represents 2020 – 2025E after-tax DE CAGR for Blue Owl and IBES estimates for peers; Represents FY2021E – 2023E EPS CAGR for STEP and 3 or 5-year EPS CAGR for other peers 5 (4) Assumes Dyal Fund V raises $9 billion in total commitments (5) Statistic not reported by firms in the cohort; Permanent capital funds are generally not a significant portion of AUM for these businesses (6) Peer metrics are pro forma for announced and / or closed acquisitions not reflected in year-end financials (including ARES / Landmark, BX / ALIC and KKR / Global Atlantic) (7) Based on pre-tax distributable earnings before minority interest for Blue Owl

CONFIDENTIAL Blue Owl’s High-Growth, FRE-Focused Earnings Profile ü Highly-attractive business model focused on strong growth, FRE generation, and best-in-class margins (1) ORGANIC AUM GROWTH ($bn) TOTAL REVENUES ($m) (2) Management Fee Revenue (%) 100% 100% 100% 100% 100% 100% Total CAGR: 21.9% $137.2 $120.4 $1,785 $1,664 $99.2 $1,309 $87.7 37% $1,155 $74.4 42% $956 39% $50.9 42% $668 48% 63% 43% 58% 61% 58% 52% 57% (3) 2020A 2021E 2022E 2023E 2024E 2025E 2020E 2021E 2022E 2023E 2024E 2025E (2) Owl Rock Dyal (5) EBITDA ($m) DISTRIBUTABLE EARNINGS TO COMMON ($m) EBITDA Margin (%) Illustrative Dividends at 75% Payout ($) 63.7% 65.3% 68.4% 68.0% 70.2% 68.6% $154m $334m $421m $470m $616m $640m $1,224 $1,169 Total CAGR: 32.9% $890 $853 $821 $790 $624 $626 $561 $445 $425 $206 (3) (4) 2020E 2021E 2022E 2023E 2024E 2025E 2020E 2021E 2022E 2023E 2024E 2025E Note: For illustrative purposes only and there can be no assurance as to the amount or timing of capital raised or other assumptions hereto; Blue Owl projections assume the combination of standalone estimated management cash projections for Owl Rock and Dyal, with incremental middle / back-office costs as previously described. For purposes of this presentation, metrics are represented on a cash basis (1) Projected AUM for GP Capital Solutions excludes co-investments; 2020A AUM represents Owl Rock and Dyal AUM as of 12/31/20 (2) Includes BDC Part I Fees and other fees 6 (3) Excludes impact of $131m pre-tax fee waiver, which expired in October 2020 (4) Includes impact of $98m post-tax fee waiver, which expired in October 2020; CAGR excluding impact of fee-waiver is 22.9% (5) Assumes illustrative 25% tax rateCONFIDENTIAL Blue Owl’s High-Growth, FRE-Focused Earnings Profile ü Highly-attractive business model focused on strong growth, FRE generation, and best-in-class margins (1) ORGANIC AUM GROWTH ($bn) TOTAL REVENUES ($m) (2) Management Fee Revenue (%) 100% 100% 100% 100% 100% 100% Total CAGR: 21.9% $137.2 $120.4 $1,785 $1,664 $99.2 $1,309 $87.7 37% $1,155 $74.4 42% $956 39% $50.9 42% $668 48% 63% 43% 58% 61% 58% 52% 57% (3) 2020A 2021E 2022E 2023E 2024E 2025E 2020E 2021E 2022E 2023E 2024E 2025E (2) Owl Rock Dyal (5) EBITDA ($m) DISTRIBUTABLE EARNINGS TO COMMON ($m) EBITDA Margin (%) Illustrative Dividends at 75% Payout ($) 63.7% 65.3% 68.4% 68.0% 70.2% 68.6% $154m $334m $421m $470m $616m $640m $1,224 $1,169 Total CAGR: 32.9% $890 $853 $821 $790 $624 $626 $561 $445 $425 $206 (3) (4) 2020E 2021E 2022E 2023E 2024E 2025E 2020E 2021E 2022E 2023E 2024E 2025E Note: For illustrative purposes only and there can be no assurance as to the amount or timing of capital raised or other assumptions hereto; Blue Owl projections assume the combination of standalone estimated management cash projections for Owl Rock and Dyal, with incremental middle / back-office costs as previously described. For purposes of this presentation, metrics are represented on a cash basis (1) Projected AUM for GP Capital Solutions excludes co-investments; 2020A AUM represents Owl Rock and Dyal AUM as of 12/31/20 (2) Includes BDC Part I Fees and other fees 6 (3) Excludes impact of $131m pre-tax fee waiver, which expired in October 2020 (4) Includes impact of $98m post-tax fee waiver, which expired in October 2020; CAGR excluding impact of fee-waiver is 22.9% (5) Assumes illustrative 25% tax rate

CONFIDENTIAL Peer Valuation Benchmarking ü Given Blue Owl’s fundamentals, buyside will focus on high-growth FRE centric peers NTM P / E SELECT PUBLIC ALTERNATIVE ASSET MANAGEMENT TRADING METRICS 50x Equity % of Calendarized Calendarized Current Market Cap 52 Week P/E Multiples EV / EBITDA Multiples Dividend Yield Company ($ in mm) High 2021E 2022E 2021E 2022E High-Growth, FRE Centric Firms 40x 37.9 x Partners Group $ 38,705 96.8 % 34.5 x 31.5 x 30.0 x 26.6 x 2.0 % EQT AB 32,275 93.0 44.0 38.2 35.1 30.9 0.8 Hamilton Lane 4,811 92.8 36.0 32.6 30.4 27.1 1.4 30x StepStone 3,326 81.2 41.1 35.4 27.8 24.1 0.8 Median 92.9 % 38.6 x 34.0 x 30.2 x 26.8 x 1.1 % Diversified Alt. Mgmt. Firms 19.9 x 20x Blackstone $ 110,026 97.9 % 24.8 x 22.2 x 22.8 x 20.6 x 3.7 % KKR 52,541 99.0 21.2 17.9 18.2 13.6 1.0 Apollo 24,461 98.4 20.1 16.9 18.1 15.3 4.3 10x Ares 14,771 88.8 22.9 19.7 15.5 15.7 3.6 Carlyle 15,505 99.3 18.5 14.9 15.3 12.2 2.3 Median 98.4 % 21.2 x 17.9 x 18.1 x 15.3 x 3.6 % 0x Apr-2018 Apr-2019 Apr-2020 Apr-2021 ( ) High-Growth, FRE Centric Firms ¹ ( ) Diversified Alt. Mgmt. Firms ² Source: Company filings, IBES, Wall Street Research; Market data as of 4/30/21 Note: (1) High-Growth, FRE Centric Firms includes EQT, HLNE, PGHN and STEP (2) Diversified Alternative Management Firms includes APO, ARES, BX, CG and KKR 7 NTM-Time Weighted P/E Multiple Diversified Alt. Mgmt. HG, FRE CentricCONFIDENTIAL Peer Valuation Benchmarking ü Given Blue Owl’s fundamentals, buyside will focus on high-growth FRE centric peers NTM P / E SELECT PUBLIC ALTERNATIVE ASSET MANAGEMENT TRADING METRICS 50x Equity % of Calendarized Calendarized Current Market Cap 52 Week P/E Multiples EV / EBITDA Multiples Dividend Yield Company ($ in mm) High 2021E 2022E 2021E 2022E High-Growth, FRE Centric Firms 40x 37.9 x Partners Group $ 38,705 96.8 % 34.5 x 31.5 x 30.0 x 26.6 x 2.0 % EQT AB 32,275 93.0 44.0 38.2 35.1 30.9 0.8 Hamilton Lane 4,811 92.8 36.0 32.6 30.4 27.1 1.4 30x StepStone 3,326 81.2 41.1 35.4 27.8 24.1 0.8 Median 92.9 % 38.6 x 34.0 x 30.2 x 26.8 x 1.1 % Diversified Alt. Mgmt. Firms 19.9 x 20x Blackstone $ 110,026 97.9 % 24.8 x 22.2 x 22.8 x 20.6 x 3.7 % KKR 52,541 99.0 21.2 17.9 18.2 13.6 1.0 Apollo 24,461 98.4 20.1 16.9 18.1 15.3 4.3 10x Ares 14,771 88.8 22.9 19.7 15.5 15.7 3.6 Carlyle 15,505 99.3 18.5 14.9 15.3 12.2 2.3 Median 98.4 % 21.2 x 17.9 x 18.1 x 15.3 x 3.6 % 0x Apr-2018 Apr-2019 Apr-2020 Apr-2021 ( ) High-Growth, FRE Centric Firms ¹ ( ) Diversified Alt. Mgmt. Firms ² Source: Company filings, IBES, Wall Street Research; Market data as of 4/30/21 Note: (1) High-Growth, FRE Centric Firms includes EQT, HLNE, PGHN and STEP (2) Diversified Alternative Management Firms includes APO, ARES, BX, CG and KKR 7 NTM-Time Weighted P/E Multiple Diversified Alt. Mgmt. HG, FRE Centric

CONFIDENTIAL Peer Valuation Update Post Announcement VALUATION COMPARISON AT TRANSACTION ANNOUNCEMENT (12/23/20) VS. TODAY 2 20 021 21E E P P/E /E 20 2022 22E E P P/E /E '20- '20-'22E '22E '22E '22E FRE FRE '22E '22E P Pr re- e- Co Comp mpany any A At t A An nn n.. T Tod oday ay ∆ ∆ A At t A An nn n.. T To od day ay ∆ ∆ DE DE CA CAG GR R as as % % DE DE T Tax ax M Mar arg gin in Blue Owl 28.1 x 28.1 x 0.0 x 22.3 x 22.3 x (0.0)x 65.1 % 100.0 % 66.6 % Blue Owl 28.1 x 28.1 x 0.0 x 22.3 x 22.3 x 0.0 x 65.1 % 100.0 % 66.6 % High-Growth, FRE Centric Firms Partners Group 30.2 x 34.5 x 4.2 x 25.9 x 31.5 x 5.6 x 16.6 % 74.0 % 65.3 % EQT AB 34.6 44.0 9.4 31.3 38.2 7.0 57.4 55.5 49.0 Hamilton Lane 35.5 36.0 0.5 31.1 32.6 1.5 8.2 81.4 47.5 StepStone 50.9 41.1 (9.8) 41.9 35.4 (6.5) 14.5 71.0 35.1 Median 35.0 x 38.6 x 2.4 x 31.2 x 34.0 x 3.5 x 15.5 % 72.5 % 48.3 % Source: Company filings, Bloomberg, IBES, Wall Street Research, Eikon; Market data as of 4/30/21. Estimates calendarized to 12/31 year-end for STEP and HLNE; STEP and HLNE FY2020-2022E CAGRs are 24.7% and 11.5%, respectively. 8CONFIDENTIAL Peer Valuation Update Post Announcement VALUATION COMPARISON AT TRANSACTION ANNOUNCEMENT (12/23/20) VS. TODAY 2 20 021 21E E P P/E /E 20 2022 22E E P P/E /E '20- '20-'22E '22E '22E '22E FRE FRE '22E '22E P Pr re- e- Co Comp mpany any A At t A An nn n.. T Tod oday ay ∆ ∆ A At t A An nn n.. T To od day ay ∆ ∆ DE DE CA CAG GR R as as % % DE DE T Tax ax M Mar arg gin in Blue Owl 28.1 x 28.1 x 0.0 x 22.3 x 22.3 x (0.0)x 65.1 % 100.0 % 66.6 % Blue Owl 28.1 x 28.1 x 0.0 x 22.3 x 22.3 x 0.0 x 65.1 % 100.0 % 66.6 % High-Growth, FRE Centric Firms Partners Group 30.2 x 34.5 x 4.2 x 25.9 x 31.5 x 5.6 x 16.6 % 74.0 % 65.3 % EQT AB 34.6 44.0 9.4 31.3 38.2 7.0 57.4 55.5 49.0 Hamilton Lane 35.5 36.0 0.5 31.1 32.6 1.5 8.2 81.4 47.5 StepStone 50.9 41.1 (9.8) 41.9 35.4 (6.5) 14.5 71.0 35.1 Median 35.0 x 38.6 x 2.4 x 31.2 x 34.0 x 3.5 x 15.5 % 72.5 % 48.3 % Source: Company filings, Bloomberg, IBES, Wall Street Research, Eikon; Market data as of 4/30/21. Estimates calendarized to 12/31 year-end for STEP and HLNE; STEP and HLNE FY2020-2022E CAGRs are 24.7% and 11.5%, respectively. 8

CONFIDENTIAL Project Bright Blue It is our mission to achieve the following objectives over next 3 years Trade at parity (or better) with our most similar comparable companies ü Outperform current medium-term FRE expectations ü Pursue selected strategic acquisitions to add complementary “best of breed” capabilities ü 9CONFIDENTIAL Project Bright Blue It is our mission to achieve the following objectives over next 3 years Trade at parity (or better) with our most similar comparable companies ü Outperform current medium-term FRE expectations ü Pursue selected strategic acquisitions to add complementary “best of breed” capabilities ü 9

CONFIDENTIAL Appendix: Peer Valuation Update Detail 12/3/20 4/30/21 PGHN EQT HLNE STEP Median PGHN EQT HLNE STEP Median 2021E P/E 29.3 x 34.6 x 31.3 x 39.9 x 33.0 x 2021E P/E 34.5 x 44.0 x 36.0 x 41.1 x 38.6 x 2022E P/E 24.9 x 31.3 x 27.5 x 32.8 x 29.4 x 2022E P/E 31.5 x 38.2 x 32.6 x 35.4 x 34.0 x 12/23/20 180% PGHN EQT HLNE STEP Median 2021E P/E 30.2 x 34.6 x 35.5 x 50.9 x 35.0 x 2022E P/E 25.9 x 31.3 x 31.1 x 41.9 x 31.2 x 160% 43.9% 140% 32.7% 27.9% 120% 15.5% 100% 80% 12/3/2020 12/27/2020 1/20/2021 2/13/2021 3/9/2021 4/2/2021 4/26/2021 Partners Group EQT AB Hamilton Lane Stepstone Group Source: Company filings, Bloomberg, IBES, Wall Street Research, Eikon; Market data as of 4/30/21 10 Indexed PriceCONFIDENTIAL Appendix: Peer Valuation Update Detail 12/3/20 4/30/21 PGHN EQT HLNE STEP Median PGHN EQT HLNE STEP Median 2021E P/E 29.3 x 34.6 x 31.3 x 39.9 x 33.0 x 2021E P/E 34.5 x 44.0 x 36.0 x 41.1 x 38.6 x 2022E P/E 24.9 x 31.3 x 27.5 x 32.8 x 29.4 x 2022E P/E 31.5 x 38.2 x 32.6 x 35.4 x 34.0 x 12/23/20 180% PGHN EQT HLNE STEP Median 2021E P/E 30.2 x 34.6 x 35.5 x 50.9 x 35.0 x 2022E P/E 25.9 x 31.3 x 31.1 x 41.9 x 31.2 x 160% 43.9% 140% 32.7% 27.9% 120% 15.5% 100% 80% 12/3/2020 12/27/2020 1/20/2021 2/13/2021 3/9/2021 4/2/2021 4/26/2021 Partners Group EQT AB Hamilton Lane Stepstone Group Source: Company filings, Bloomberg, IBES, Wall Street Research, Eikon; Market data as of 4/30/21 10 Indexed Price
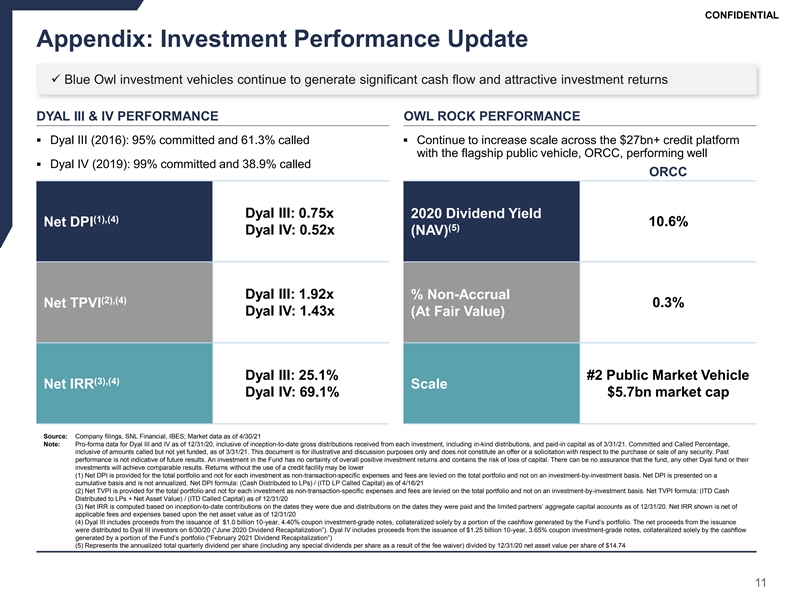
CONFIDENTIAL Appendix: Investment Performance Update ü Blue Owl investment vehicles continue to generate significant cash flow and attractive investment returns DYAL III & IV PERFORMANCE OWL ROCK PERFORMANCE § Dyal III (2016): 95% committed and 61.3% called§ Continue to increase scale across the $27bn+ credit platform with the flagship public vehicle, ORCC, performing well § Dyal IV (2019): 99% committed and 38.9% called ORCC Dyal III: 0.75x 2020 Dividend Yield (1),(4) 10.6% Net DPI (5) Dyal IV: 0.52x (NAV) Dyal III: 1.92x % Non-Accrual (2),(4) 0.3% Net TPVI Dyal IV: 1.43x (At Fair Value) Dyal III: 25.1% #2 Public Market Vehicle (3),(4) Net IRR Scale Dyal IV: 69.1% $5.7bn market cap Source: Company filings, SNL Financial, IBES; Market data as of 4/30/21 Note: Pro-forma data for Dyal III and IV as of 12/31/20, inclusive of inception-to-date gross distributions received from each investment, including in-kind distributions, and paid-in capital as of 3/31/21. Committed and Called Percentage, inclusive of amounts called but not yet funded, as of 3/31/21. This document is for illustrative and discussion purposes only and does not constitute an offer or a solicitation with respect to the purchase or sale of any security. Past performance is not indicative of future results. An investment in the Fund has no certainty of overall positive investment returns and contains the risk of loss of capital. There can be no assurance that the fund, any other Dyal fund or their investments will achieve comparable results. Returns without the use of a credit facility may be lower (1) Net DPI is provided for the total portfolio and not for each investment as non-transaction-specific expenses and fees are levied on the total portfolio and not on an investment-by-investment basis. Net DPI is presented on a cumulative basis and is not annualized. Net DPI formula: (Cash Distributed to LPs) / (ITD LP Called Capital) as of 4/16/21 (2) Net TVPI is provided for the total portfolio and not for each investment as non-transaction-specific expenses and fees are levied on the total portfolio and not on an investment-by-investment basis. Net TVPI formula: (ITD Cash Distributed to LPs + Net Asset Value) / (ITD Called Capital) as of 12/31/20 (3) Net IRR is computed based on inception-to-date contributions on the dates they were due and distributions on the dates they were paid and the limited partners’ aggregate capital accounts as of 12/31/20. Net IRR shown is net of applicable fees and expenses based upon the net asset value as of 12/31/20 (4) Dyal III includes proceeds from the issuance of $1.0 billion 10-year, 4.40% coupon investment-grade notes, collateralized solely by a portion of the cashflow generated by the Fund’s portfolio. The net proceeds from the issuance were distributed to Dyal III investors on 6/30/20 (“June 2020 Dividend Recapitalization”). Dyal IV includes proceeds from the issuance of $1.25 billion 10-year, 3.65% coupon investment-grade notes, collateralized solely by the cashflow generated by a portion of the Fund’s portfolio (“February 2021 Dividend Recapitalization”) (5) Represents the annualized total quarterly dividend per share (including any special dividends per share as a result of the fee waiver) divided by 12/31/20 net asset value per share of $14.74 11CONFIDENTIAL Appendix: Investment Performance Update ü Blue Owl investment vehicles continue to generate significant cash flow and attractive investment returns DYAL III & IV PERFORMANCE OWL ROCK PERFORMANCE § Dyal III (2016): 95% committed and 61.3% called§ Continue to increase scale across the $27bn+ credit platform with the flagship public vehicle, ORCC, performing well § Dyal IV (2019): 99% committed and 38.9% called ORCC Dyal III: 0.75x 2020 Dividend Yield (1),(4) 10.6% Net DPI (5) Dyal IV: 0.52x (NAV) Dyal III: 1.92x % Non-Accrual (2),(4) 0.3% Net TPVI Dyal IV: 1.43x (At Fair Value) Dyal III: 25.1% #2 Public Market Vehicle (3),(4) Net IRR Scale Dyal IV: 69.1% $5.7bn market cap Source: Company filings, SNL Financial, IBES; Market data as of 4/30/21 Note: Pro-forma data for Dyal III and IV as of 12/31/20, inclusive of inception-to-date gross distributions received from each investment, including in-kind distributions, and paid-in capital as of 3/31/21. Committed and Called Percentage, inclusive of amounts called but not yet funded, as of 3/31/21. This document is for illustrative and discussion purposes only and does not constitute an offer or a solicitation with respect to the purchase or sale of any security. Past performance is not indicative of future results. An investment in the Fund has no certainty of overall positive investment returns and contains the risk of loss of capital. There can be no assurance that the fund, any other Dyal fund or their investments will achieve comparable results. Returns without the use of a credit facility may be lower (1) Net DPI is provided for the total portfolio and not for each investment as non-transaction-specific expenses and fees are levied on the total portfolio and not on an investment-by-investment basis. Net DPI is presented on a cumulative basis and is not annualized. Net DPI formula: (Cash Distributed to LPs) / (ITD LP Called Capital) as of 4/16/21 (2) Net TVPI is provided for the total portfolio and not for each investment as non-transaction-specific expenses and fees are levied on the total portfolio and not on an investment-by-investment basis. Net TVPI formula: (ITD Cash Distributed to LPs + Net Asset Value) / (ITD Called Capital) as of 12/31/20 (3) Net IRR is computed based on inception-to-date contributions on the dates they were due and distributions on the dates they were paid and the limited partners’ aggregate capital accounts as of 12/31/20. Net IRR shown is net of applicable fees and expenses based upon the net asset value as of 12/31/20 (4) Dyal III includes proceeds from the issuance of $1.0 billion 10-year, 4.40% coupon investment-grade notes, collateralized solely by a portion of the cashflow generated by the Fund’s portfolio. The net proceeds from the issuance were distributed to Dyal III investors on 6/30/20 (“June 2020 Dividend Recapitalization”). Dyal IV includes proceeds from the issuance of $1.25 billion 10-year, 3.65% coupon investment-grade notes, collateralized solely by the cashflow generated by a portion of the Fund’s portfolio (“February 2021 Dividend Recapitalization”) (5) Represents the annualized total quarterly dividend per share (including any special dividends per share as a result of the fee waiver) divided by 12/31/20 net asset value per share of $14.74 11